

A porous polyethersulfone hollow fiber membrane in a gas humidification process
Gh. Bakeri*a,
S. Naeimifarda,
T. Matsuurabc and
A. F. Ismail*b
aAdvanced Membrane and Biotechnology Research Center, Faculty of Chemical Engineering, Babol Noshirvani University of Technology, Babol, Iran. E-mail: bakeri@nit.ac.ir; afauzi@utm.my; Fax: +98 11 323 34 204; Tel: +98 912 526 5739
bAdvanced Membrane Technology Research Centre (AMTEC), Universiti Teknologi Malaysia, 81310 Skudai, Johor, Malaysia
cIndustrial Membrane Research Institute, Department of Chemical and Biological Engineering, University of Ottawa, Ottawa, ON K1N 6N5, Canada
First published on 23rd December 2014
Abstract
A porous polyethersulfone hollow fiber membrane was fabricated via a dry–wet phase inversion process. The membrane was characterized by measuring the pore size, porosity and LEPw. Scanning electron microscopy (SEM) revealed the presence of finger-like macrovoids in the cross-section of the membrane, which contributed to the reduction of tortuosity. The fabricated membrane was further applied in gas humidification. It was found that the water flux was increased by an increase in the gas and liquid flow rates and temperature but reduced by an increase in gas pressure. The water flux of the fabricated membrane exhibited a gas humidification performance superior to a commercial humidifier, e.g. it has 380% higher water flux than the Perma Pure®1 model PH-60T-24SS at Tliquid = 40 °C.
1. Introduction
The gas humidification process is a major part of various technologies such as fuel cell technology, environmental air/gas humidification, reactant gas humidification and respiratory gas humidification in which the water content of the dry gas(es) should be increased to a specified value, e.g. in proton exchange membrane fuel cell (PEMFC) technology the feed gases (H2 and O2) should be humidified with water vapor to prevent drying of the membrane otherwise the membrane shows higher ionic resistance and the efficiency of PEMFC reduces; or in crop storage, humidification of harvested crops increases the shelf life of the products.Different methods have been proposed for humidification process such as bubble column1 in which gas is bubbled in water, spray column2 in which water is sprayed in gas stream etc., all of which suffer from operational difficulties such as low water transfer rate, high operating cost, low efficiency, mist entrainment etc. Furthermore, these processes need large equipment and a high capital investment.
One alternative for gas humidification is the application of membrane technology which offers the advantages3 such as low operating cost, high modularity and easy control of humidity. In particular, compactness with high water transfer rate seems the most important in fuel cell applications.
In membrane humidification process, liquid water flows on one side of a membrane, dissolves in the membrane and diffuses to the other side of the membrane, the water is evaporated and carried away by a gas stream. The process, also known as adiabatic humidification, is hence based on the solution-diffusion mechanism where a dense membrane such as Nafion membrane is used. The drawback of the process is a very slow mass transfer, requiring high surface area and capital cost. As well, Nafion membrane is very expensive.
In a membrane contactor a porous membrane is used. In contrast to the dense membrane, in a porous membrane water is in contact with one side of a membrane, evaporates at the mouth of membrane pores, diffuses through the pores and the gas side boundary layer, and finally reaches the bulk of the gas stream. As the membrane is porous, water molecules move through the gas filled pores of the membrane fast, facilitating the transport of water. Therefore, membrane contactor based humidifiers are expected to show higher water transfer rate than Nafion membrane based humidifiers.
The application of a composite membrane, which consists of hydrophilic poly(N,N-dimethylaminoethyl methacrylate) (PDMAEMA) as the active layer (in contact with water) and polyacrylonitrile (PAN) as the substrate (in contact with gas), in humidification process was studied by Du et al.4 The water flux increased with gas flow rate and temperature of water but the humidity decreased with the gas flow rate.
Polytetrafluoroethylene (PTFE) porous flat sheet membrane with a pore size of 0.3 μm was used in gas humidification system for polymer electrolyte fuel cell (PEMFC).5 It was reported that the performance of the system was comparable with the bubble humidifier. The relative humidity of the exit gas from humidifier decreased rapidly with increasing the gas flow rate whereas it was nearly independent of the liquid flow rate. In addition, the relative humidity of the exit gas increased from 65% to 90% when the water temperature increased from 30 °C to 50 °C.
A quasi-counter flow parallel-plate membrane contactor (QCFPMC) was used by Yang et al.6 for air humidification process. They used flat sheet PVDF and PTFE porous membranes in a contactor. In their study they defined the effectiveness as:
 | (1) |
The application of flat sheet porous (polysulfone UF membrane) and nonporous membranes (Nafion 112, Nafion 115 and Nafion 117) in gas humidification process was investigated by Park et al.3 to know the effect of flow rate and temperature. The porous membrane showed better results than the Nafion membranes.
There are two mass transfer resistances in the gas humidification by a porous membrane. One is the mass transfer resistance of the membrane that depends on the membrane properties such as pore size and pore size distribution, porosity and surface hydrophobicity, as the penetration of water into membrane pores reduces the performance of the contactor. The other is at the boundary layer in the gas phase that depends on the gas flow regime in the contactor module, i.e. the higher the turbulency in the gas phase the lower the mass transfer resistance. This aspect is controlled by the gas flow rate and the geometry of contactor module.
In the liquid phase, as the liquid is generally pure water, there is no mass transfer resistance.7 But as the liquid evaporates at the membrane–liquid interface, the temperature of liquid at the interface drops, causing further decrease in vapor transport. The temperature at the interface depends on the liquid side flow regime and temperature.
The objective of this research is the application of porous hollow fiber PES membrane in gas humidification process. To the best of our knowledge, this system has not yet been investigated until now. The membrane was fabricated via dry–wet phase inversion process where water as a nonsolvent additive was added to the spinning solution to promote the phase inversion process. The fabricated membrane was characterized by different techniques and used in a membrane contactor to humidify dry nitrogen gas. The effects of gas and liquid flow rates, water temperature and the gas pressure on the water flux and humidity of the exit gas were studied.
2. Experimental
2.1. Materials
Polyethersulfone (PES) purchased from Arkema Inc. was dried at 70 °C overnight before use. N-Methyl-2-pyrrolidinone (NMP) [CAS no. 872-50-4] with a purity of 99.5 wt% purchased from Merck was used as solvent without further purification. Distilled water was used as nonsolvent additive to the polymer solution. Helium gas with a purity more than 99.5 vol% was used for gas permeation test and nitrogen gas with a purity more than 99 vol% was used for gas humidification tests.2.2. Dope preparation
Predetermined amount of PES polymer was dissolved in NMP to make 25 wt% solution which was further mixed with NMP and distilled water to prepare the spinning dope. The composition of the spinning dope is given in Table 1. The viscosity of the polymer solution was measured using viscometer EW-98965-40, Cole Parmer, USA.| PES (wt%) | Water/NMP | Solvent (wt%) | Solution viscosity (centipoise) |
|---|---|---|---|
| 15 | 0.05 | 85 | 216.8 |
2.3. Preparation of hollow fibers
Spinning of hollow fibers by the dry–wet spinning method is described elsewhere in detail;8 briefly the polymer solution and bore fluid were extruded from the annulus and the tube of a tube-in-orifice spinneret, respectively, at constant flow rates. After traveling through the air gap (1 cm), the fibers went into a water bath of ambient temperature, where the nascent fibers was coagulated. After spinning, the fibers were kept immersed in water for several days to remove the residual solvent and then dried naturally at room temperature while being hung vertically. The spinning conditions are given in Table 2.| Air gap (cm) | 1 |
| Bore fluid | Distilled water |
| External coagulant | Tap water |
| Bore fluid temperature (°C) | Room temperature |
| External coagulant temperature (°C) | Room temperature |
2.4. Hollow fiber module preparation and gas permeation test
The fibers were assembled in a module to conduct the gas permeation and liquid entry pressure of water (LEPw) tests. One end of fibers was closed with epoxy glue while the other end was potted in stainless steel tubing. In gas permeation test, the permeated gas flows through the open end to the bubble flow meter while in liquid entry pressure of water test, water was sent to the lumen side of fiber through the open end.As the membrane is porous, the pore size of the membrane has a critical effect on its performance; the larger the pores the more is the flux of water vapor through the membrane. But, on the other hand, the easier becomes the penetration of water into membrane pores, which leads to rapid reduction of the flux. Among many methods proposed to determine the membrane pore size, the gas permeation test seems one of the simplest, since it requires only the measurement of gas permeance at different pressures. The gas permeation system used in this work is shown schematically in Fig. 1, where helium gas is sent to the shell side of the module and the flow rate of the permeated gas through the lumen side of membrane is measured by a bubble flow meter. In gas permeation test it is assumed that the pores are cylindrical and straight and the flow of gas is under the combined Poiseuille and Knudsen flow regimes.9
 | ||
| Fig. 1 Schematic of gas permeation test system. | ||
Accordingly, the total gas permeance can be written as eqn (2).
 | (2) |
![[P with combining macron]](https://www.rsc.org/images/entities/i_char_0050_0304.gif) is the total gas permeance (mol m−2 Pa−1 s−1), T is the absolute temperature (K), rP,m is the mean pore radius (m), ξ is surface porosity (
is the total gas permeance (mol m−2 Pa−1 s−1), T is the absolute temperature (K), rP,m is the mean pore radius (m), ξ is surface porosity ( where AP is the area of pores and AT is total area of membrane), LP is the effective pore length (m), R is the universal gas constant (8.314 J mol−1 K−1), M is the molecular weight of gas (kg mol−1), μ is the viscosity of gas (Pa s) and
 ![[p with combining macron]](https://www.rsc.org/images/entities/i_char_0070_0304.gif) is the mean pressure (Pa) (
is the mean pressure (Pa) ( where pu is upstream pressure and pd is downstream pressure). Therefore, the plot of versus should be a straight line of which the slope and intercept of the line can be used in eqn (3) and (4) to calculate the mean pore size and effective surface porosity of membrane.
 | (3) |
 | (4) |
In this study, helium gas was used as the feed gas and the permeance was measured at various pressures that ranged from 1 to 3 barg.
2.5. Measurement of liquid entry pressure of water (LEPw)
Liquid entry pressure is the minimum pressure required to let the liquid enter into membrane pores. It depends on the surface properties of membrane such as the pore size and the surface hydrophobicity. It also depends on the properties of liquid such as surface tension. When LEPw is too low, the membrane is more susceptible to the pore wetting.The same module for gas permeation test was used to measure the LEPw. Five fibers were assembled in the module. Distilled water was supplied to the lumen side of the fibers and the pressure was slowly increased with a step size of 0.2 bar. The pressure at which the first water droplet appeared at the outer surface of membrane was reported as LEPw.
2.6. Membrane porosity and tortuosity
As the diffusion of water vapor takes place in the membrane pore, the membrane porosity should have a strong effect on the vapor flux. Hence the porosity is measured by the method described elsewhere in detail.10 Briefly, the weight and length of wet and dry hollow fibers were measured to obtain the membrane porosity (ε) through eqn (5)–(9).
 | (5) |
 | (6) |
| E = 1 − (1 − Sl)3 | (7) |
 | (8) |
 | (9) |
The membrane tortuosity depends on the geometry of membrane pores; the higher the tortuosity the slower the mass transfer. Srisurichan et al.11 proposed eqn (10) to calculate the membrane tortuosity (τ) from the membrane porosity (ε).
 | (10) |
2.7. Cloud point measurement
The thermodynamic stability of the spinning solution was evaluated by measuring the cloud point. Water was added as the coagulant drop-wise to the spinning solution with gentle mixing at room temperature until the solution could remain cloudy for a few hours. From the weight of the added coagulant, the composition at the cloud point was determined. The experiments were conducted at room temperature.2.8. Scanning electron microscopy (SEM)
Scanning electron microscopy was used to observe the structure of membrane cross-section with a magnification of 400. The fiber was broken in liquid nitrogen and then platinum (Pt) sputtered.2.9. Gas humidification test
The humidification system is presented schematically in Fig. 2. Both ends of hollow fiber membranes were potted in a stainless tubing (di = 1 cm) and cut after the epoxy resin was hardened to make them open. The module was insulated to prevent any heat transfer from/to environment. Water was pumped from the reservoir to the lumen side of the hollow fiber after being heated in a heat exchanger. The pressure of water was monitored by the pressure gauge while the liquid (water) flow rate was controlled by the valve at the exit of liquid.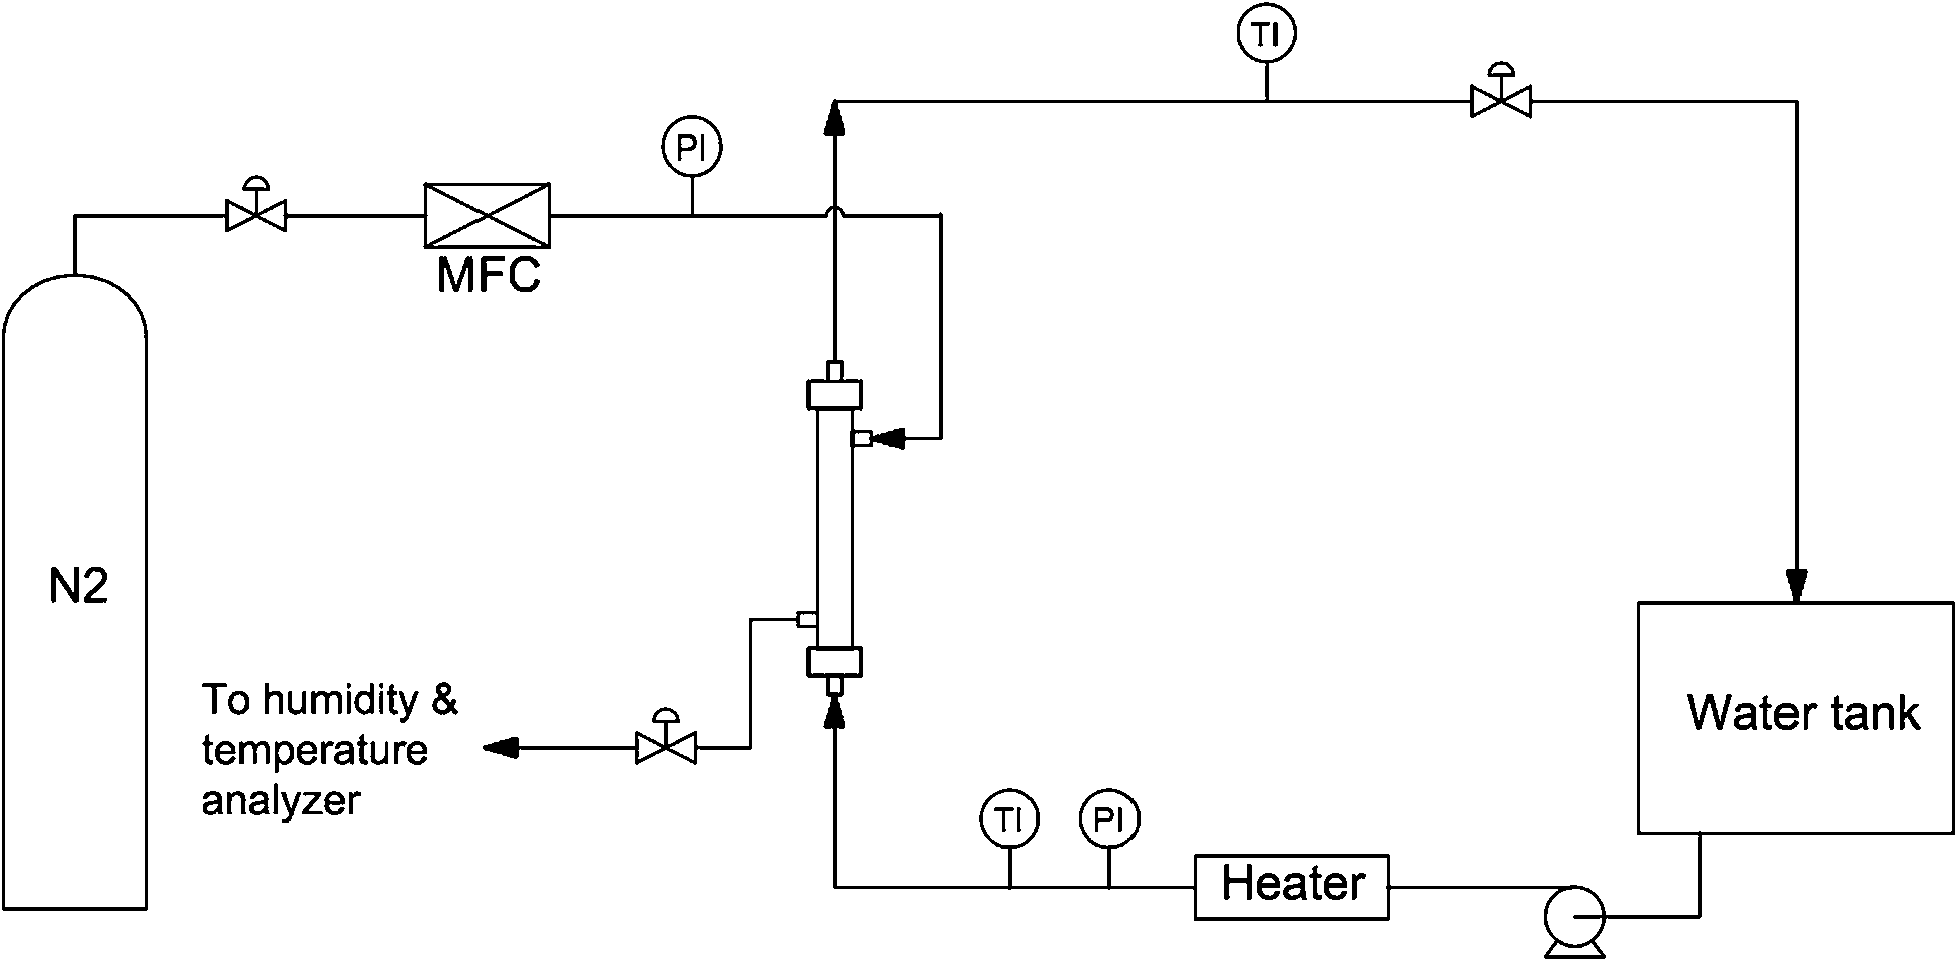 | ||
| Fig. 2 Schematics of humidification system, TI: temperature indicator, PI: pressure indicator, MFC: mass flow controller. | ||
Dry nitrogen gas flowed into the shell side of the hollow fiber module in a counter current mode. Gas flow rate was controlled by a mass flow controller (model: Aalborg DFC26) and the gas pressure by the valve at the gas exit. To prevent the bubbling of the gas into the liquid, the pressure of liquid was maintained 0.5 bar higher than gas.
The temperature and relative humidity (RH) of gas was measured at the contactor exit by humidity analyzer (model: Lutron LM-8000). The flux of water transferred to the gas stream was calculated through the temperature and relative humidity of the exit gas and the flow rate of dry N2 gas.
The effects of liquid and gas flow rates, inlet liquid temperature and pressure of the inlet gas on the water vapor flux and relative humidity of exit gas were investigated. The operational parameters at which experiments were conducted are presented in Table 3.
| Parameter | Investigated value |
|---|---|
| Liquid temperature (°C) | 30, 45, 60, 75 |
| Gas pressure (bar) | 1, 3 |
| Gas flow rate (standard liter per minute (SLPM)) | 1, 2, 3, 4, 5 |
3. Results and discussion
3.1. Membrane characterization test results
The fabricated membrane was characterized by different test methods and the results are presented in Table 4. The porosity of the membrane is high due to low polymer concentration which was found to be only 14% at the cloud point. The low viscosity of polymer solution also facilitated the intrusion of the coagulant during the phase inversion process.12 The rapid phase inversion promotes the formation of fingerlike macrovoids,13,14 which increases the void fraction of membrane and reduces the membrane tortuosity.| Mean pore size (nm) | 653 |
| Effective surface porosity (m−1) | 28 |
Gas permeation rate @ 1.5 bar  |
32![[thin space (1/6-em)]](https://www.rsc.org/images/entities/char_2009.gif) 032 032 |
| Membrane porosity | 0.834 |
| LEPw (bar) | 4.2 |
| Membrane tortuosity | 1.628 |
The presence of fingerlike macrovoids was confirmed by the SEM micrograph (Fig. 3), where the voids originate from the inner and outer surfaces and extend to the middle part of membrane cross-section. The voids near the outer surface are smaller and shorter due to the formation of the nascent skin layer at the outer surface while the fiber was travelling through the air gap. Furthermore, there is a thin spongelike layer in the middle of membrane cross section that can be ascribed to the slow phase inversion process in the middle of membrane cross-section where the penetration depth for the coagulant was the longest.
 | ||
| Fig. 3 SEM micrographs of fabricated membrane (a) partial cross-section, (b) full cross-section. | ||
The experimental values obtained from the gas permeation tests are presented as helium gas permeance versus mean pressure together with the best fit linear line in Fig. 4. The surface properties of the membrane such as the pore size and the surface porosity were calculated using the method described in Section 2.4.
 | ||
| Fig. 4 The helium gas permanence versus mean pressure for fabricated membrane. | ||
It was reported earlier that the structure of the skin layer strongly depends on the stability of the spinning solution.15 The earlier study on the effect of nonsolvent additive to PEI spinning solution also showed that water as an additive made the spinning solution least stable, resulting in the membrane of high porosity and high gas permeance.16
Blending water as a strong nonsolvent additive to PES solution reduces the thermodynamic stability of solution and enhances the surface porosity of membrane. In addition, the viscosity of PES/NMP/water solution is not significantly higher than the PES/NMP solution (the PES/NMP/water solution viscosity is 216.8 cp while the viscosity for the PES/NMP solution is 180 cp) even though the cloud point test results show a significant decrease in the stability of polymer solution (7.481 g water per 100 g solution for PES/NMP/water solution and 11.99 g water for PES/NMP solution). Therefore, the spinning solution used in this study has a low thermodynamic stability and a viscosity which enable to create a porous membrane, suitable for contactor applications.
The penetration of liquid into membrane pores reduces the vapor diffusion path length in the pore as reported elsewhere.17 However, the penetration of liquid into membrane pores increases the heat transfer resistance as the liquid is stagnant in the pores. Furthermore, controlling the penetration depth in the membrane pores is not easy and complete filling the pores with liquid may contaminate the gas stream with liquid droplets. Therefore, penetration of liquid into membrane pores reduces the water flux by the latter effect.
The LEPw value is sufficiently high to prevent the pore wetting. It should be noted however that LEPw test was done at room temperature. LEPw may change significantly at high temperatures since the water surface tension and contact angle decrease with an increase in temperature.
3.2. Humidification test results
 | ||
| Fig. 5 The plot of water flux and relative humidity of the exit gas versus liquid velocity, (a) T = 30 °C, P = 1 bar, Qgas = 3 SLPM. (b) T = 60 °C, P = 1 bar, Qgas = 3 SLPM. | ||
 | ||
| Fig. 6 The plot of (a) water flux and (b) relative humidity of the exit gas at different liquid temperatures; P = 1 bar, Qgas = 1 SLPM. | ||
According to Arrhenius equation (eqn (11)), water flux W (kg m−2 h−1) was plotted versus 1/T for the liquid velocities of 0.5, 1 and 1.5 m s−1. Fig. 7 shows an example of Vliquid = 1 m s−1, while similar linear relationships were obtained for the other liquid velocities with R2 more than 0.97. Based on the plots, the average activation energy was 17.7 kJ mol−1, which is much smaller than the heat of evaporation of water (44 kJ mol−1 at 25 °C) due to the effects of the other factors such as the mass transfer coefficients.
 | (11) |
 | ||
| Fig. 7 The plot of ln(water flux) versus T−1 for Vliquid = 1 m s−1. | ||
Furthermore, increasing liquid temperature improves the temperature gradient in liquid side of the contactor which enhances the heat transfer to the liquid on the membrane surface. In addition, heat is transferred from liquid phase to the gas stream by two mechanisms: (1) conduction through the membrane (2) through the sensible heat of transferred vapor. Higher water temperature enhances the heat transfer to gas phase by these two mechanisms and increases the absorption capacity of gas for vapor. In Fig. 8, the temperatures of exit gas versus liquid velocity at different liquid temperatures were presented.
 | ||
| Fig. 8 The plot of exit gas temperature at different liquid temperatures; P = 1 bar, Qgas = 3 SLPM. | ||
 | ||
| Fig. 9 The plot of (a) water flux and (b) relative humidity of the exit gas at different pressures; T = 45 °C, Qgas = 2 SLPM. | ||
 | ||
| Fig. 10 The plot of (a) water flux and (b) relative humidity of the exit gas at different pressures; T = 75 °C, Qgas = 2 SLPM. | ||
 | ||
| Fig. 11 The plot of (a) water flux and (b) relative humidity of the exit gas at different gas flow rates; T = 60 °C, P = 1 bar. | ||
The results obtained in this study were compared with the results reported by other researchers. Chen et al.18 used a commercial Nafion membrane based humidifier, Perma Pure®1 model PH-60T-24SS and studied the effect of operating parameters. The humidifier comprises 60 Nafion membranes with a length of 610 mm and inner and outer diameter of 1.32 mm and 1.6 mm, respectively. Water flows in the shell side of humidifier while dry gas flows in the lumen side. The temperatures of air (Tair) and water (Tliquid) were kept constant at 27 °C and 19 °C, respectively, and the air flow rate (Qgas) was 10 SLPM. Corresponding to these operational parameters, the water flux was 0.08 L m−2 h−1. In this work, at Tliquid = 30 °C, gas pressure (P) = 1 bar and Qgas = 5 SLPM, the water flux was 2.13 L m−2 h−1, which is 2700% higher than Chen et al.'s result. As well, in Chen et al.'s work, corresponding to Tair and Qgas of 22 °C and 50 SLPM, respectively, and Tliquid = 40 °C, the water flux was 0.44 L m−2 h−1, which is 380% lower than the value obtained in this work.
Kang et al.21 used a commercial humidifier, Perma Pure 150-480-7PP, for their experiments. The humidifier contained 480 Nafion membranes with a length of 17.8 cm and inner and outer diameters of 0.71 mm and 0.76 mm, respectively. Water flows through the lumen side and gas flows through the shell side of the contactor. When Tliquid and Tair were 60 °C and 25 °C, respectively, and at Qgas = 25 L min−1, the water flux was 1.77 L m−2 h−1. In this work, corresponding to Tliquid = 60 °C and Qgas = 5 SLPM, water flux and is 4.93 L m−2 h−1 which is 180% higher than Kang et al.'s work.
Samimi et al.17 fabricated porous PES and PS flat sheet membranes incorporating TiO2 nanoparticles to increase the hydrophilicity of the membranes for gas humidification. The highest water flux was obtained by the membrane fabricated from the solution composed of 16 wt% PS and 0.1 wt% TiO2 in DMF, which was 0.2125 L m−2 h−1 at Tliquid = 25 °C and Qgas = 1 L min−1. In this work, corresponding to the same operating conditions, the water flux was 0.78 L m−2 h−1, which is 260% higher than Samimi et al.'s work. The significant difference in water flux is probably due to the lower wettability of PES hollow fiber membrane which prevents the penetration of liquid into membrane pores. Yang et al.6 studied the effect of membrane pore size on the effectiveness of humidifier using PTFE and PVDF membranes. They showed that the effectiveness decreases as the pore size increases. Unlikely, Samimi et al.17 reported that water penetration into membrane pores decreases the diffusion distance between liquid surface and gas stream and can enhance the performance of humidifier (Table 5).
| Polymer type | Membrane type | Fluid in lumen | Fluid in shell | Liquid temp. (°C) | Gas temp. (°C) | Liquid velocity (m s−1) | Gas flow rate (SLPM) | Water flux (L m−2 h−1) | Ref. |
|---|---|---|---|---|---|---|---|---|---|
| a HF: hollow fiber, NA: not available. | |||||||||
| Nafion | HF | Dry gas | Water | 40 | 22 | NA | 50 | 0.44 | 18 |
| PES | HF | Water | Dry gas | 30 | Room | 1.8 | 5 | 2.13 | This study |
| Nafion | HF | Water | Dry gas | 60 | 25 | NA | 25 | 1.77 | 21 |
| PES | HF | Water | Dry gas | 60 | Room | 1.81 | 5 | 4.93 | This study |
| PS | Flat sheet | — | — | 25 | NA | NA | 1 | 0.21 | 17 |
| PES | HF | Water | Dry gas | 30 | Room | 1.7 | 1 | 0.78 | This study |
4. Conclusions
PES hollow fibers were fabricated by the dry–wet spinning method with water as the nonsolvent additive to promote the phase inversion process. The hollow fibers were then characterized by the mean pore size, porosity and LEPw. The hollow fibers were further tested for gas humidification and the effects of various operating parameters on the water flux and relative humidity of exit gas were investigated. The conclusions are as follow:1 The fabricated hollow fiber membrane has a high porosity and a large mean pore size due to the fast phase inversion process.
2 Finger-like macrovoids were formed in the membrane due to the fast intrusion of coagulant into membrane structure.
3 The membrane's LEPw is high enough for the long term operation of humidifier.
4 The water flux and relative humidity of exit gas increased with an increase in liquid flow rate.
5 The water flux and relative humidity of exit gas increased with the liquid temperature.
6 The water flux and relative humidity of exit gas decreased with an increase in gas pressure.
7 The water flux increased and the relative humidity of exit gas decreased with the gas flow rate.
8 The fabricated membrane showed higher water flux than any of in-house made and commercial humidifiers, e.g. at Tliquid = 30 °C, P = 1 bar and Qgas = 5 SLPM, the water flux of PES membrane is 2700% higher than a commercial humidifier, Perma Pure®1 model PH-60T-24SS.
Nomenclature
| AP | Area of pores (m2) |
| AT | Area of membrane (m2) |
| LP | Effective pore length (m) |
| M | Molecular weight (kg mol−1) |
| PK | Gas permeance under Knudsen flow regime (mol m−2 Pa−1 s−1) |
| PP | Gas permeance under Poiseuille flow regime (mol m−2 Pa−1 s−1) |
| Total gas permeance (mol m−2 Pa−1 s−1) |
| Mean pressure (Pa) |
| pu | Upstream pressure (Pa) |
| pd | Downstream pressure (Pa) |
| R | Universal gas constant (8.314 J mol−1 K−1) |
| rP,m | Mean pore radius (m) |
| T | Absolute temperature (K) |
| ξ | Surface porosity |
| μ | Viscosity (Pa s) |
| ε | Membrane porosity |
| τ | Membrane tortuosity |
References
- G. Vasua, A. K. Tangirala, B. Viswanathan and K. S. Dhathathreyan, Continuous bubble humidification and control of relative humidity of H2 for a PEMFC system, Int. J. Hydrogen Energy, 2008, 33, 4640–4648 CrossRef PubMed.
- A. Traverso, Humidification tower for humid air gas turbine cycles: experimental analysis, Energy, 2010, 35, 894–901 CrossRef PubMed.
- S. K. Park, E. A. Cho and I. H. Oh, Characteristics of membrane humidifiers for polymer electrolyte membrane fuel cells, Korean J. Chem. Eng., 2005, 22(6), 877–881 CrossRef CAS.
- J. R. Du, L. Liu, A. Chakma and X. Feng, Using poly(N,N-dimethylaminoethylmethacrylate)/polyacrylonitrile composite membranes for gas dehydration and humidification, Chem. Eng. Sci., 2010, 65, 4672–4681 CrossRef CAS PubMed.
- K. Ramya, J. Sreenivas and K. S. Dhathathreyan, Study of a porous membrane humidification method in polymer electrolyte fuel cells, Int. J. Hydrogen Energy, 2011, 36, 14866–14872 CrossRef CAS PubMed.
- M. Yang, S. M. Huang and X. Yang, Experimental investigations of a quasi-counter flow parallel-plate membrane contactor used for air humidification, Energy Build, 2014, 80, 640–644 CrossRef PubMed.
- L. Z. Zhang and S. M. Huang, Coupled heat and mass transfer in a counter flow hollow fiber membrane module for air humidification, Int. J. Heat Mass Transfer, 2011, 54, 1055–1063 CrossRef CAS PubMed.
- M. Rezaei, A. F. Ismail, S. A. Hashemifard, Gh. Bakeri and T. Matsuura, Experimental study on the performance and long-term stability of PVDF/Montmorillonite hollow fiber mixed matrix membranes for CO2 separation process, Int. J. Greenhouse Gas Control, 2014, 26, 147–157 CrossRef CAS PubMed.
- K. Li, Ceramic membranes for separation and reaction, John Wiley & Sons, 2007 Search PubMed.
- Gh. Bakeri, A. F. Ismail, M. Rahimnejad, T. Matsuura and D. Rana, The effect of bore fluid type on the structure and performance of polyetherimide hollow fiber membrane in gas–liquid contacting processes, Sep. Purif. Technol., 2012, 98, 262–269 CrossRef CAS PubMed.
- S. Srisurichan, R. Jiraratananon and A. G. Fane, Mass transfer mechanisms and transport resistances in direct contact membrane distillation process, J. Membr. Sci., 2006, 277, 186–194 CrossRef CAS PubMed.
- W. Albrecht, Th. Weigel, M. Schossig-Tiedemann, K. Kneifel, K. V. Peinemann and D. Paul, Formation of hollow fiber membranes from poly(ether imide) at wet phase inversion using binary mixtures of solvents for the preparation of the dope, J. Membr. Sci., 2001, 192, 217–230 CrossRef CAS.
- S. A. McKelvey and W. J. Koros, Phase separation, vitrification, and the manifestation of macrovoids in polymeric asymmetric membranes, J. Membr. Sci., 1996, 112, 29–39 CrossRef CAS.
- A. J. Reuvers and C. A. Smolders, Formation of membranes by means of immersion precipitation: Part II. the mechanism of formation of membranes prepared from the system cellulose acetate–acetone–water, J. Membr. Sci., 1987, 34, 67–86 CrossRef CAS.
- A. Mansourizadeh and A. R. Pouranfard, Microporous polyvinylidene fluoride hollow fiber membrane contactors for CO2 stripping: Effect of PEG-400 in spinning dope, Chem. Eng. Res. Des., 2014, 92, 181–190 CrossRef CAS PubMed.
- Gh. Bakeri, T. Matsuura and A. F. Ismail, The effect of phase inversion promoters on the structure and performance of polyetherimide hollow fiber membrane using in gas–liquid contacting process, J. Membr. Sci., 2011, 383, 159–169 CrossRef CAS PubMed.
- A. Samimi, S. A. Mousavi, A. Moallemzadeh, R. Roostaazad, M. Hesampour, A. Pihlajamaki and M. Manttari, Preparation and characterization of PES and PSU membrane humidifiers, J. Membr. Sci., 2011, 383, 197–205 CrossRef CAS PubMed.
- D. Chen, W. Li and H. Peng, An experimental study and model validation of a membrane humidifier for PEM fuel cell humidification control, J. Power Sources, 2008, 180, 461–467 CrossRef CAS PubMed.
- J. R. Du, L. Liu, A. Chakma and X. Feng, Using poly(N,N-dimethylaminoethyl methacrylate)/polyacrylonitrile composite membranes for gas dehydration and humidification, Chem. Eng. Sci., 2010, 65, 4672–4681 CrossRef CAS PubMed.
- D. Kadylak and W. Mérida, Experimental verification of a membrane humidifier model based on the effectiveness method, J. Power Sources, 2010, 195, 3166–3175 CrossRef CAS PubMed.
- S. Kang, K. Min and S. Yu, Two dimensional dynamic modeling of a shell-and-tube water-to-gas membrane humidifier for proton exchange membrane fuel cell, Int. J. Hydrogen Energy, 2010, 35, 1727–1741 CrossRef CAS PubMed.
| This journal is © The Royal Society of Chemistry 2015 |