One-pot, template-free synthesis of hydrophobic single-crystalline La(OH)3 nanowires with tunable size and their d0 ferromagnetic properties

Juan Fengab, Xinghua Li*a, Mingzi Wanga, Xinliang Zhenga, Jintao Baiac, Li Wangb and Yong Peng*b
aSchool of Physics, Northwest University, Xi'an 730000, China. E-mail: lixinghua04@gmail.com
bKey Laboratory of Magnetism and Magnetic Materials of Ministry of Education, School of Physical Science and Technology, Lanzhou University, Lanzhou 730000, China. E-mail: pengy@lzu.edu.cn
cInstitute of Photonics and Photo-Technology, Provincial Key Laboratory of Photoelectronic Technology, Northwest University, Xi'an 730000, China

Received 8th November 2014 , Accepted 28th January 2015

First published on 28th January 2015


Abstract

Hydrophobic single-crystalline La(OH)3 nanowires with tunable size have been successfully fabricated by a facile one-pot liquid–solid-solution (LSS) assisted hydrothermal method without any template and their morphology, chemistry and crystal structure were characterized on the nanoscale. Their average diameter and length strongly depend on the reaction time and the selection of solvents, which is due to the Ostwald ripening and oriented attachment mechanisms. XRD patterns and SAED analysis of numerous nanowires show that the La(OH)3 nanowires have a pure hexagonal structure without any impurities. TEM image and HAADF-STEM element mapping analysis indicate that the La(OH)3 nanowires have a uniform size, smooth surface and pure chemical phase. HRTEM images and CBED patterns of individual La(OH)3 nanowires suggest that each nanowire is single crystalline. Magnetic measurements reveal that the La(OH)3 nanowires show a d0 room-temperature ferromagnetic behavior. This study highlights the basic morphological, chemical and structural information for La(OH)3 nanowires, which is critical for their applications in nanodevices and nanoelectronics.

1. Introduction

Since the discovery of carbon nanotubes in 1991,1 the design and synthesis of one-dimensional (1D) nanostructures has been an exciting, fascinating and rapidly expanding research field in nanoscience and nanotechnology, owing to their outstanding magnetic, electrical and optical properties along with their unique high-aspect-ratio effect.2–10 These remarkable properties are significant not only from a fundamental point in mesoscopic physics, such as quantized conduction, spin transport, electron–phonon and electron–electron effects which are different from their corresponding bulk and nanoparticles,11,12 but also for their potential applications in nanodevice generation as active components.13,14 Nowadays, many groundbreaking efforts have been made on the fabrication of 1D nanostructural materials.9,15–20 However, it is still a big challenge to precisely control the size, purity, compositions and crystal structures of 1D nanomaterials on the nanoscale in the absence of catalysts and templates.20,21

As a kind of the most fascinating functional nanomaterials, rare earth compounds have been extensively investigated in both the fundamental science and technological applications owing to their special physical and chemical characteristic originating from the electron transition in 4f shell.22–27 Among them, nanostructured lanthanum hydroxides (La(OH)3) have been widely applied in fields of catalyst,28 superconductors,29 optical coatings,30 exhaust-gas convectors,31 hydrogen storage materials32 and high dielectric constant gate dielectrics.33 As we know, the advanced functions and applications of nanostructures strongly depend on their chemical and physical properties, which are greatly influenced by not only the crystal structures and chemical compositions but also the shape, size and dimensionality of the nanostructures. Therefore, when rare earth hydroxides are prepared in the form of 1D nanostructures, they are proposed to be novel functionalized materials resulting from the unique shape and quantum confinement effects. Besides, the 1D rare earth hydroxides can be used for the construction of nanoelectronics and nanodevices, owing to that the 1D morphology could be employed as nanoscale building blocks to make the electrical measurement with two terminals easier.10,34 Up to now, several strategies have been explored for the fabrication of La(OH)3 nanowires, including sol–gel,35 hydrothermal,36 solvothermal,37 template-assisted routes,38 microwave-assisted routes39 and composite-hydroxide-mediated method.40 However, the synthesis routes are in need of either the preparation of La-based precursors or templates was needed. Recently, Li and his co-workers developed a facile liquid–solid-solution (LSS) phase transfer synthetic strategy, using which a variety of nearly monodisperse and hydrophobic nanocrystals, including noble metals, semiconductors, ferrites, rare earth fluorides and so on, have been synthesized.41,42 We also contributed an improvement to this strategy for the fabrication CoFe2O4 and NiFe2O4 nanocrystals.43,44 In comparison with the other chemical methods, the LSS phase transfer synthetic strategy shows several advantages, including great chemical flexibility, synthetic tenability, inherent simplicity, cleanliness, low cost and the capability of large-scale production. However, to our best knowledge, no paper has been reported on the synthesis of hydrophobic rare earth oxide nanostructures, especially using this LSS-assisted phase transfer strategy.

In this paper, we report the fabrication of hydrophobic single-crystalline La(OH)3 nanowires with tunable size by a LSS-assisted hydrothermal route for the first time. The influences of reaction time and solvent selections on the formation of the La(OH)3 nanowires are investigated. We also devote a nanoscale characterization of individual La(OH)3 nanowires. The magnetic properties of the La(OH)3 nanowires were also investigated. It is believed that this work is significant for the fundamental research and applications of rare earth compounds.

2. Experimental section

2.1 Materials

All chemical reagents used in this work were directly used as received and without any further purification. Lanthanum chloride heptahydride (LaCl3·7H2O, AR 99.5%) was purchased from the Recovery Fine Chemical Industry Research Institute (Tianjin, China). Sodium oleate (C18H33NaO2, CP) was purchased from Guoyao Chemical Company (Shanghai, China). Sodium hydroxide (NaOH, 98%) and oleic acid (C18H34O2, 90%) were purchased from Alfa Aesar. Ethanol alcohol (C2H6O, analytical grade) was purchased from Rionlon BoHua Pharmaceutical and Chemical Limited Company (Tianjin, China). Deionized water used through the experiment was obtained by means of a water-purification system.

2.2 Synthesis of La(OH)3 nanowires

In a typical process, 2 mmol LaCl3·7H2O were dissolved in the solvent composed of 20 ml water and 10 ml ethanol alcohol. Then 6 mmol sodium oleate and 5 ml oleic acid were introduced and vigorously stirred at room temperature for 2 h to obtain a homogenous solution. After that, 36 mmol NaOH was added and strongly stirred for another 0.5 h. The prepared solution was transferred into an 80 mL-capacity stainless Teflon-lined autoclave, which was sealed and maintained at 180 °C for 20 h and then naturally cooled to room temperature. The products were collected by a centrifugation, washed with hexane several times, and dried at 60 °C for 24 h.

2.3 Characterizations

The morphology, chemistry and crystal structure of individual La(OH)3 nanowires were analysed at the nanoscale using a field-emission scanning electron microscopy (FESEM, S-4800, Hitachi), high-resolution transmission electron microscope (TEM, Tecnai™ G2 F30, FEI) equipped with energy-dispersive X-ray spectrum (EDAX, AMETEK), high angle annular dark field and scanning transmission electron microscopy (HAADF-STEM), an X-ray diffraction instrument (XRD, Philips X'pert Pro MPD, Cu Kα radiation, Netherlands), Fourier transform infrared (FTIR) spectrometer (170SX, Nicolet). La(OH)3 nanowires dispersed in hexane were dispersed on holey carbon film coated Cu grids for TEM measurements. Magnetic properties of the La(OH)3 nanowires were measured by an vibrating sample magnetometer (VSM, Microsence VSM ev9). The Ce impurity is measured by inductively coupled plasma emission spectrometer (ICP-ES) (IRIS Intrepid ER/S, Thermo Elemental) and Quantum Design MPMS magnetometer based on superconducting quantum interference device (SQUID) (MPMS-XL-7, Quantum Design). Electron spin resonance (ESR) spectrum was recorded in X-band (8.984 GHz) by a JES-FA300 spectrometer (JEOL).

3. Results and discussion

3.1 Crystal structure, morphology, chemical component and magnetic properties of the La(OH)3 nanowires

The phase crystal structure of the La(OH)3 nanowires was characterized by XRD technique, as shown in Fig. 1. The positions and relative intensities of all the peaks could be indexed to a pure hexagonal structure (space group: P63/m (176)) of La(OH)3 with lattice constants of a = b = 6.529 Å and c = 3.859 Å, which is in accordance with the standard JCPDS card no. 36-1481. No additional diffraction peaks of other impurity phases are observed. In addition, it is clearly seen that the diffraction peaks of the La(OH)3 nanowires obtained in this work show broadening effect, which is due to the small crystalline structures.
image file: c4ra14135k-f1.tif
Fig. 1 XRD pattern of the La(OH)3 nanowires.

The morphologies of La(OH)3 nanowires prepared in this work were characterized by SEM and TEM. Fig. 2(a) shows a representative SEM image of bundles of La(OH)3 nanowires. Continuous structure and virtually uniform diameter can be seen in each nanowires. The nanowires are randomly distributed and closely interwoven, forming net structures. Fig. 2(b) shows a bright field (BF) TEM image of tens of dispersed La(OH)3 nanowires, which provides a further insight into their morphology. It is clearly seen that individual nanowires have smooth surface and uniform diameter. The average diameter is about 15 nm and the length is approximately 300 nm.


image file: c4ra14135k-f2.tif
Fig. 2 Electron microscopy analysis of the La(OH)3 nanowires: (a) SEM image, (b) BF-TEM image, (c) HAADF-STEM image, (d) SAED pattern of the area A marked by red false-circle in (b), (e) lattice-resolution HRTEM image of the area B marked by blue square in (b), (f) CBED pattern of the point C marked by green circle in (b), (g) crystal structure model of La(OH)3 and (h) structure model of the La(OH)3 viewed along c-axis direction.

To further investigate the spatial shape of the nanomaterials, HAADF-STEM technology was adopted to analyze the La(OH)3 nanowires due to its better depth of field and spatial resolution in comparison with the SEM and TEM. Fig. 2(c) shows a representative low-magnified HAADF-STEM image of the La(OH)3 nanowires. It is clear seen that the La(OH)3 nanostructures show wire-like shape with nearly monodispersed diameter, which is accordant with the SEM and TEM results. The HAADF-STEM image is also called Z-contrast image, which strongly depends on the atomic number (Z) and thickness (d) of the samples. The La(OH)3 nanowires show smooth surface and no defects are observed, revealing that the sample have a good qualify. In addition, uniform contrast can be seen for each nanowire indicating that the La(OH)3 nanowires have a pure chemical phase.

Fig. 2(d) shows a representative selected area electron diffraction (SAED) pattern of a bundle of La(OH)3 nanowires marked by red circle in Fig. 2(b). Several distinguishable and bright diffraction rings can be seen, indicating the high crystalline feature of the La(OH)3 nanowires. The diffraction rings can be indexed to the (200), (102), and (310) lattice planes, suggesting the formation of hexagonal phase of La(OH)3, which is in accordance with the XRD data. Detailed analysis of HRTEM image was further used to determine the crystalline structure of La(OH)3 nanowires. Fig. 2(e) shows the lattice-resolution HRTEM image of the local area B marked by blue box on the single nanowire in Fig. 2(b). The clear lattice fringes suggest the high crystalline nature of the La(OH)3 nanowires. The measured interplanar distance is about 0.3188 nm, which can be assigned to the (101) plane of hexagonal La(OH)3. Fig. 2(f) displays the converged beam electron diffraction (CBED) pattern of the area B marked by green circle on the single nanowire in Fig. 2(b). The result shows a single crystalline hexagonal structure with 〈0001〉 orientation. Fig. 2(g) shows the structure model of the hexagonal La(OH)3, indicating a highly anisotropic structure. The view of this model along c-axis direction is shown in Fig. 2(h). It is believed that the anisotropic growth of La(OH)3 nanowires is governed by the inherent crystal structure and their chemical potential in the solution.9 More HRTEM and CBED results prove that individual La(OH)3 nanowires have a single crystalline nanostructure.

The chemical element distributions of La(OH)3 nanowires were further studied by HAADF-STEM and EDX elemental mapping analysis techniques. The typical HAADF-STEM image of a single La(OH)3 nanowire is shown in Fig. 3(a). Smooth surface and no defects are observed. Fig. 3(b) displays the EDX spectrum of the La(OH)3 nanowires. The spectrum demonstrates the existence of lanthanum (La) and oxygen (O) in the samples, while hydrogen (H) cannot be detected by EDX. This result is in coincident with the XRD data. The carbon (C) and copper (Cu) peaks in the EDX spectrum is due to the carbon-coated copper grids, which has been demonstrated by the EDX spectrum of an empty carbon-coated copper grid. Fig. 3(c) and (d) show the corresponding EDX mappings of La (Ka, 4.65 keV) and O (Ka, 0.52 keV), respectively. It is clear that the elements La and O are evenly distributed throughout the whole nanowire, revealing a uniform chemical phase. This result is in good agreement with the above TEM observations.


image file: c4ra14135k-f3.tif
Fig. 3 Element mappings of a single La(OH)3 nanowires: (a) HAADF-STEM image; (b) EDX spectrum; (c) lanthanum mapping; (d) oxygen mapping.

FTIR spectroscopy was employed to analyze the chemical bonding on the surface of the La(OH)3 nanowires, as shown in Fig. 4. The sharp peaks at 2925 and 2855 cm−1 are assigned to the asymmetric and symmetric stretching modes of the long CH2 chains, respectively. The peaks at 1562 and 1447 cm−1 are attributed to the asymmetric and symmetric COO, respectively. The sharp peak at 3612 cm−1 is associated with the vibration of O–H bonds in the hydroxide. The peak at 646 cm−1 is attributed to the stretching vibration of La–O bonds. This result suggests the formation of La(OH)3, which is accordant with the XRD and EDX results. In addition, the FTIR spectrum confirms that the surface of the La(OH)3 nanowires prepared in this work is decorated by oleic acid, which can afford steric repulsive force to balance the gravity of the nanowires. Therefore, the La(OH)3 nanowires can be easily dispersed in the nonpolar solvents without agglomeration as shown in the inset of Fig. 4.


image file: c4ra14135k-f4.tif
Fig. 4 FTIR spectrum of the La(OH)3 nanowires.

Fig. 5 shows the magnetization versus magnetic field (MH) curve of the La(OH)3 nanowires measured by VSM at room temperature, in which the paramagnetic and anti-ferromagnetic signals of the samples have been subtracted. The VSM equipment is one of the most powerful tools to measure the net magnetization of samples, which has a resolution of 10−6 emu.45 It is clearly seen that the MH curve reveals an S-shape. The saturated magnetization value is about 0.047 emu g−1. A distinct hysteresis loop with coercivity (Hc) of 183 Oe and remanence magnetization (Mr) of 0.0065 emu g−1 can be obtained in the magnification of the central part of the curve as shown in the right-below inset. These results indicate that the La(OH)3 nanowires prepared in this work have room temperature ferromagnetic (RTFM) characteristic, while the corresponding bulk La(OH)3 is well known as an antiferromagnetic material.


image file: c4ra14135k-f5.tif
Fig. 5 Magnetic hysteresis loops of the La(OH)3 nanowires measured at room temperature.

In order to investigate the physical origin of RTFM characteristic of the La(OH)3 nanowires prepared in this work, the zero-field-cooled (ZFC) and field-cooled (FC) curves of the La(OH)3 nanowires are measured using the SQUID equipment in the temperature range from 10 to 300 K under an applied magnetic field of 100 Oe, as shown in Fig. 6. In is clearly seen that no blocking temperature (TB) is obtained, suggesting that there is no contamination of ferromagnetic clusters formed in the sample.46 This result indicates that the observed RTFM characteristic of the La(OH)3 nanowires should be originated from their intrinsic nature. Moreover, the FC curve is obviously deviated from the ZFC curve in the whole measured temperature range, indicating that the Curie temperature (TC) of the sample is above 300 K. This result suggests that the La(OH)3 nanowires have clear RTFM characteristic, which is accordant with the VSM data. The temperature dependence of magnetization (MT) curve of the La(OH)3 nanowires were analyzed under an external magnetic field of 1000 Oe from 10 to 300 K, as shown in Fig. 7. The magnetization of the La(OH)3 nanowires decreases rapidly from 10 to 50 K, and then slowly reduced with the increase of temperature. The MT curve doesn't occur the first derivative, and the magnetization is non-zero in the whole measured temperature range. These results indicate that TC of the sample is above 300 K, which is consistent with the ZFC–FC result.


image file: c4ra14135k-f6.tif
Fig. 6 ZFC–FC curve of the La(OH)3 nanowires measured at 10–300 K with an applied magnetic field of 100 Oe.

image file: c4ra14135k-f7.tif
Fig. 7 MT curve of the La(OH)3 nanowires measured at 10–300 K with an applied magnetic field of 1000 Oe.

To further understand the specific d0 RTFM characteristic of the La(OH)3 nanowires, ESR technology was adopted to investigate the microscopic magnetic information of the samples. Fig. 8 shows the ESR spectrum of the La(OH)3 nanowires measured at room temperature. The ESR spectrum shows a broad resonance band with a resonance field (HR) at about 277 mT. This is quite different with the paramagnetic materials which have a HR value of 321 mT.23 According to the magnetic resonance theory, the effective g factor (geff) can be obtained by the following equations:23

geff = (m)/(μBHR)
where h is the Planck constant, νm is the frequency of the applied microwave field, μB is the Bohr magnetron and HR is the resonance magnetic field. The calculated geff value of the La(OH)3 nanowires is about 2.3204, which is far away from that of the free electron (geff = 2.0023). These ESR results further demonstrate that the La(OH)3 nanowires represent d0 RTFM characteristic, which is consistent with the VSM results.


image file: c4ra14135k-f8.tif
Fig. 8 ESR spectrum of the La(OH)3 nanowires measured at room temperature.

It is well known that the paramagnetic Ce ion impurity is frequently occurs in La-based compounds, which may also cause ferromagnetic behavior. To check the content of Ce impurity in the sample, inductively coupled plasma atomic emission spectroscopy (ICP-AES) was employed, displaying a 1.3[thin space (1/6-em)]:[thin space (1/6-em)]98.7 molar ratio of Ce and La. The Ce element is usually existed as ceria (CeO2) in the hydroxide or oxide. Therefore, the Ce impurity presented in the La(OH)3 nanowires should be performed as CeO2. The Ms value of CeO2 nanostructures is reported to be only several memu g−1,47–50 while the Ms value of the La(OH)3 nanowires prepared in this work is 0.047 emu g−1. It is clear that the influence of Ce impurity on the magnetization of La(OH)3 nanowires can be ignored.

All the results above suggest that the measured RTFM characteristic undoubtedly reveal the intrinsic nature of the La(OH)3 nanowires prepared in this work. Generally, the RTFM characteristic of rare earth-based nanostructures is probably due to the permanent magnetic moment per rare earth ion which has the existence of unpaired electrons.23,51 However, the La3+ performs a stable electron structure like xenon (Xe) without any unpaired electrons. Therefore, the specific d0 RTFM behavior of the La(OH)3 nanowires is possibly owing to the point defects originated from the size effect, which can restrict the compensating charges in molecular orbitals and form a local magnetic moment.52–54

3.2 Morphologies influenced by reaction time and solvent selections

In order to elucidate the growth mechanism of the La(OH)3 nanowires, the morphologies and crystal structures of the prepared La(OH)3 nanowires were studied by changing the experimental parameters, such as reaction temperature, reaction time, concentration of NaOH and selections of starting solvents. It is find that the reaction temperature and concentration of NaOH showed little impact on the morphologies of the La(OH)3 nanowires. The main factors impacted on the morphologies are reaction time and the selections of solvents, which have been discussed in detail as follows.

Fig. 9 shows the TEM images of the La(OH)3 nanowires synthesized at 180 °C with a molar ratio of H2O to ethanol of 2[thin space (1/6-em)]:[thin space (1/6-em)]1 for 5, 10, 20, and 40 h respectively. When the reaction time was reduced to 5 h, the products are mixture of tiny nanoparticles and nanorods as shown in Fig. 9(a). The nanoparticles are about 5 nm in size, and the nanorods are about 8 nm in diameter and 70 nm in length. When the reaction time was prolonged to 10 h, the length of nanowires increases to approximate 250 nm and the diameter is about 13 nm (Fig. 9(b)). When the reaction time lasted for 20 h, the average length is about 300 nm and the diameter is about 15 nm (Fig. 9(c)). However, their sizes are more uniform and surface more smooth. While the reaction time was extended to 40 h, the diameter of the La(OH)3 nanowires is up to 18 nm and length is about 7 nm, and individual nanowires are twisted together because of their long length (Fig. 9(d)). These results suggest that the reaction time shows significant influence on the length of the La(OH)3 nanowires but little impact on the diameter.


image file: c4ra14135k-f9.tif
Fig. 9 TEM images of the La(OH)3 nanowires synthesized at different reaction time: (a) 5, (b) 10, (c) 20 and (d) 40 h. Side: distribution statistical histograms of average diameters and lengths for La(OH)3 nanowires, respectively.

Fig. 10 shows the TEM images of the La(OH)3 nanowires synthesized at 180 °C for 20 h with different volume of H2O to ethanol. Using only H2O as the solvent, La(OH)3 nanowires with diameters of 4.5 nm and lengths of 40 nm were obtained (Fig. 10(a)). When the solvent become the mixture of 10 ml of H2O and 20 ml of ethanol, the average nanowire diameter is about 15 nm and lengths is about 300 nm (Fig. 10(b)). When the mixture solvent consists of 20 ml of H2O and 10 ml of ethanol, the diameters of nanowires became uneven, some are about 12 nm, but the others about 35 nm (Fig. 10(c)). While pure ethanol was only used as the solvent, the size of the La(OH)3 nanowires become uniform with about 180 nm diameter and 2.7 μm length (Fig. 10(d)). This result shows that the solvent selections strongly impact on not only the diameter but also the length of the La(OH)3 nanowires.


image file: c4ra14135k-f10.tif
Fig. 10 TEM images of the La(OH)3 nanowires synthesized under different volume of the solvent (H2O–ethanol, ml): (a) 30/0, (b) 20/10, (c) 10/20, (d) 0/30. Side: distribution statistical histograms of average diameters and lengths for La(OH)3 nanowires, respectively.

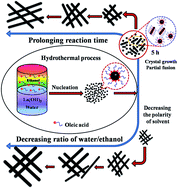
Based on the above experimental results, the formation mechanism of the La(OH)3 nanowires at different conditions are schematically illustrated in Fig. 11. By changing the reaction time, the formation of La(OH)3 nanowires experiences two dominant growth mechanisms, including Ostwald ripening and oriented attachment. When the reaction time is less than 5 h, the tiny La(OH)3 nanoparticles formed based on the Ostwald ripening mechanism.54 Besides, the La(OH)3 nanorods with low length–diameter ratio formed at 5 h was possibly due to the partial fusion of some tiny nanoparticles. By prolonging the reaction time, the length–diameter ratio of the nanowires was obviously enhanced, which was due to the aggregation of nanoparticles into nanowires based on the oriented attachment.54 However, when the polarity of the solvent decreases (decreasing the volume ratio of water–ethanol), more oleic acid might surround around the La(OH)3 precursor. During the hydrothermal process, Ostwald ripening and oriented attachment mechanisms happened at the same time, leading to the formation of nanowires with larger diameter and length.


image file: c4ra14135k-f11.tif
Fig. 11 The synthetic scheme of the formation mechanism for the La(OH)3 nanowires in different experimental conditions.

4. Conclusion

In summary, we reported a facile, efficient and rapid one-pot LSS-assisted hydrothermal method for the fabrication of 1D La(OH)3 nanowires with tunable size without any template. The average lengths and diameter of La(OH)3 nanowires can by tuned by facilely change the experimental parameters such as reaction time and solvents. Besides, the formation mechanisms of the nanowires are possibly Ostwald ripening and oriented attachment mechanisms. Detailed structural characterization revealed that individual La(OH)3 nanowires are single crystalline hexagonal structure with 〈0001〉 orientation. The surface of the La(OH)3 nanowires is capped by oleic acid, leading to a hydrophobic characteristic. Our study also shows that La(OH)3 nanowires show d0 room temperature ferromagnetism. This study highlights the basic morphological, chemical, structural information and magnetic properties for La(OH)3 nanowires, which is believed to be critical for the rare earth compounds in fields of fundamental research and potential applications in nanodevices and nanoelectronics.

Acknowledgements

We thank the support from the grants from the National Natural Science Foundation of China (no. 61177059), Introduction Talent Project of Northwest University (pr13100), the Natural Science Foundation of Shannxi Province, China (2014JQ1040), the Research Project of Educational Department of Shaanxi Provence, China (14JK1727) and the Scientific Research Foundation of Northwest University (13NW13).

References

  1. S. Iijima, Nature, 1991, 354, 56 CrossRef CAS.
  2. S. Mann, Nat. Mater., 2009, 8, 781 CrossRef CAS PubMed.
  3. Y. N. Xia, P. D. Yang, Y. G. Sun, Y. Y. Wu, B. Mayers, B. Gates, Y. D. Yin, F. Kim and H. Q. Yan, Adv. Mater., 2003, 15, 353 CrossRef CAS.
  4. P. M. Rørvik, T. Grande and M. A. Einarsrud, Adv. Mater., 2011, 23, 4007 CrossRef PubMed.
  5. C. C. Lee, C. Grenier, E. W. Meijer and A. P. H. J. Schenning, Chem. Soc. Rev., 2009, 38, 671 RSC.
  6. Z. G. Yin and Q. D. Zheng, Adv. Energy Mater., 2012, 2, 179 CrossRef CAS.
  7. M. Hasegawa and M. Iyoda, Chem. Soc. Rev., 2010, 39, 2420 RSC.
  8. A. N. Aleshin, Adv. Mater., 2006, 18, 17 CrossRef CAS.
  9. M. I. B. Utama, J. Zhang, R. Chen, X. L. Xu, D. H. Li, H. D. Sun and Q. H. Xiong, Nanoscale, 2012, 4, 1422 RSC.
  10. R. S. Devan, R. A. Patil, J. H. Lin and Y. R. Ma, Adv. Funct. Mater., 2012, 22, 3326 CrossRef CAS.
  11. D. R. Bowler, J. Phys.: Condens. Matter, 2004, 16, R721 CrossRef CAS.
  12. F. Zaldívar, J. L. D. Río-Correa, E. García-Martínez and M. Fernández-Guasti, Am. J. Phys., 2011, 79, 1060 CrossRef.
  13. B. Su, Y. C. Wu and L. Jiang, Chem. Soc. Rev., 2012, 41, 7832 RSC.
  14. C. W. Cheng and H. J. Fan, Nano Today, 2012, 7, 327 CrossRef CAS PubMed.
  15. T. R. Kline, M. Tian, J. Wang, A. Sen, M. W. H. Chan and T. E. Mallouk, Inorg. Chem., 2006, 45, 7555 CrossRef CAS PubMed.
  16. L. Li, T. Zhai, H. Zeng, X. Fang, Y. Bando and D. Golberg, J. Mater. Chem., 2011, 21, 40 RSC.
  17. E. Comini, C. Baratto, G. Faglia, M. Ferroni, A. Vomiero and G. Sberveglieri, Prog. Mater. Sci., 2009, 54, 1 CrossRef CAS PubMed.
  18. C. Bae, H. Yoo, S. Kim, K. Lee, J. Kim, M. M. Sung and H. Shin, Chem. Mater., 2008, 20, 756 CrossRef CAS.
  19. N. Wang, Y. Cai and R. Q. Zhang, Mater. Sci. Eng., R, 2008, 60, 1 CrossRef PubMed.
  20. X. Wang and Y. D. Li, Inorg. Chem., 2006, 45, 7522 CrossRef CAS PubMed.
  21. T. Xia, J. Wang, N. Lin, H. Zhao, L. Huo and G. Mountrichas, RSC Adv., 2011, 1, 440 RSC.
  22. G. F. Wang, Q. Peng and Y. D. Li, Acc. Chem. Res., 2011, 44, 322 CrossRef CAS PubMed.
  23. X. H. Li, X. Deng, H. Zhu, J. Feng, Y. Peng, J. T. Bai, X. L. Zheng, H. B. Fan, M. Z. Wang and H. W. Chen, Chem.–Asian J., 2014, 9, 584 CrossRef CAS.
  24. C. W. Sun, H. Li and L. Q. Chen, Energy Environ. Sci., 2012, 5, 8475 CAS.
  25. A. Jha, B. Richards, G. Jose, T. T. Fernandez, P. Joshi, X. Jiang and J. Lousteau, Prog. Mater. Sci., 2012, 57, 1426 CrossRef CAS PubMed.
  26. A. Gnach and A. Bednarkiewicz, Nano Today, 2012, 7, 532 CrossRef CAS PubMed.
  27. M. Z. Wang, X. Deng, J. Feng, B. Z. Yu, H. Zhu, X. H. Li, X. L. Zheng, J. T. Bai and Y. Peng, J. Alloys Compd., 2015, 619, 681 CrossRef CAS PubMed.
  28. X. Ma, H. Zhang, Y. Ji, J. Xu and D. Yang, Mater. Lett., 2004, 58, 1180 CrossRef CAS PubMed.
  29. A. Neumann and D. Walter, Thermochim. Acta, 2006, 445, 200 CrossRef CAS PubMed.
  30. S. J. Jo, J. S. Ha, N. K. Park, D. K. Kang and B. H. Kim, Thin Solid Films, 2006, 513, 253 CrossRef CAS PubMed.
  31. G. A. H. Mekhemer and B. A. A. Balboul, Colloids Surf., A, 2001, 181, 19 CrossRef CAS.
  32. B. Hou, Y. Xu, D. Wu and Y. Sun, J. Mater. Sci., 2007, 42, 1397 CrossRef CAS PubMed.
  33. J. H. Jun and D. J. Choi, Thin Solid Films, 2006, 504, 205 CrossRef CAS PubMed.
  34. G. Wang, Z. D. Wang, Y. X. Zhang, G. T. Fei and L. D. Zhang, Nanotechnology, 2004, 15, 1307 CrossRef CAS.
  35. I. Djerdj, G. Garnweitner, D. S. Su and M. Niederberger, J. Solid State Chem., 2007, 180, 2154 CrossRef CAS PubMed.
  36. X. Wang and Y. Li, Chem.–Eur. J., 2003, 9, 5627 CrossRef CAS PubMed.
  37. B. Tang, J. Ge, C. Wu, L. Zhuo, J. Niu, Z. Chen, Z. Shi and Y. Dong, Nanotechnology, 2004, 15, 1273 CrossRef CAS.
  38. F. Bouyer, N. Sanson, M. Destarac and C. Gérardin, New J. Chem., 2006, 30, 399 RSC.
  39. H. L. Zhu, D. R. Yang, H. Yang, L. M. Zhu, D. S. Li, D. L. Jin and K. H. Yao, J. Nanopart. Res., 2008, 10, 307 CrossRef CAS.
  40. C. Hu, H. Liu, W. Dong, Y. Zhang, G. Bao, C. Lao and Z. Wang, Adv. Mater., 2007, 19, 470 CrossRef CAS.
  41. X. Wang, J. Zhuang, Q. Peng and Y. D. Li, Nature, 2005, 437, 121 CrossRef CAS PubMed.
  42. X. Liang, X. Wang, J. Zhuang, Y. T. Chen, D. S. Wang and Y. D. Li, Adv. Funct. Mater., 2006, 16, 1805 CrossRef CAS.
  43. X. H. Li, C. L. Xu, X. H. Han, L. Qiao, T. Wang and F. S. Li, Nanoscale Res. Lett., 2010, 5, 1039 CrossRef CAS PubMed.
  44. X. H. Li, G. G. Tan, W. Chen, B. F. Zhou, D. S. Xue, Y. Peng, F. S. Li and N. J. Mellors, J. Nanopart. Res., 2012, 14, 751 CrossRef.
  45. S. Foner, Rev. Sci. Instrum., 1959, 30, 548–557 CrossRef PubMed.
  46. J. Zhang, D. Q. Gao, G. J. Yang, J. L. Zhang, Z. H. Shi, Z. H. Zhang, Z. H. Zhu and D. S. Xue, Nanoscale Res. Lett., 2011, 6, 587 CrossRef PubMed.
  47. A. Sundaresan, R. Bhargavi, N. Rangarajan, U. Siddesh and C. N. R. Rao, Phys. Rev. B: Condens. Matter Mater. Phys., 2006, 74, 161306 CrossRef.
  48. M. Y. Ge, H. Wang, E. Z. Liu, J. F. Liu, J. Z. Jiang, Y. K. Li, Z. A. Xu and H. Y. Li, Appl. Phys. Lett., 2008, 93, 062505 CrossRef PubMed.
  49. M. J. Li, S. H. Ge, W. Qiao, L. Zhang, Y. L. Zuo and S. M. Yan, Appl. Phys. Lett., 2009, 94, 152511 CrossRef PubMed.
  50. M. S. Seehra, S. Suri and V. Singh, J. Appl. Phys., 2012, 111, 07B516 CrossRef PubMed.
  51. C. X. Li, P. A. Ma, P. P. Yang, Z. H. Xu, G. G. Li, D. M. Yang, C. Peng and J. Lin, CrystEngComm, 2011, 13, 1003 RSC.
  52. J. M. D. Coey, Solid State Sci., 2005, 7, 660 CrossRef CAS PubMed.
  53. Z. L. Yang, D. Q. Gao, Z. H. Zhu, J. Zhang, Z. H. Shi, Z. P. Zhang and D. S. Xue, Nanoscale Res. Lett., 2013, 8, 17 CrossRef PubMed.
  54. T. D. Nguyen, D. Mrabet and T. O. Do, J. Phys. Chem. C, 2008, 112, 15226 CAS.

This journal is © The Royal Society of Chemistry 2015
Click here to see how this site uses Cookies. View our privacy policy here.