Ionic liquids and γ-butyrolactone mixtures as electrolytes for supercapacitors operating over extended temperature ranges†
Laure Dagoussetab,
Giao T. M. Nguyenb,
Frédéric Vidalb,
Christophe Galindo*a and
Pierre-Henri Aubertb
aThales Research & Technology, 1 avenue Augustin Fresnel, 91767, Palaiseau, France. E-mail: christophe.galindo@fr.thalesgroup.com
bLaboratoire de Physicochimie des Polymères et des Interfaces (EA 2528), Université de Cergy-Pontoise, 5 mail Gay-Lussac, 95031 Cergy-Pontoise Cedex, France
First published on 15th January 2015
Abstract
Physicochemical and electrochemical properties of three different ionic liquids (1-propyl-1 methylpyrrolidinium bis(fluorosulfonyl)imide – Pyr13FSI, 1-butyl-1-methylpyrrolidinium bis(trifluoro methanesulfonyl)imide – Pyr14TFSI and 1-ethyl-3-methylimidazolium bis(trifluoromethane sulfonyl)imide – EMITFSI) were investigated and compared with binary mixtures of those ionic liquids with γ-butyrolactone (GBL). It was found that the highest conductivity for each mixture was obtained for a concentration close to 50 wt%. Then thermal and transport properties for the three neat ionic liquids and the three mixtures with GBL at 50 wt% were evaluated from −50 °C to 100 °C. The addition of GBL enhances the conductivity and fluidity of the mixtures, especially at low temperature. For instance, at −50 °C the ionic conductivity for EMITFSI/GBL is still as high as 1.9 mS cm−1 and its viscosity is 70 mPa s. Another advantage of the solvent addition is that it suppresses the melting transition and allows applications down to −50 °C. A drawback is the slight reduction of the electrochemical stability window of the electrolyte.
Introduction
During recent years, the interest in ionic liquids (ILs) as an electrolyte has been growing, concerning multiple applications like electrical double layer capacitors (EDLCs),1,2 lithium ion batteries, electrochemical actuators,3,4 dye sensitized solar cells5 or electrochromic devices.6 The attraction of ILs is due to their numerous advantages such as a high thermal and chemical stability in addition to a low volatility which improves the safety of electrochemical devices, a good conductivity, and a wide electrochemical potential window which increases the device efficiency. ILs are usually quaternary ammonium salts with a cyclic or acyclic organic cation, and either an organic or inorganic anion. The cation can be chemically modified by varying the length and composition of the alkyl chains connected to the nitrogen atom. This results in a wide combination of cations and anions available that lead to ionic liquids with tunable physicochemical properties.7 The main drawback of neat ionic liquids that prevents them from expanding their use to supercapacitor applications is the presence of a melting point within the operating temperature range especially at temperatures below 10 °C. In addition, they present a high viscosity in comparison with classical organic electrolytes, especially at low temperature. Therefore researchers have focused their work on improving the ionic conductivity of the electrolyte properties by several approaches.Mixing two ionic liquids by choosing the combination of cations and anions can dramatically reduce or even suppress the melting transition.8 Besides, those binary systems exhibit a continuous decrease of the ionic conductivity with the temperature while neat ionic liquids show a sharp drop of the ionic conductivity near the melting transition. A good combination of ionic liquids allows working at low temperature without the use of an organic solvent. Indeed, Lin et al.9 showed that a binary mixture of 1-methyl-1-propylpiperidinium bis(fluorosulfonyl)imide and 1-butyl-1-methylpyrrolidinium bis(trifluoromethanesulfonyl)imide, (PIP13FSI)0.5(Pyr14TFSI)0.5 used as an electrolyte for EDLCs was able to operate from −50 °C to 100 °C over a wide electrochemical window (up to 3.7 V). However the ionic conductivity of such mixtures is too low (4.9 mS cm−1 at 20 °C, ∼10−2 mS cm−1 at −50 °C) to be used as efficient electrolytes.9 The ionic conductivity can be significantly enhanced by adding an organic solvent to ILs. Ruiz et al.2 studied the ionic conductivity of 1-butyl-1-methylpyrrolidinium bis(trifluoromethanesulfonyl)imide (Pyr14TFSI) associated with solvents. The highest value (45 mS cm−1) was reported with acetonitrile (ACN) as solvent for the 57 wt% ACN/Pyr14TFSI mixture. Nishida et al.10 studied the ionic conductivity of binary mixtures of 1-ethyl-3-methylimidazolium tetrafluoroborate (EMIBF4) with acetonitrile, propylene carbonate (PC) and γ-butyrolactone (GBL). The ionic conductivity of the EMIBF4 mixtures with ACN, GBL and PC was 4.8, 1.8 and 1.3 times higher respectively, than that of the neat IL. ACN is considered as the best candidate regarding the ionic conductivity but it is nevertheless necessary to choose a solvent that would allow operating in safe conditions between −50 °C and 100 °C. The low boiling point (82 °C) of acetonitrile limits the maximum operation temperature to about 70 °C. Moreover ACN is forbidden in countries like Japan for safety reasons because of its toxicity and its low flash point (2 °C). As reported by Ue et al.,11 PC and GBL have a similar viscosity (2.5 mPa s and 1.7 mPa s at 25 °C, respectively) and thermal properties (boiling points of 242 °C and 204 °C, respectively). The ionic conductivities (10.6 and 14.3 mS cm−1, respectively) and electrochemical windows values were evaluated on 0.65 M tetraethylammonium tetrafluoroborate (TEABF4) solutions with those different solvents. Despite those similarities, GBL has a wider electrochemical window (Eox = +5.2 V and Ered = −3 V vs. SCE),11 and hence was chosen for this work. Furthermore, it has been reported that the addition of an organic solvent upon ILs suppresses ILs' phase transitions at low temperature. In that perspective, Chagnes et al.12 and Anouti et al.13 studied GBL/IL mixtures, and more particularly the thermal analysis of an aprotic ionic liquid (1-butyl-3-methyl-imidazolium) and a protic ionic liquid (pyrrolidinium nitrate) respectively. As far as we know, no study has been reported on both electrochemical and thermal analysis of GBL/aprotic IL mixtures, especially on electrochemical windows of the mixtures. The purpose of this work is to combine ionic liquids presenting a high ionic conductivity and a wide electrochemical window with GBL and to study the thermal, physico-chemical and electrochemical properties based on such mixtures. The ionic conductivity of neat IL is related to their chemical structure and can reach values as high as 15.4 mS cm−1 (for EMIFSI at 25 °C) when small or asymmetrical cations such as 1-ethyl-3-methylimidazolium (EMI+) 1-propyl-1-methylpyrrolidinium (Pyr13+), 1-butyl-1-methylpyrrolidinium (Pyr14+) are combined with charge-delocalized anions as bis(trifluoromethanesulfonyl)imide (TFSI−) and bis(fluorosulfonyl)imide (FSI−).
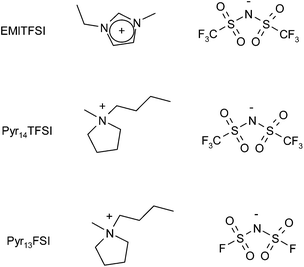
In this study we focus on 1-ethyl-3-methylimidazolium bis(trifluoromethanesulfonyl)imide (EMITFSI), 1-propyl-1-methylpyrrolidinium bis(fluorosulfonyl)imide (Pyr13FSI), and 1-butyl-1-methylpyrrolidinium bis(trifluoromethane sulfonyl)imide (Pyr14TFSI) shown in Scheme 1. Pyr13FSI and Pyr14TFSI have been selected as a compromise between ionic conductivity (5.4 mS cm−1 and 2.2 mS cm−1 at 20 °C respectively),14 viscosity (48 and 138 mPa s at 20 °C respectively)15 and electrochemical window (5.9 V and 6.0 V respectively at 20 °C)16 and compared to the well-known EMITFSI as reference (at 20 °C, σ = 8.8 mS cm−1, η = 34 mPa s and EW = 4.3 V).17
Experimental section
Materials
EMITFSI, Pyr13FSI and Pyr14TFSI were commercially available from Solvionic (electrochemical grade 99.9%, H2O% <30 ppm) and used as received. γ-Butyrolactone (GBL, analytical grade >99.5%, H2O% <200 ppm) was purchased from Merck. Water content of ILs and GBL was checked by the Karl Fisher method (Metrohm, 831 KF coulometric titrator). Ferrocene 98% was purchased from Aldrich Company. Platinum and silver wires (99.99%, 0.25 mm diam.) were purchased from Goodfellow. Glassy carbon electrode (Model MF-2012, diameter of 3 mm) was purchased from BASi.Measurements
The ionic conductivity (σ, mS cm−1) of IL/GBL mixtures varying from 0 to 100 wt% in ionic liquid was evaluated at room temperature with a Mettler Toledo conductivity meter FE30 placed inside a glove box under nitrogen. The ionic conductivity as a function of temperature was recorded every 10 °C from −50 °C to 100 °C, by Electrochemical Impedance Spectroscopy (EIS) using a potentiostat VMP3 multi-channel (Bio-Logic Instruments). The measurement was realized in a three-electrode cell, using an Ag wire as a pseudo-reference electrode, a Pt wire as a counter electrode and a glassy carbon working electrode. Experiments were carried out in a frequency range from 1 Hz to 1 MHz with a rate of 6 points per decade with an amplitude of 10 mV. Electrochemical setup was assembled in a glove box and transferred into a thermostatic chamber. The ionic conductivity was calculated using the equation σ = k/Z, where Z is the real part of the complex impedance (ohms) and k is the cell constant, considered to be unchanged over the temperature range.Electrochemical windows (EW) measurements were carried out in the same three-electrode setup. The surface of the glassy carbon working electrode was polished with diamond paste (6 μm particle size) and rinsed with distilled water. The cyclic voltammograms (CV) were recorded at 20 mV s−1 with current density boundaries set to ±0.28 mA cm−2. For each ionic liquid, cathodic and anodic polarizations were carried out separately in order to avoid undesirable side-products or adsorbed impurities which may hamper accurate determination of EW. All potentials were reported relative to the ferrocene/ferricenium couple according to IUPAC.18 The rheological behaviour and the viscosity (η, mPa s) of the neat ILs and mixtures were measured with an Anton Paar Rheometer MCR 301 using a conical geometry. All of the samples showed a Newtonian behavior and a 50 s−1 shear rate was selected. The viscosity was measured from 25 °C to −50 °C and then from −50 °C to 100 °C at 3 °C min−1. The density of neat ILs and their mixtures was determined using an Anton Paar digital vibrating tube densitometer (model 60/602, Anton Paar, France) from 10 °C to 80 °C.
Results and discussion
Physicochemical, thermal and electrochemical properties of neat EMITFSI, Pyr13FSI, Pyr14TFSI and their binary mixtures with GBL are reported from −50 °C to 100 °C.Ionic conductivity
For common salts, the ionic conductivity is measurable only in a restricted range, determined by the solubility of the salt. The particularity of ILs is that they already are in a liquid state, which allows them to form a single phase with solvents over a wider concentration range as long as they are miscible. The phase separation (i.e. cloud point) of a mixture of two liquids was determined by visual observation.19 For all IL/GBL mixtures studied, both liquids are miscible as no phase separation has been observed visually after 24 h at room temperature, allowing the determination of the ionic conductivity whatever the concentration of ILs. Fig. 1 shows the variation of the room temperature ionic conductivity of EMITFSI/GBL, Pyr13FSI/GBL and Pyr14TFSI/GBL as a function of GBL's weight concentration.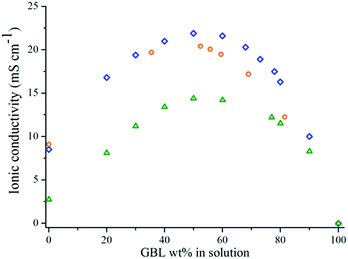 | ||
Fig. 1 Ionic conductivity of IL/GBL mixtures versus GBL weight concentration for Pyr13FSI ( ), EMITFSI ( ), EMITFSI ( ) and Pyr14TFSI ( ) and Pyr14TFSI ( ) at room temperature. ) at room temperature. | ||
As described by Ruiz et al.2 or Nishida et al.10 for aprotic ILs, when decreasing the IL concentration, the ionic conductivity first increases because of the ion solvation and the reduction of the viscosity. The ionic conductivity reaches a maximum at an ionic liquid concentration (Cσ,max) and then diminishes because of a dilution effect. For all mixtures Cσ,max is close to 50 wt% which corresponds to a molar concentration of 2 mol L−1 and an ionic conductivity of 21.9 mS cm−1 for Pyr13FSI, 1.7 mol L−1 and 20.5 mS cm−1 for EMITFSI, 1.5 mol L−1 and 14.4 mS cm−1 for Pyr14TFSI. A concentration of 50 wt% has been selected for the forthcoming results. The ionic conductivity is then measured in [−50 °C; +100 °C] for neat ionic liquids and 50 wt% IL/GBL mixtures (Fig. 2). The ionic conductivity increases with temperature for both neat ILs and IL/GBL mixtures up to roughly 40 mS cm−1 at 100 °C.
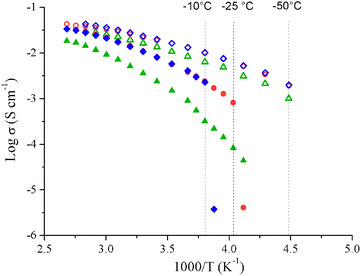 | ||
Fig. 2 Arrhenius plots of Pyr14TFSI ( ), EMITFSI ( ), EMITFSI ( ), Pyr13FSI ( ), Pyr13FSI ( ), Pyr14TFSI/GBL ( ), Pyr14TFSI/GBL ( ), EMITFSI/GBL ( ), EMITFSI/GBL ( ) and Pyr13FSI/GBL ( ) and Pyr13FSI/GBL ( ). ). | ||
Individually, EMITFSI, Pyr13FSI and Pyr14TFSI show melting points of −15.6 °C, −9.8 °C and −17.6 °C, respectively (see ESI, Fig. S1†), which explains the important decrease of ionic conductivities at low temperature. However Pyr14TFSI's ionic conductivity decreases continuously while EMITFSI and Pyr13FSI ionic conductivities drop sharply near their solidification points. This difference of behaviors is probably related to Pyr14TFSI's supercooling effect.20 Indeed, ionic conductivity values were measured during the cooling, and as we can see on the Pyr14TFSI DSC traces, no phase transition occurs during the decrease in temperature (see ESI, Fig. S1†). As a result, the Pyr14TFSI ions mobility decreases slowly until the IL reaches a glassy state. DSC curves of 50 wt% IL/GBL mixtures display no peak or baseline shift between −90 °C and 150 °C excluding the presence of first- or second-order phase transitions in this temperature range. 50 wt% IL/GBL mixtures remain in a liquid state for several tens of degrees lower than for neat ILs. This behavior explains that ionic conductivities at −50 °C of IL/GBL mixtures remain as high as 2.0, 1.0 and 1.9 mS cm−1 for Pyr13FSI/GBL, Pyr14TFSI/GBL and EMITFSI/GBL. The evolution in temperature of the ionic conductivity for all ILs and their IL/GBL mixtures (Fig. 3) is well fitted with the Vogel–Tamman–Fulcher equation (eqn (1)), commonly used for IL:
σ = σ0![[thin space (1/6-em)]](https://www.rsc.org/images/entities/char_2009.gif) exp(−Bσ/(T − T0)) exp(−Bσ/(T − T0))
| (1) |
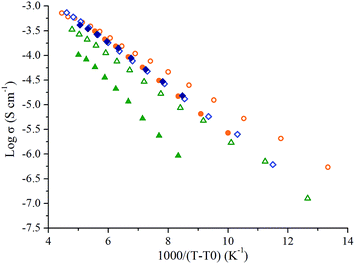 | ||
Fig. 3 VTF plots of Pyr14TFSI ( ), EMITFSI ( ), EMITFSI ( ), Pyr13FSI ( ), Pyr13FSI ( ), Pyr14TFSI/GBL ( ), Pyr14TFSI/GBL ( ), EMITFSI/GBL ( ), EMITFSI/GBL ( ) and Pyr13FSI/GBL ( ) and Pyr13FSI/GBL ( ). ). | ||
Viscosity
Fig. 4 presents the viscosity of neat ILs and IL/GBL mixtures as a function of temperature. As expected, the increase of temperature decreases the viscosity of neat ILs and IL/GBL mixtures. As noticed for ionic conductivity measurements, Pyr14TFSI behaves differently from EMITFSI and Pyr13FSI. Indeed, the viscosity of EMITFSI and Pyr13FSI can't be measured below their solidification point while Pyr14TFSI's viscosity increases continuously. The addition of GBL suppresses phase transitions at low temperature (ESI, Fig. S1†). Therefore mixtures remain liquid down to −50 °C and the viscosity is still measurable contrary to neat ILs. The addition of GBL decreases dramatically the viscosity down to 70 mPa s at −50 °C for 50 wt% EMITFSI/GBL mixture.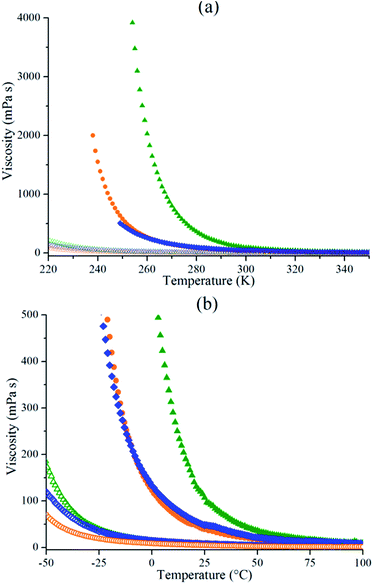 | ||
Fig. 4 Viscosity as a function of temperature for Pyr14TFSI ( ), EMITFSI ( ), EMITFSI ( ), Pyr13FSI ( ), Pyr13FSI ( ), Pyr14TFSI/GBL ( ), Pyr14TFSI/GBL ( ), EMITFSI/GBL ( ), EMITFSI/GBL ( ) and Pyr13FSI/GLB ( ) and Pyr13FSI/GLB ( ) from 0 to 4000 cP plot (a) and from 0 to 500 cP plot (b). ) from 0 to 4000 cP plot (a) and from 0 to 500 cP plot (b). | ||
As for the ionic conductivity, viscosity data as a function of temperature have been correlated to the VTF equation and are available in ESI (Fig. S2, Tables S3 and S4†).
Walden plot approach
Walden established an empirical relation21 between the ionic conductivity and viscosity for infinitely diluted solutions, known as the Walden rule (eqn (2)):| Λη = C | (2) |
The Walden plot representing log(Λ) versus log(η−1) is a method that provides a qualitative representation of ionicity. The ideal line is drawn as a reference using the data for a 0.01 M KCl aqueous solution, which is known to present a full dissociation of its ions. Angell et al.22 have classified ILs depending on where they stand regarding the ideal line. On the upper part, above the ideal line, “superionic liquids” exhibit a very high conductivity. This region of the plot usually contains protic ionic liquids that follow the Grotthuss mechanism, that is to say proton hopping between vicinal cations, enhancing the ionic conductivity. “Good” or “true” ionic liquids stand along the ideal line, and “poor ionic liquids” or “associated ionic liquids” lie below it: their conductivity is lower than expected regarding the fluidity (η−1) of the system. That is generally due to the formation of ion pairs and aggregates that do not contribute to the overall conductivity. Finally, “non-ionic” liquids are solely composed of ion pairs so their conductivity which depends on the number of free charge is far lower than the fluidity of the system, and they occupy the bottom of the Walden plot. Fig. 5 shows a Walden plot of the three neat ionic liquids and IL/GBL mixtures with temperatures varying from 10 °C to 80 °C. It appears that the three neat ionic liquids follow the ideal line so they can be qualified as good ILs. Their respective mixtures with GBL show a similar behaviour and stand slightly below the ideal line, still very close to good ILs. We observe a deviation of the Walden plot for neat ILs and IL/GBL mixtures from the ideal line with temperature. The deviation from the ideal line (slope α < 1) is commonly observed for most of ionic liquids and is correlated to the partial Walden rule (eqn (3)).23,24 In the partial Walden rule, α is most often found in the range of 0.8 ± 0.1 for neat ionic liquids:25
| Ληα = C | (3) |
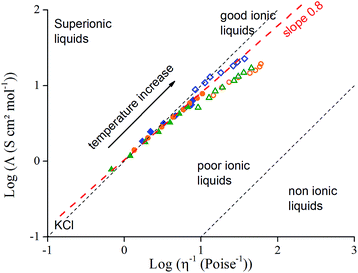 | ||
Fig. 5 Walden plot of log(molar conductivity, Λ) against log(reciprocal viscosity, η−1), for: Pyr14TFSI ( ), EMITFSI ( ), EMITFSI ( ), Pyr13FSI ( ), Pyr13FSI ( ), Pyr14TFSI/GBL ( ), Pyr14TFSI/GBL ( ), EMITFSI/GBL ( ), EMITFSI/GBL ( ) and Pyr13FSI/GBL ( ) and Pyr13FSI/GBL ( ). The plot includes the classification for ILs proposed by Angell et al.22 ). The plot includes the classification for ILs proposed by Angell et al.22 | ||
In the literature the Walden behavior for aprotic IL/solvent mixtures has never been described and this particular observed behavior is not yet fully explained. α values seem to indicate that ion pairing formation is more important for IL/GBL mixtures than for neat IL. Indeed, on one hand the ion-pair formation of ionic liquid is reported to be promoted by diluting in solvent27 and on the other hand, the dielectric constant of solvents decreases with the increasing in temperature favouring also ion pairing.28 Therefore, the solvation of IL by GBL diminishes with the increase in temperature, resulting in an increase of ion-pairs with the temperature. Consequently, the combination of the two effects i.e. the dilution effect and the temperature increase can explain lower α values compared with neat ILs.
Electrochemical window (EW)
Cyclic Voltammetry (CV) is a dynamic electrochemical method to investigate the electrochemical behavior of organic molecules29 or polymers30 e.g. to estimate their ionization potential and electronic affinity. In the field of batteries and supercapacitors, CV is also useful to determine the electrochemical windows of active material or electrolytes. This has been widely explored for ionic liquids31 and solid-state polymer ionic liquids.32,33 EWs are determined for the three neat ionic liquids and IL/GBL mixtures on glassy carbon electrodes with current density boundaries of ±0.28 mA cm−2 over the available temperature range (Fig. 6).Because of the melting point of neat ionic liquids,8,17 EWs determination for neat ILs is only performed from 0 °C to 100 °C at 20 mV s−1. On the other hand, because IL/GBL mixtures remain liquid and fluid at low temperature, EWs have been determined for IL/GBL mixtures until −50 °C at 20 mV s−1.
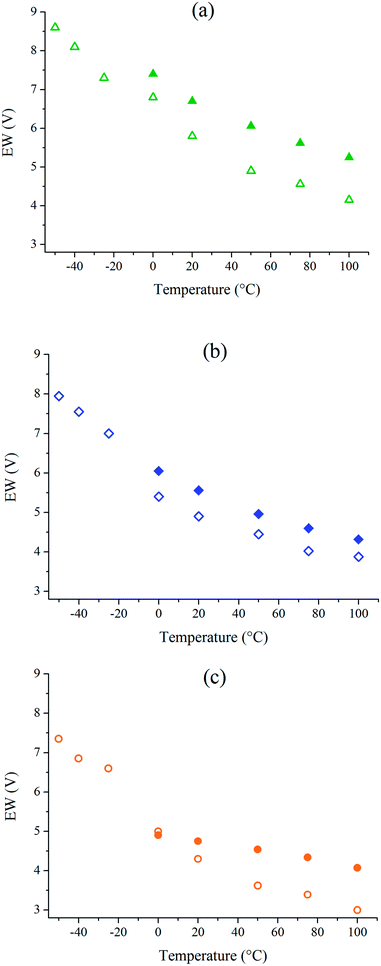
The corresponding cyclic voltamograms are reported in ESI, Fig. S3 and S4.† Studies generally use a cut-off current density between 0.01 mA cm−2 and 3 mA cm−2 for the determination of electrochemical windows in the field of supercapacitors.11,34,35 Density boundaries were chosen at which the results were the most reproducible i.e. ±0.28 mA cm−2. The cut-off current density of 0.1 mA cm−2 is often used hence reported in ESI (Table S6†). The electrochemical windows (EW = |Ered| + |Eox|) at 0 °C, 20 °C and 100 °C for neat ionic liquids and at −50 °C, 0 °C, 20 °C and 100 °C their mixtures with 50 wt% of GBL are presented in Table 1. The addition of GBL upon ionic liquids systematically decreases the electrochemical windows but for 50 wt% IL/GBL mixtures they remain at least as wide as 7.4 V at −50 °C and 3.0 V at 100 °C.
Conclusions
We have investigated thermal, physico-chemical and electrochemical properties of three different ionic liquids: Pyr13FSI, Pyr14TFSI and EMITFSI, and their 50 wt% IL/GBL mixtures. The addition of GBL to ILs prevents the system from crystallizing. The main consequence is a considerably widen temperature operation range, especially toward low temperatures. Viscosity, ionic conductivity and electrochemical window measurements were studied over a wide temperature range [−50 °C; 100 °C]. Viscosity and ionic conductivity exhibited the VTF behavior as commonly observed for ILs. The Walden plot showed that all neat ionic liquids and IL/GBL mixtures present a good ionicity, and follow the partial Walden rule, with a lower α value for binary mixtures. The addition of solvent dramatically increases the fluidity and the ionic conductivity of the system. On one hand, at −50 °C, all studied IL/GBL mixtures exhibit ionic conductivity from 1 to 2 mS cm−1. On the other hand, at 100 °C, electrochemical windows are as high as 3 V for EMITFSI/GBL and close to 4 V for Pyr13FSI/GBL and Pyr14TFSI/GBL which is extremely interesting for supercapacitor applications. Therefore those promising mixtures are under further investigation for applications in electrochemical devices.Acknowledgements
The authors thank the ANRT for the financial support through the L. Dagousset PhD thesis, and François Tran-Van (PCM2E University of Rabelais, Tours, France), for the densitometer studies.Notes and references
- R. Palm, H. Kurig and K. Tõnurist, Electrochem. Commun., 2012, 22, 203 CrossRef CAS PubMed.
- V. Ruiz and T. Huynh, RSC Adv., 2012, 2, 5591 RSC.
- A. Maziz, C. Plesse, C. Soyer, C. Chevrot, D. Teyssié, E. Cattan and F. Vidal, Adv. Funct. Mater., 2014, 24(30), 4851 CrossRef CAS.
- R. Temmer, A. Maziz, C. Plesse, A. Aabloo, F. Vidal and T. Tamm, Smart Mater. Struct., 2013, 22, 104006 CrossRef.
- D. Qin, Y. Zhang, S. Huang, Y. Luo, D. Li and Q. Meng, Electrochim. Acta, 2011, 56, 8680 CrossRef CAS PubMed.
- A. S. Shaplov, D. O. Ponkratov, P.-H. Aubert, E. I. Lozinskaya, C. Plesse, F. Vidal and Y. S. Vygodskii, Chem. Commun., 2014, 50(24), 3191 RSC.
- S. Ferrari, E. Quatarone, P. Mustarelli, A. Magistris, S. Protti, S. Lazzaroni, M. Fagoni and A. Albini, J. Power Sources, 2009, 194, 45 CrossRef CAS PubMed.
- M. Kunze, S. Jeong, E. Paillard, M. Winter and S. Passerini, J. Phys. Chem. C, 2010, 114, 12364 CAS.
- R. Lin, P.-L. Taberna, S. Fantini, V. Presser, C. R. Perez, F. Malbosc, N. L. Rupesinghe, K. B. K. Teo, Y. Gogotsi and P. Simon, J. Phys. Chem. Lett., 2011, 2, 2396 CrossRef CAS.
- T. Nishida, Y. Tashiro and M. Yamamoto, J. Fluorine Chem., 2003, 120, 135 CrossRef CAS.
- M. Ue, K. Ida and S. Mori, J. Electrochem. Soc., 1994, 141(11), 2989 CrossRef CAS PubMed.
- A. Chagnes, H. Allouchi and B. Carren, Solid State Ionics, 2005, 176, 1419 CrossRef CAS PubMed.
- M. Anouti and L. Timperman, Phys. Chem. Chem. Phys., 2013, 15, 6539–6548 RSC.
- P. Johansson, L. E. Fast, A. Matic, G. B. Appetecchi and S. Passerini, J. Power Sources, 2010, 195, 2074 CrossRef CAS PubMed.
- M. Galinski, A. Lewandowski and I. Stepniak, Electrochim. Acta, 2006, 51, 5567 CrossRef CAS PubMed.
- D. R. McFarlane, J. Sun, J. Golding, P. Meakin and M. Forsyth, Electrochim. Acta, 2000, 45, 1271 CrossRef CAS.
- P. Bonhote, A. P. Dias, N. Papageorgiou, K. Kalyanasundaram and M. Gratzel, Inorg. Chem., 1996, 35, 1168 CrossRef CAS PubMed.
- G. Gritzner and G. J. Kuta, Pure Appl. Chem., 1984, 56, 441 CrossRef.
- J. Ortega, R. Vreekamp, E. Penco and E. Marrero, J. Chem. Thermodyn., 2008, 40, 1087 CrossRef CAS PubMed.
- J. Vila, C. Franjo, J. M. Pico, L. M. Varela and O. Cabeza, Port. Electrochim. Acta, 2007, 25, 163 CrossRef CAS.
- P. Z. Walden, Phys. Chem., 1906, 55, 207 CAS.
- W. Xu, E. I. Cooper and C. A. Angell, J. Phys. Chem. B, 2003, 107, 6170 CrossRef CAS.
- F. A. Pugsley and F. E. W. Wetmore, Can. J. Chem., 1954, 32, 839 CrossRef CAS.
- J. Frenkel, Kinetic theory of liquids, The Clarendon Press, Oxford, 1946 Search PubMed.
- R. A. Robinson and R. H. Stokes, Electrolyte Solutions, Butterworths, London, 2nd edn, 1959, 5th reprint 1970 Search PubMed.
- T.-Y. Wu, L. Hao, C.-W. Kuo, Y.-C. Lin, S.-G. Su, P.-L. Kuo and I.-W. Sun, Int. J. Electrochem. Sci., 2012, 7, 2047 CAS.
- T. Köddermann, C. Wertz, A. Heintz and R. Ludwig, ChemPhysChem, 2006, 7(9), 1944 CrossRef PubMed.
- A. L. Horvath, Halogenated Hydrocarbons: Solubility-Miscibility with Water, CRC Press, 1982 Search PubMed.
- N. Metri, X. Sallenave, C. Plesse, L. Beouch, P.-H. Aubert, F. Goubard, C. Chevrot and G. Sini, J. Phys. Chem. C, 2012, 116, 3765 CAS.
- J. L. Bredas, R. Silbey, D. S. Boudreaux and R. R. Chance, J. Am. Chem. Soc., 1983, 105(22), 6555 CrossRef CAS.
- M. Hayyan, F. S. Mjalli, M. A. Hashim, I. M. Al Nashef and T. X. Mei, Ind. Eng. Chem. Res., 2013, 19(1), 106 CrossRef CAS PubMed.
- A. S. Shaplov, E. I. Lozinskaya, D. O. Ponkratov, I. F. Malyshkina, F. Vidal, P.-H. Aubert and Y. S. Vygodskii, Electrochim. Acta, 2011, 57, 74 CrossRef CAS PubMed.
- A. S. Shaplov, D. O. Ponkratov, P.-H. Aubert, E. I. Lozinskaya, C. Plesse, F. Vidal and Y. S. Vygodskii, Chem. Commun., 2014, 50, 3191 RSC.
- H. Ohno, Electrochemical aspects of ionic liquids, John Wiley & Sons, 2005, ch. 4, pp. 35–55 Search PubMed.
- A. B. McEwen, H. L. Ngo, K. LeCompte and J. L. Goldman, J. Electrochem. Soc., 1999, 146(5), 1687 CrossRef CAS PubMed.
Footnote |
| † Electronic supplementary information (ESI) available. See DOI: 10.1039/c4ra13933j |
| This journal is © The Royal Society of Chemistry 2015 |

