Quantifying the distribution of ceria nanoparticles in cucumber roots: the influence of labeling

Xin Guia, Xiao He*b, Yuhui Mab, Peng Zhangb, Yuanyuan Lib, Yayun Dingb, Ke Yangc, Huafen Lia, Yukui Rui*a, Zhifang Chaib, Yuliang Zhaob and Zhiyong Zhang*b
aCollege of Resources and Environmental Sciences, China Agricultural University, Beijing 100093, China. E-mail: ruiyukui@163.com
bKey Laboratory for Biomedical Effects of Nanomaterials and Nanosafety, Key Laboratory of Nuclear Radiation and Nuclear Energy Technology, Institute of High Energy Physics, Chinese Academy of Sciences, Beijing 100049, China. E-mail: hx421@ihep.ac.cn; zhangzhy@ihep.ac.cn; Fax: +86-10-88235294; Tel: +86-10-88233215
cShanghai Synchrotron Radiation Facility, Shanghai Institute of Applied Physics, Chinese Academy of Sciences, Shanghai 201204, China

Received 5th November 2014 , Accepted 8th December 2014

First published on 9th December 2014


Abstract

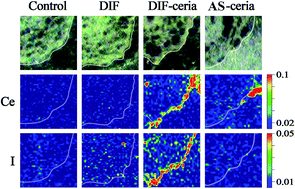
Monitoring the fate of nanoparticles (NPs) in the environment and organisms is always the first step towards better understanding the mechanisms for their toxicity. Fluorescent labeling is one of the most common methods to detect the NPs in samples, however, the attachment of a fluorescent tag to NPs might cause unwanted changes in the distribution and bio-effects of NPs. In the present work, the distribution of ceria nanoparticles (nano-ceria) in cucumber roots after fluorescent labeling, as well as the influence of labeling, was studied. Nano-ceria sized 6.6 nm was labeled by surface coating with diiodofluorescein (DIF), so that the distribution of NPs and the fluorophore could be determined simultaneously by micro-synchrotron radiation X-ray fluorescence (μ-SRXRF) analysis. The two-dimensional mappings of Ce and I in the roots treated with DIF, nano-ceria, and DIF-coated nano-ceria were compared with each other. DIF-coating, though only 25% of the particulate surface was coated, might alter the surface properties of nano-ceria, thereby changing its distribution in cucumber. The co-existence of nano-ceria and DIF greatly enhanced the contact between seeds and DIF, increased the local concentration of DIF on the root surface, and exacerbated the phytotoxicity of DIF. To the best of our knowledge, this is the first study focusing on how the labeling protocol affects the distribution and bio-effects of both the labeling tag and the NPs. Therefore, a guideline on the applicability of the labeling protocol should be developed to ensure the nanotoxicological data obtained using labeling techniques are precise and reliable.


Introduction

With the rapid development of nanoscience and nanotechnology, engineered nanoparticles (NPs) with various types, sizes, and shapes are being constantly produced. The wide application of NPs has accelerated the environmental release of NPs, which might lead to unwanted exposure risks.1 Monitoring the fate of NPs in the environment and organisms is always the first and most important step towards better understanding the underlying mechanisms for NPs exposure.2

Nowadays, cerium oxide NPs (nano-ceria) play an active role in solid-state physics, chemistry, and materials science.3 Moreover, it has been widely used in Europe as a diesel fuel catalyst, and thereby have become a focus of numerous studies.4–6 These applications have generated a need for simple methods for nano-ceria quantification, to enable further toxicological monitoring and risk assessment. In our previous work, the distribution of nano-ceria sized 6.6 nm in rats and plants were investigated using radiotracer technique.7,8 The biodistribution of nano-ceria could also be mapped by synchrotron radiation (SR) X-ray fluorescence analysis.9,10

However, the applications of radiotracer and SR-based techniques are both greatly restricted by their high cost and very limited accessibility.11 Light/fluorescence microscopy is one of the most common methods used in nanotoxicological studies because of its high sensitivity, simplicity, flexibility, and diversity. Therefore, we try to develop an optical microscopy approach to monitor the distribution of nano-ceria in vivo and in vitro, to replace the radiotracer methods or SR-based methods. As for those NPs without inherent fluorescence, various strategies have been developed for the fluorescent labeling of NPs. Besides fluorescent labelling via covalent binding, NPs could also be easily dyed with fluorophore via surface adsorption due to their large surface area. For instance, MgO NPs were tagged with fluorescein by surface adsorption,12 while anatase TiO2 NPs were coated with alizarin red S (ARS).11 But before the tracking study, the reliability of fluorescent labeling should be evaluated.

The reliability and precise of fluorophore-coating approach would be compromised by two factors: the instability of NPs–tag conjugates during the tracking process; the labeling-caused changes in the behaviors of NPs. In the previous studies, the former factor has always been examined before the adoption of fluorescent labeling, while the influence of labeling on the distribution and fate of NPs has been rarely studied. For instance, the intracellular stability of the titania–ARS nanoconjugates was confirmed as the distribution of high-intensity Ti signal generally showed an overlap with the bright fluorescent spots.13,14 However, it remained unknown whether the changes caused by labeling could affect the behaviors and bio-effects of titania NPs. As the behaviors and bio-effects of NPs are usually nanoproperties-dependent, labeling-caused changes in the fate of titania were predictable,15 taking into account the fact that 44% or more surface titanium atoms were bound with ARS.13,14 Therefore, the labeling-caused changes in the properties of NPs as well as the subsequent changes in the fate of NPs should be studied.

To evaluate whether the fluorophore-coating approach could be developed as a simple method for nano-ceria quantification and imaging in vivo and in vitro, the distribution and bio-effects of NPs before and after fluorophore-coating have been studied in this work. Nano-ceria sized 6.6 nm were labeled via surface coating as described before,12–14 with a little modification. Briefly, diiodofluorescein (C20H10I2O5, DIF) rather than fluorescein (C20H12O5) was used as the fluorescent tag, because (i) the distribution of I element could be detected with μ-SRXRF; (ii) the background concentration of I in cucumber samples is relatively low; (iii) DIF could be adsorbed on the surface of nano-ceria in ultrapure water or PBS. By using μ-SRXRF, the distribution of nano-ceria and fluorophore can be simultaneously determined via cerium (Ce) and iodine(I) mapping. After the distribution of DIF-coated nano-ceria in cucumber plant was obtained, the influence of the labeling on the bio-effects of nano-ceria was also investigated.

Experimental

Preparation and characterization of nano-ceria

Nano-ceria was synthesized via a precipitation method as previously described.7 The morphology and size distribution of the as-synthesized particles (AS–ceria) were characterized by TEM (FEI Co., Eindhoven, The Netherlands). The surface charge density determination in terms of zeta potential in aqueous solution was evaluated by dynamic light scattering (DLS) analysis (Zeta-Sizer, Malvern Instruments, UK). Further details of the preparation and characterization are described in the ESI.

Diiodofluorescein adsorption by AS–ceria

DIF was purchased from Sigma-Aldrich. DIF-coated nano-ceria (DIF–ceria) was prepared by mixing 25 mg of AS–ceria with 50 mL 2 × 10⁻⁵ M DIF solution in absolute methanol and shaking the mixture continuously for 15 min. The suspension was washed twice with absolute methanol and then dialyzed with absolute methanol for 24 h to remove any residue from the fluorescein solution. After centrifugation and rinsing with ultrapure water twice, the DIF–ceria was re-dispersed in 50 mL ultrapure water (the final concentration of nano-ceria was 500 mg L−1).

Five-day germination test

Incubation. Cucumber (Cucumis sativus) is a widely consumed plant, with high economical and ecological relevance, and among the 10 species recommended by USEPA for phytotoxicity testing.16 Seeds of cucumber were purchased from the Chinese Academy of Agricultural Sciences. Root elongation toxicity test was conducted according to the USEPA guidelines.16 Briefly, seeds of similar size were randomly selected and were immersed in a 10% sodium hypochlorite solution for 10 min to ensure surface sterility. One piece of filter paper was put into each 100 mm Petri dish, and 5 mL of each test medium was added. Seeds were then placed onto the filter paper, with 10 seeds per dish and 1 cm or larger distance between each seed. Petri dishes were covered and sealed with tape, and placed in the dark in a growth chamber at 25 °C. After 5 days, more than 90% of the seeds of control had germinated.
Elemental quantification by ICP-MS and μ-SRXRF. Roots of cucumber seedlings under each treatment were collected after the 5 day germination, and thoroughly washed with flowing tap water and ultrapure water, successively. The dried samples were ground to fine powder by the agate mortar and pestle. Roots and standard reference material were digested with the mixture of 1.2 mL HNO3 and 0.3 mL H2O2 using the Mars Xpress Microwave Digestion System (CEM, USA). The residue was diluted with ultrapure water and concentration of Ce was determined by ICP-MS (Thermo Elemental X7 ICP-MS).

The distribution of nano-ceria in cucumber roots was also determined by μ-SRXRF after the 5 day germination. Cross-sections (40 μm thick) of the mid-transverse areas were cut with a freezing microtome (LEICA) at an ambient temperature of −20 °C. Elemental mapping of Ce and I in the sections was carried out on beam line BL15U1 at the Shanghai Synchrotron Radiation Facility (SSRF), China. The storage ring of SSRF ran at energy of 3.5 GeV with current intensity of 200–300 mA. The incident beam was monochromatized by a Si (111) double-crystal monchromator and then focused with a K–B mirror system to achieve a micron sized beam spot at the sample position. Root sections were mounted on X–Z translation stages and scanned with an interval of 5 μm for each step. The fluorescence intensities of Ce, I, and Compton scattering were collected up to 2 s for each point with a Si(Li) detector. The fluorescence intensity was normalized to the incident X-ray intensity, and Compton scattering was used as an internal standard to compensate the differences in thickness and density of the samples.17 The mapping was produced using the software Igor pro 5.

Root elongation. After the 5 day germination, the length of cucumber roots was measured (40 replicates in each group).

Five-day germination test with a two-hour pre-soaking

Seed soaking and incubation. In a standard germination test, the seeds placed on the filter paper could not be completely soaked in the test medium because only 5 mL of test medium was added into the 10 cm Petri disk. Therefore, a modification to the USEPA method was done as described previously:18 the seeds of each group were pre-soaked in the respective solutions for 2 h before the 5 day germination test.
Quantifying the trace metals in roots. After the pre-soaking and 5 day germination, roots were thoroughly washed, dried and digested. The residue was diluted with ultrapure water and concentrations of Ce, iron (Fe), copper (Cu), zinc (Zn) and magnesium (Mn) were determined by ICP-MS.
Root elongation, H2O2 accumulation and cell death. The root elongation toxicities of AS–ceria, DIF and DIF–ceria were evaluated by the modified germination test. H2O2 was detected using DAB by the method previously described.19 Roots section of 20 mm were cut and incubated in 1 mg mL−1 DAB–HCl (pH 3.2–3.8) in darkness for 5 h. Then the samples were grounded in a mixture of 2 M KOH and DMSO at a ratio of 1[thin space (1/6-em)]:[thin space (1/6-em)]1.167 (v/v). The precipitate was removed by centrifugation, and the supernatant extract was measured colorimetrically at 700 nm to determine the amount of formazan formation in roots.

The cell death of the selected cucumber roots was evaluated by the method previously described by Baker and Mock using Evans blue (0.025% v/v) for 2 h.20 After several washes with water, the Evans blue was extracted using 1% (w/v) SDS in 50% (v/v) methanol at 50 °C for 15 min, and the optical density was measured colorimetrically at 597 nm. Cell death was expressed as the relative absorbance of the treatment group versus that of the control.

Data analysis

The results are expressed as mean ± SD (standard deviation). Statistical analysis was performed with SPSS 15.0 (Chicago, IL, USA). One-way ANOVA followed by post hoc Tukey multiple comparisons or Kruskal–Wallis H ANOVA followed by Mann–Whitney U test was run to test for significant differences between treatments where appropriate. A p-value of less than 0.05 was considered as statistically significant.

Results and discussion

Characterization of nano-ceria

TEM image of nano-ceria is shown in Fig. 1. Nano-ceria have a truncated octahedral shape with an average size of 6.6 ± 0.3 nm. XRD spectra (ESI) exhibit the cubic fluorite structure. The DIF solution and DIF–ceria suspension exhibit different colors: bright orange for DIF alone (Fig. 1B) and pink for DIF–ceria (Fig. 1C). Therefore, our case was a replica of the previous report from Kurepa et al.,13 in which, ARS-coated TiO2 NPs exhibited a shade of red different from ARS alone (red versus magenta) and could thereby be tracked using both bright-field and fluorescent microscopy.
image file: c4ra13915a-f1.tif
Fig. 1 The TEM images of nano-ceria (A); appearance of the DIF suspension (B) and the suspension of DIF-coated nano-ceria (C).

The DIF–ceria suspension contained 500 mg L−1 nano-ceria and 2 × 10⁻⁵ M DIF. The dose design was based on the following facts:

(1) our previous work demonstrated that 500 mg L−1 nano-ceria had no significant effects on the germination and root elongation of cucumber;21

(2) according to a standard root elongation toxicity test, DIF exposure had no effect on the root elongation at a level of 2 × 10⁻⁵ M (Fig. S2, ESI);

(3) 2 × 10⁻⁵ M DIF, on average, covered 25% of the surface of nano-ceria, lower than those in the previous report,13 but high enough to be determined by μ-SRXRF;

(4) DIF-coating at the selected concentration didn't greatly change the hydrodynamic size and zeta-potential of particle agglomerates. The hydrodynamic sizes of AS–ceria and DIF–ceria were 34.2 ± 9.7 nm (PDI = 0.218) and 39.5 ± 13.4 nm (PDI = 0.241), respectively; their zeta-potentials were 36.6 ± 5.9 mV and 34.3 ± 7.0 mV.

Five-day germination test

Quantifying and imaging nano-ceria in cucumber. After a standard 5 day germination test, the total Ce content in roots was determined by ICP-MS. In comparison with the control and the DIF treatment, As–ceria exposure during the 5 day germination greatly increased the Ce content in cucumber roots (Fig. 2). An even higher concentration of Ce was found in the DIF–ceria group: a 36.2% increase versus the As–ceria group (p < 0.01), suggesting a significant role of surface coating with DIF. TEM images (Fig. S3, ESI) showed that most of the As–ceria and DIF–ceria agglomerates were adsorbed on the surface of roots though the seedlings had been thoroughly washed. The distribution of nano-ceria in roots was also studied with μ-SRXRF.
image file: c4ra13915a-f2.tif
Fig. 2 Total cerium concentrations in the cucumber roots of control, DIF, DIF–ceria, and As–ceria groups after a 5 day germination. The cerium concentration of every 40 roots in each group is determined and the values are expressed as mean ± SD (standard deviation) of 4 replicates. Bars labeled with different lowercase letters are significantly different at p < 0.05.

Both the stability of the DIF–ceria conjugates and the influence of DIF-coating on the distribution of nano-ceria were investigated by elemental mapping using μ-SRXRF. The distributions of Ce and I in the sample treated with DIF–ceria were compared with each other to examine the stability of DIF-coating on the surface of nano-ceria. The measurement illustrated an overlapped distribution of high-intensity Ce signal and high-intensity I signal around the epidermal region of roots (Fig. 3). Such overlapping was considered as evidence of the stability of titania–ARS conjugates in the previous reports, in which, X-ray fluorescence microscopy (XFM) was employed to detect the NPs while confocal microscopy was used to detect the fluorophore.13,14


image file: c4ra13915a-f3.tif
Fig. 3 Elemental mapping in the cross-sections of cucumber roots using μ-SRXRF technique. Row 1 shows the scanning area photographed by a monitor on the sample platform during the μ-SRXRF measurement; row 2 and 3 show the two-dimension distribution of Ce and I, respectively. The white curves represent the outlines of the roots. Scale bar represents 50 μm.

Due to the sensitivity and multi-elemental quantitative capability of μ-SRXRF analysis,11,22 the mappings of Ce and I in roots were obtained simultaneously, and the NPs distribution in the regions containing relative less nano-ceria (such as the stele region) could also be determined. The distribution patterns of Ce and I were generally similar, and most of the Ce and I were located on the root surface. The high-intensity signals of the two elements overlapped, but there were still some quantitative differences. A relative higher accumulation of I was found in the stele region with respect to the distribution of Ce. Therefore, the elemental mappings illustrated a detectable DIF desorption from the surface of nano-ceria. These quantitative differences might be overlooked if a less sensitive technique was employed.

The data from μ-SRXRF analysis also suggested that DIF-coating could influence the distribution of nano-ceria. In both As–ceria group and DIF–ceria group, high-intensity Ce signal could be found at the surface and the epidermal region of the roots, which suggests most of the NPs were located on the root surface. Ce signal could also be found in the central cylinder (the stele) of cucumber roots. More Ce was determined in the cucumber roots treated with DIF–ceria than those treated with As–ceria, which was consistent with the ICP-MS data. The quantitative mapping of Ce proved that DIF-coating facilitated the adsorption of nano-ceria onto the root surface. The higher local concentration of nano-ceria on the surface of roots might further evoke more uptake of nano-ceria by cucumber.

Moreover, the adsorption of AS–ceria on the root surface dramatically increased the local concentration of DIF at the surface of cucumber roots. In a standard germination test, seeds placed on the filter paper could not be completely soaked in the test medium because only 5 mL of test medium was added into the 10 cm Petri disk. As a result, very few I signals could be detected by μ-SRXRF on the root surface of DIF-treated samples (Fig. 3). The insufficient contact with the seed/seedling surface made DIF non-toxic at a concentration of 2 × 10⁻⁵ M. As for DIF–ceria, nano-ceria played a role of carrier, therefore enriched the local concentration of DIF on the root surface. The results of μ-SRXRF analysis showed that more I signals could be found on the root surface in DIF–ceria group than in DIF group. The enrichment may also lead to higher penetrations of both nano-ceria and DIF into the cucumber roots in comparison with the DIF-only or As–ceria treatment, respectively.

Effects of DIF, AS–ceria and DIF–ceria on the root elongation. The effects of DIF, AS–ceria and DIF–ceria on root elongation were evaluated after the standard 5 day germination tests. The result showed that seed germination of all treatments were not affected (data not shown); neither 500 mg L−1 AS–ceria nor 2 × 10⁻⁵ M DIF had significant effects on the root elongation of cucumber (Fig. 4). Interestingly, the exposure to DIF–ceria significantly reduced the cucumber root elongation (p < 0.01).
image file: c4ra13915a-f4.tif
Fig. 4 Cucumber root elongation of the control, DIF, DIF–ceria, and AS–ceria groups after a 5 day germination. The cucumber root length is expressed as mean ± SD of 40 replicates. Bars labeled with different lowercase letters are significantly different at p < 0.05.

Our preliminary study showed that DIF exposure showed no phytotoxicity at a concentration of 2 × 10⁻⁵ M; but it could significantly reduce the elongation of cucumber roots at a concentration of 1 × 10⁻⁴ M or higher. We speculated that the co-existence of nano-ceria markedly increased the local concentration of DIF at the root surface, thereby worsening the consequences of DIF exposure.

Five-day germination test with a two-hour pre-soaking

We further examined whether the bio-effects of DIF–ceria were derived from the toxicity of DIF. In the comparison study, a 2 hour pre-soaking of seeds in the respective solution was conducted before the 5 day germination, so that the seeds could sufficient contact with the test media. Pre-soaking the seeds in the DIF solution at the concentration of 2 × 10⁻⁵ M could result in sufficient contact between seeds and DIF, thereby significantly increasing the phytotoxicity of DIF in the 5 day germination (Fig. S2, ESI). So that, the toxicological patterns of DIF–ceria could be compared with those of DIF.
Contents of trace metals in roots. The contents of Ce, Fe, Cu, Zn and Mn were determined with ICP-MS (Fig. 5). We found that the 2 hour pre-soaking of seeds in the AS–ceria and DIF–ceria suspensions did not markedly increase the Ce content in cucumber roots (p > 0.05). The roots treated with DIF–ceria still had a significantly higher concentration of Ce than those treated with AS–ceria (p < 0.05).
image file: c4ra13915a-f5.tif
Fig. 5 Concentrations of Ce, Fe, Cu, Zn and Mn in cucumber roots of the control, DIF, DIF–ceria, and AS–ceria groups after a 2 hour pre-soaking followed by a 5 day germination. The values are given as mean ± SD (standard deviation) of 4 replicate dishes. Bars labeled with different lowercase letters are significantly different at p < 0.05.

The homeostasis of Fe, Cu, Zn and Mn is essential for plants since they are cofactors of metalloproteins and also act as regulator elements.23,24 The concentrations of Fe, Cu and Zn in roots were affected in a similar matter by As–ceria and DIF–ceria. Both As–ceria and DIF–ceria could decrease the concentrations of Fe and Cu, while the effect on the Zn content was not statistically significant. The consequences of DIF treatment were quite different: only the Zn concentration in roots was significantly changed. These results implied that the effects of DIF–ceria exposure on the homeostasis of Fe, Cu and Zn were dominated by nano-ceria, rather than their DIF-coating. The changes in the Mn content were quite different. DIF–ceria exposure resulted in a significantly lower Mn content when compared with the control group, while DIF or nano-ceria alone did not cause any markedly effect. But the differences in the Mn content between DIF–ceria, DIF and As–ceria groups were not statistically significant.

Root elongation, H2O2 accumulation and cell death. DIF and DIF–ceria treatments reduced the root elongation by 13.3% and 19.7%, respectively, with respect to the control (Fig. 6A). A histochemical detection of H2O2 on the root tip epidermal cells was performed with DAB assay, and the results indicated that DIF and DIF–ceria treatments induced H2O2 accumulation in root cells (Fig. 6B). Correspondingly, significant increases in cell death were found in the roots treated with DIF and DIF–ceria (Fig. 6C).
image file: c4ra13915a-f6.tif
Fig. 6 The root length, H2O2 accumulation and cell death in each group after a 5 day germination with a 2 hour pre-soaking. The cucumber root length is expressed as mean ± SD of 40 replicates; H2O2 accumulation and cell death in every 10 roots are determined and expressed as mean ± SD of at least 4 replicates. Bars labeled with different lowercase letters are significantly different at p < 0.05.

Generally, DIF and DIF–ceria exposures were quite similar in the tested toxic features. It implied that the bio-effects of DIF–ceria in the standard 5 day germination test were mainly derived from the toxicity of DIF. Although DIF alone at a concentration of 2 × 10⁻⁵ M would not significantly reduce the root elongation of cucumber, the co-existence of nano-ceria greatly enhanced the contact between seeds and DIF, thereby exacerbating the phytotoxicity of DIF.

These findings compromised our initial intention to use DIF as a tag for the monitoring of nano-ceria in organisms. However, the present design could be regarded as an example to illustrate whether and how the labeling protocol could affect the distribution of the labeled NPs. The fate of NPs in the environment and organisms as well as their toxicological outcomes was greatly dependent on the physicochemical properties of NPs, such as size/weight, shape, composition, surface chemistry, etc. Fluorescent labeling (no matter via physical adsorption or chemical binding) would more or less alter the properties of NPs, thereby changing their behaviors and bio-effects. In the present work, DIF-coating led to more nano-ceria translocated to the cucumber roots, though only 25% of the particulate surface was coated. Therefore, not only the stability of NPs–tag conjugates but also the labeling-caused changes in the behaviors and bio-effects of NPs should be assessed before the adoption of labeling protocol.

Although the influence of labeling is case-by-case, there is a precautionary principle to be followed: the labeling-caused changes in the properties of NPs should be minimized as much as possible. Here, we found that DIF-coating might alter the surface properties of nano-ceria, and thereby change its distribution in cucumber, though only 25% of the particulate surface was coated. Further study showed that the root elongation toxicity of DIF–ceria disappeared when 10% of the particulate surface was coated with DIF (Fig. S4, ESI).

Conclusion

In the present work, nano-ceria was labeled by surface coating with DIF, and two-dimensional mappings of Ce and I were obtained simultaneously by μ-SRXRF to outline the different distribution of nano-ceria and DIF-coated nano-ceria in cucumber. Our findings revealed the labeling-caused changes in the distribution of nano-ceria in cucumber plants. The co-existence of nano-ceria and DIF would also markedly increased the local concentration of DIF on the root surface, thereby exacerbating the phytotoxicity of DIF. To the best of our knowledge, this is the first study focusing on how the labeling protocol affects the distribution and bio-effects of both the labeling tag and the NPs. Our findings call for new criteria for the design of labeling protocols in nanotoxicological study.

Acknowledgements

This work was financially supported by the Key National Natural Science Foundation of China (no. 41130526), the Ministry of Science and Technology of China (no. 2011CB933400, 2012CB932504 and 2013CB932703), and National Natural Science Foundation of China (no. 11275215, 11275218, and 11375009).

References

  1. Y. Zhao, G. Xing and Z. Chai, Nat. Nanotechnol., 2008, 3, 191–192 CrossRef CAS PubMed.
  2. B. Wang, X. He, Z. Zhang, Y. Zhao and W. Feng, Acc. Chem. Res., 2013, 46, 761–769 CrossRef CAS PubMed.
  3. X. He, Y. Kuang, Y. Li, H. Zhang, Y. Ma, W. Bai, Z. Zhang, Z. Wu, Y. Zhao and Z. Chai, Nanotoxicology, 2012, 6, 233–240 CrossRef CAS PubMed.
  4. A. C. Johnson and B. Park, Environ. Toxicol. Chem., 2012, 31, 2582–2587 CrossRef CAS PubMed.
  5. F. R. Cassee, E. C. van Balen, C. Singh, D. Green, H. Muijser, J. Weinstein and K. Dreher, Crit. Rev. Toxicol., 2011, 41, 213–229 CrossRef PubMed.
  6. C. O. Hendren, X. Mesnard, J. Dro ge and M. R. Wiesner, Environ. Sci. Technol., 2011, 45, 2562–2569 CrossRef CAS PubMed.
  7. X. He, H. Zhang, Y. Ma, W. Bai, Z. Zhang, K. Lu, Y. Ding, Y. Zhao and Z. Chai, Nanotechnology, 2010, 21, 285103 CrossRef PubMed.
  8. Z. Zhang, X. He, H. Zhang, Y. Ma, P. Zhang, Y. Ding and Y. Zhao, Metallomics, 2011, 3, 816–822 RSC.
  9. E. Artells, J. Issartel, M. Auffan, D. Borschneck, A. Thill, M. Tella, L. Brousset, J. Rose, J.-Y. Bottero and A. Thiéry, PLoS One, 2013, 8, e71260 CAS.
  10. J. A. Hernandez-Viezcas, H. Castillo-Michel, J. C. Andrews, M. Cotte, C. Rico, J. R. Peralta-Videa, Y. Ge, J. H. Priester, P. A. Holden and J. L. Gardea-Torresdey, ACS Nano, 2013, 7, 1415–1423 CrossRef CAS PubMed.
  11. X. He, Y. Ma, M. Li, P. Zhang, Y. Li and Z. Zhang, Small, 2013, 9, 1482–1491 CrossRef CAS PubMed.
  12. P. Stoimenov, R. Klinger, G. Marchin and K. Klabunde, Langmuir, 2002, 18, 6679–6686 CrossRef CAS.
  13. J. Kurepa, T. Paunesku, S. Vogt, H. Arora, B. Rabatic, J. Lu, M. Wanzer, G. Woloschak and J. Smalle, Nano Lett., 2010, 10, 540–545 CrossRef PubMed.
  14. K. T. Thurn, T. Paunesku, A. Wu, E. Brown, B. Lai, S. Vogt, J. Maser, M. Aslam, V. Dravid and R. Bergan, Small, 2009, 5, 1318–1325 CrossRef CAS PubMed.
  15. R. H. Hurt, M. Monthioux and A. Kane, Carbon, 2006, 44, 1028–1033 CrossRef CAS PubMed.
  16. USEPA, Pesticides and Toxic Substances, O. o. P. Environmental Protection Agency, Washington, DC, 1996 Search PubMed.
  17. H. Zhang, X. He, W. Bai, X. Guo, Z. Zhang, Z. Chai and Y. Zhao, Metallomics, 2010, 2, 806–810 RSC.
  18. D. Lin and B. Xing, Environ. Pollut., 2007, 150, 243–250 CrossRef CAS PubMed.
  19. P. Begum, R. Ikhtiari and B. Fugetsu, Carbon, 2011, 49, 3907–3919 CrossRef CAS PubMed.
  20. C. J. Baker and N. M. Mock, Plant Cell, Tissue Organ Cult., 1994, 39, 7–12 CrossRef.
  21. Y. Ma, L. Kuang, X. He, W. Bai, Y. Ding, Z. Zhang, Y. Zhao and Z. Chai, Chemosphere, 2010, 78, 273–279 CrossRef CAS PubMed.
  22. H. J. Wang, M. Wang, B. Wang, X. Y. Meng, Y. Wang, M. Li, W. Y. Feng, Y. L. Zhao and Z. F. Chai, J. Anal. At. Spectrom., 2009, 25, 328–333 RSC.
  23. I. Yruela, Metallomics, 2013, 5, 1090–1109 RSC.
  24. P. Nagajyoti, K. Lee and T. Sreekanth, Environ. Chem. Lett., 2010, 8, 199–216 CrossRef CAS PubMed.

Footnote

Electronic supplementary information (ESI) available. See DOI: 10.1039/c4ra13915a

This journal is © The Royal Society of Chemistry 2015
Click here to see how this site uses Cookies. View our privacy policy here.