Zahra Padashbarmchiab,
Amir Hossein Hamidiana,
Hongwei Zhangb,
Liang Zhou*b,
Nematolah Khorasania,
Mahmood Kazemzadc and
Chengzhong Yu*b
aDepartment of Environmental Sciences, Faculty of Natural Resources, University of Tehran, P. O. Box 51585-4314, Karaj, Iran
bAustralian Institute for Bioengineering and Nanotechnology, The University of Queensland, Brisbane, QLD 4072, Australia. E-mail: c.yu@uq.edu.au; l.zhou1@uq.edu.au; Fax: +61-7-334-63973; Tel: +61-7-334-63283
cDepartment of Energy, Materials and Energy Research Center, P. O. Box 14155-4777, Tehran, Iran
First published on 6th January 2015
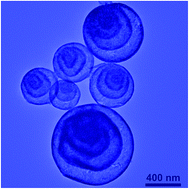
Hematite (α-Fe2O3) multi-shelled hollow spheres (MSHSs) have been prepared by a facile spray drying method using iron(III) citrate and sucrose as the precursors. The sucrose/iron(III) citrate ratio plays an important role in the morphology of the products. Well-defined MSHSs can be obtained in a wide sucrose/iron(III) citrate ratio of 0.25–1.5. The application of α-Fe2O3 MSHSs in lithium storage has been demonstrated. When used as the anode material for lithium-ion batteries, the α-Fe2O3 MSHSs exhibit a high reversible capacity of 979 mA h g−1, maintaining 861 mA h g−1 after 50 cycles.
Due to their effectiveness in alleviating the volume expansion issue, a number of methodologies have been developed to synthesise α-Fe2O3 hollow structures for lithium storage. For example, Lou et al. reported a quasiemulsion-templated method for the synthesis of α-Fe2O3 hollow spheres with sheet-like subunits.15 The same group also developed a thermal decomposition approach towards α-Fe2O3 hollow microboxes by using Prussian blue microcubes as the precursor.16 Wang and co-workers reported the synthesis of α-Fe2O3 MSHSs with controlled number of shells by employing carbonaceous microspheres as the sacrificial templates.3,17 This method is quite versatile and can be generally applied to other transition metal oxide hollow structures.21–25 Zhou et al. developed a low-cost and scalable spray drying method for the production of α-Fe2O3 MSHSs using iron nitrate and sucrose as the precursors.18 Similar to the spray drying method, spray pyrolysis was also employed to synthesise α-Fe2O3 yolk–shell spheres.19
Although α-Fe2O3 MSHSs can be prepared in large scale by spray drying iron nitrate and sucrose followed by calcination,18 some challenges still exist: (1) iron nitrate is a strong oxidant, while sucrose is a reductant; the spray drying of iron nitrate and sucrose in large scale may pose unacceptable safety hazards such as explosion. (2) Iron nitrate has a strong tendency to absorb moisture (the so-called hygroscopy), so does the iron nitrate–sucrose composite, making the storage of iron nitrate and iron nitrate–sucrose composite a problem. (3) The thermal decomposition of iron nitrate generates highly toxic gases such as NO2. (4) Well defined α-Fe2O3 MSHSs can only be obtained in a narrow sucrose/iron nitrate range (from 0.75 to 1.0) due to the hygroscopy of iron nitrate. These limitations make the mass production of α-Fe2O3 MSHSs by spray drying iron nitrate and sucrose industrially unfeasible. Herein, we find that iron(III) citrate, a mild oxidant with zero nitrogen-content, can be used as the iron precursor to replace iron nitrate in spray drying. The above-mentioned four limitations associated with the utilisation of iron nitrate can be overcome, making the mass production viable.
Sample name | Sucrose amount (mmol) | Iron(III) citrate amount (mmol) | xa | SBETb m2 g−1 | Vpc cc g−1 | Solid contentd % |
---|---|---|---|---|---|---|
a x = sucrose/iron(III) citrate ratio.b BET surface area.c Total pore volume.d Solid content of the iron(III) citrate–sucrose composites determined from TGA under air flow.e Sample 8 is prepared by calcination of the grinded iron(III) citrate–sucrose mixture at 400 °C for 5 hours. | ||||||
Sample 1 | 5 | 10 | 0.5 | 38.1 | 0.17 | 14.23 |
Sample 2 | 0 | 10 | 0 | 60.5 | 0.16 | 27.91 |
Sample 3 | 2.5 | 10 | 0.25 | 49.0 | 0.15 | 14.76 |
Sample 4 | 7.5 | 10 | 0.75 | 28.5 | 0.12 | 13.36 |
Sample 5 | 10 | 10 | 1.0 | 39.3 | 0.15 | 13.08 |
Sample 6 | 15 | 10 | 1.5 | 12.9 | 0.09 | 9.01 |
Sample 7 | 20 | 10 | 2.0 | 15.5 | 0.06 | 7.66 |
Sample 8e | 5 | 10 | 0.5 | 14.8 | 0.15 | — |
A typical sample prepared with a sucrose/iron(III) citrate ratio of 0.5 (Sample 1) is shown in Fig. 1. Scanning electron microscopy (SEM) image (Fig. 1a) shows that well-defined Fe2O3 spheres with sizes ranging from 400 to 3000 nm can be obtained with high purity. For some spheres, especially those small in size, the electron beam is able to penetrate 1–2 shells, displaying the inner core particles. This phenomenon indicates that the Fe2O3 spheres may actually have a yolk–shell or multi-shelled hollow structure. Transmission electron microscopy (TEM) images (Fig. 1b–d) undisputedly demonstrate the multi-shelled hollow structure of the synthesised sample. Most of the Fe2O3 spheres have three to four porous shells constructed by numerous nanoparticulate building blocks. The selected area electron diffraction (SAED) pattern (Fig. 1e) of an individual sphere (Fig. 1c) shows a series of discontinuous concentric rings, indicating the polycrystalline characteristic. The diffraction rings from inside to outside can be indexed to the (012), (104), (110), (113), (024) and (116) diffractions of α-Fe2O3, respectively. A typical high-resolution TEM (HRTEM) image is shown in Fig. 1f, where the {012} (0.37 nm) and {110} (0.25 nm) lattice fringes of α-Fe2O3 can be clearly observed. The crystallographic structure and phase purity of the synthesised Fe2O3 is identified by X-ray diffraction (XRD) to be pure rhombohedral phase α-Fe2O3 (Fig. 1g, JCPDS card no. 33-0664, space group: Rc, a = 0.5035 nm, c = 1.3748 nm). In consistent with the TEM results, the XRD pattern shows relatively broad diffraction peaks, indicating the nanocrystalline characteristic of the sample. The width (full width at half maximum) of the diffraction peaks reflects the crystallite size of the primary nanoparticles. By applying Scherrer's equation to the most intensive (104) diffraction peak, the collective mean crystallite size is estimated to be 18.82 nm. The textural properties of the α-Fe2O3 MSHSs are studied by N2 sorption (Fig. 1h). The α-Fe2O3 MSHSs exhibit a typical type IV isotherm with an H1-type hysteresis loop at high relative pressure, indicating the mesoporous structure. The irregular packing of nanocrystallites in the shells gives rise to a high BET surface area of 38.1 m2 g−1, a pore volume of 0.17 cm3 g−1, and a relatively broad pore size distribution centred at ∼20 nm. Compared to the α-Fe2O3 MSHSs obtained from iron nitrate,18 the sample prepared from iron(III) citrate shows a significant increased BET surface area (38.1 vs. 17.3 m2 g−1).
![]() | ||
Fig. 1 SEM image (a), TEM images (b–d), SAED (e), HRTEM image (f), XRD pattern (g), N2 adsorption–desorption isotherm (h), and pore size distribution (inset of h) of α-Fe2O3 MSHSs (Sample 1). |
To study the effects of sucrose/iron(III) citrate ratio on the formation of α-Fe2O3 MSHSs, the sucrose amount is tuned from 0 to 20 mmol in the synthesis, while other synthesis parameters are kept constant. When no sucrose is used in the synthesis (x = 0), crumpled microspheres with a deflated balloon-like morphology are obtained (Fig. 2a). Crumpled microspheres have been frequently found in spray drying and its formation is believed to be fast solvent evaporation induced deformation.28,29 Well-defined MSHSs can be synthesised in a wide sucrose/iron(III) citrate range of 0.25–1.50, corresponding to a sucrose amount of 2.5–15 mmol (Fig. 2b–e). This is in sharp contrast to the results obtained from iron nitrate precursor, where MSHSs can only be obtained in a narrow iron nitrate/sucrose ratio of 0.75–1.0 due to the hygroscopy of iron nitrate.18 Further increase of the sucrose amount to 20 mmol (x = 2.0) leads to aggregation and collapse of the MSHSs (Fig. 2f).
TEM characterisation is further utilised to obtain more information on the internal structure of the samples. As shown in Fig. 3a, deflated balloon-like microspheres comprised of numerous nanoparticles are obtained with an x value of 0. MSHSs with 2–3 shells and 3–4 shells can be obtained with a x value of 0.25 (Fig. 3b) and 0.50–1.5 (Fig. 1c and 3c–e), respectively. When the x value reaches 1.5, the shells of the MSHSs become less continuous. When x further increases to 2.0, severe aggregation and collapse of the MSHSs are observed, which is in agreement with the SEM results.
Thermal gravimetric analysis (TGA) analysis is used to obtain information on the decomposition behaviour of the as-synthesised iron(III) citrate–sucrose composites in air. TGA curves for selected samples (as-synthesised Sample 1, 2, 5, 6, and 7) are shown in Fig. S4.† The as-synthesised Sample 2 has a solid content of 27.91%. With the increase of sucrose/iron(III) citrate ratio (x), the solid content decreases continuously (Fig. S5† and Table 1). The collapse of the MSHSs in Sample 7 might be related to its low solid content (7.66%).
N2 sorption is employed to gain information on the textural properties of the synthesised samples. N2 adsorption–desorption isotherms and pore size distributions for selected samples are shown in Fig. S6.† The BET surface area and total pore volume of the samples are summarised in Table 1. Samples 1–5 with a x of 0–1.0 show relatively high surface area (25–60 m2 g−1) and pore volume (0.12–0.17 cm3 g−1). Although the MSHS structure can be maintained in Sample 6 (x = 1.5), it shows significantly reduced BET surface area and total pore volume. Due to the aggregation and collapse of the MSHSs, Sample 7 with an x value of 2.0 also shows low BET surface area and total pore volume as well.
From the above results, it is safe to draw the conclusion that the sucrose/iron(III) citrate ratio (x) plays an important role in the morphology of the products. Well-defined α-Fe2O3 MSHSs can be obtained with an x value of 0.25–1.5. Above this value, the solid content of the iron(III) citrate–sucrose composites is too low to support the multi-shelled hollow structure. As a result, the α-Fe2O3 MSHSs tend to collapse (Fig. 3f). Below this value, the porosity generated by burn-off of the organic species is not enough to induce the formation of MSHSs. Instead, crumpled microspheres with a deflated balloon-like morphology are obtained (Fig. 3a).
As a proof-of-concept application, the synthesised α-Fe2O3 MSHSs are assembled into half cells for lithium storage study. Fig. 4 shows the first five cyclic voltammograms (CVs) of the α-Fe2O3 MSHSs. Two reduction peaks can be observed in the first cathodic process: a minor peak centred at 1.50 V corresponding to the reduction of Fe3+ to Fe2+, and a pronounced peak located at 0.47 V corresponding to the reduction of Fe2+ to Fe and the irreversible reduction of the electrolyte.18 Only one broad peak located between 1.75 and 2.00 V can be observed in the first anodic process, corresponding to the oxidation of Fe to Fe3+. The CV curves for the subsequent cycles differ substantially from that of the first cycle. From the second cycle onward, only a pair of broad reduction/oxidation peaks can be observed and the CV curves generally overlap, suggesting the good reversibility of the redox reaction.
![]() | ||
Fig. 4 First five CVs of the α-Fe2O3 MSHSs at a scan rate of 0.1 mV s−1 in the voltage window of 0.01–3.0 V vs. Li/Li+. |
Representative galvonastatic discharge/charge curves are shown in Fig. 5a. The α-Fe2O3 MSHSs manifest an initial discharge and charge capacity of 1360 and 979 mA h g−1, respectively. The irreversible capacity loss is mainly due to the formation of solid electrolyte interface (SEI) layer.5 The discharge capacity decreases to 908 mA h g−1 in the first 5 cycles and then even off (Fig. 5b). Even after 50 discharge/charge cycles at 400 mA g−1, a high capacity of 861 mA h g−1 can still be retained. The coulombic efficiency as a function of cycle number is shown in Fig. S7.† The coulombic efficiency for the first cycle is 72%, it increases to 99.6% in 5 cycles and then stabilises. For the purpose of comparison, randomly aggregated α-Fe2O3 nanoparticles are prepared by calcination of the grinded iron(III) citrate–sucrose mixture at 400 °C (Sample 8, Fig. S8†). In contrast to α-Fe2O3 MSHSs, the discharge capacity of α-Fe2O3 nanoparticles is only 331 mA h g−1 after 40 cycles (Fig. S9†).
To evaluate the rate capability of the α-Fe2O3 MSHSs, the current density is increased stepwise from 400 to 4000 mA g−1 (Fig. 5c and d). The α-Fe2O3 MSHSs deliver a discharge capacity of 993, 821, 557, and 294 mA h g−1 at a current density of 400, 1000, 2000, and 4000 mA g−1, respectively. After the high rate discharge/charge cycling, a high specific capacity of 1052 mA h g−1 can be restored when the current density is reduced to 400 mA g−1.
Electrochemical impedance spectroscopy (EIS) is used to provide insight into the kinetics of lithium ion transfer. The Nyquist plots of the α-Fe2O3 MSHSs before and after 5 CV cycles are shown in Fig. 6. The two spectra share the common features of a depressed semicircle in the medium-to-high frequency region and an inclined linear tail in the low-frequency region. The former is related to the charge transfer resistance, while the later represents the Warburg impedance associated with the diffusion of lithium ions in the electrode materials.30,31 The diameter of the semicircle decreases significantly after 5 CV cycles, indicating the reduction in charge transfer resistance.
The superior lithium storage performance of α-Fe2O3 MSHSs can be attributed to the unique structural features: (1) the shells constructed by nanoparticles significantly shorten the distances for Li+ diffusion, contributing to the high rate capability; (2) the hollow cavity effectively accommodates the large volume change during lithiation–delithiation, which enhances the cycling stability.
When compared to the previous report on spray drying synthesis of α-Fe2O3 MSHSs, the simple replacement of iron nitrate with iron(III) citrate allows a number of benefits. (1) Iron(III) citrate is a mild oxidant; the spray drying of iron(III) citrate in large scale is much safer than the spray drying of iron nitrate, which has a stronger oxidation capability. (2) Iron(III) citrate has a weaker tendency to absorb moisture from the atmosphere than iron nitrate, making the storage much easier. (3) Iron(III) citrate is an environment-friendly precursor with zero-nitrogen content, the thermal decomposition of which generates no toxic gases. (4) Well-defined α-Fe2O3 MSHSs can be obtained in a wide range of sucrose/iron(III) citrate ratio of 0.25–1.5. This is in sharp contrast to the iron nitrate system, where α-Fe2O3 MSHSs can only be obtained in a narrow iron nitrate/sucrose ratio of 0.75–1.0.18
Footnote |
† Electronic supplementary information (ESI) available: TGA curves, N2 sorption results, and SEM images. See DOI: 10.1039/c4ra13790f |
This journal is © The Royal Society of Chemistry 2015 |