Polybenzoxazine-based nitrogen-containing porous carbons for high-performance supercapacitor electrodes and carbon dioxide capture

Liu Wanab, Jianlong Wanga, Yahui Sunab, Chong Fengab and Kaixi Li*a
aInstitute of Coal Chemistry, Chinese Academy of Sciences, Taiyuan 030001, P. R. China. E-mail: likx@sxicc.ac.cn; Fax: +86 351 4250292; Tel: +86 351 4250292
bGraduate University of Chinese Academy of Sciences, Beijing 100049, P. R. China

Received 2nd November 2014 , Accepted 11th December 2014

First published on 11th December 2014


Abstract

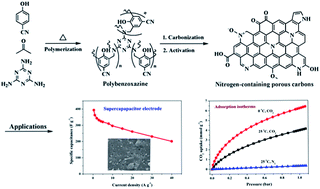
Nitrogen-containing porous carbons with a high surface area, well developed micro/mesoporous structure, high nitrogen and oxygen contents, and good conductivity were synthesized from a novel nitrile-functional polybenzoxazine through a soft-templating method and KOH chemical activation. The introduction of a soft-templating agent into the precursors and the activation temperature have a significant effect on the pore structure and the surface chemistry. The existence of mesopores enhances the accessibility to the surface of the carbon framework and adequate utilization of the active adsorption sites. The material NPC-2 activated at 700 °C shows the highest gravimetric capacitance of 362.4 F g−1 at a current density of 1 A g−1 in KOH aqueous electrolyte, high rate capability and excellent cycling stability with a capacitance retention of 94.7% after 5000 cycles. As a solid adsorbent, the NPC-1 activated at 600 °C shows the highest CO2 uptakes at 1 bar of 6.20 and 3.95 mmol g−1 at 0 and 25 °C, respectively. It exhibits a remarkable selectivity for CO2/N2 separation and excellent recyclability. Such high performance as supercapacitor electrode materials and CO2 adsorbents can be attributed to the high surface area, optimal pore size distribution, superior electrical conductivity and the surface nitrogen functionalities in the carbon matrix.

1 Introduction

Nitrogen-containing porous carbon (NPC) materials have attracted increasing attentions for sorption, catalysis and storage applications.1–4 There are two reasons for this phenomenon: one is due to their excellent textural characteristics, including high surface area, large pore volume, adjustable pore structure, good thermal and chemical stability;5,6 the other is due to the surface nitrogen functionalities in the carbon framework, which are considered to improve their electronic and chemical properties.7,8 The presence of electrochemically active surface nitrogen functionalities in the carbon network not only generate additional pseudo-capacitance by participating in Faradaic reactions at the electrolyte/electrode interfaces, but also improves the polarity of the carbon surface, electrical conductivity and the surface wettability towards the electrolytes.9,10 Therefore, many NPCs were widely used as the electrode materials for electrochemical double layer capacitors (EDLCs). NPCs derived from nitrogen-containing polymers,11–13 biomass and biomass derivatives,14,15 exhibit excellent capacitive behaviors, such as better electrical conductivity, higher specific gravimetric capacitance, and improved cyclic stability, in comparison with other carbon-based materials without any pseudo-active species.

In addition, NPCs can also be utilized as promising solid adsorbents for acidic gas adsorption, such as CO2, SO2 gases. The basic nitrogen functionalities in the carbon matrix promote the interactions between acidic CO2 molecules and the carbon surface.16,17 Thus, they show outstanding CO2 adsorption capacities and high CO2/N2 adsorption selectivity. For example, Wei et al. reported a N-doped activated carbon derived from a biomass material (bean dreg) exhibited a high CO2 uptake of 4.24 mmol g−1 at 25 °C under 1 atm.18 Wang and co-workers reported that a series of nitrogen-containing microporous carbons had extremely high CO2/N2 adsorption ratios (47 and 52 at 25 and 0 °C, respectively) at 1 bar in comparison with the previously reported values for various porous solids.19 Chandra et al. reported the N-doped porous carbon from polypyrrole functionalized graphene sheets yielded a maximum capacity of 4.3 mmol g−1 at 25 °C and 1 atm.20 Polybenzoxazine (PBZ) is a new class of nitrogen-containing polymer with convincing properties, including excellent thermal stability, high char yield, near-zero shrinkage upon curing, and rich molecular design flexibility.21–23 Benzoxazine monomers can be easily prepared from various phenols, primary amines and formaldehyde. Remarkably, compared with mono-functional benzoxazines, the bifunctional benzoxazines with different functional groups, such as allyl,24 acetylene,25 nitrile,26 and maleimide,27 can be further thermally polymerized into high-cross-linked PBZs with excellent performance, such as higher thermal stability and better mechanical properties.28 Thus, it is possible to synthesize high-performance NPCs from bifunctional benzoxazines in a cheap and easy manner. Unfortunately, up to date there are few reports in which PBZs are utilized as precursors for the synthesis of NPCs. For instance, Hao et al. have synthesized nitrogen-containing porous carbon monoliths from poly(benzoxazine-co-resol) polymers, which had an interconnected meso-/macropore structure and showed outstanding performance in CO2 capture.29 Wang et al. successfully prepared uniform carbon nanospheres with tunable sizes and high monodispersity from the PBZs for the first time, resulting from the excellent thermal stability of the PBZs. It can be inferred that such high-performance PBZ may be a promising precursor for nitrogen-containing porous carbons.30

In this work, a novel nitrile-functional benzoxazine monomer was for the first time prepared from 4-cyanophenol, melamine and formaldehyde via a solution method. Subsequently, the benzoxazines were converted into PBZs after thermally activated ring-opening polymerization reaction. The NPCs with hierarchical pore structure were synthesized from the nitrogen-rich PBZ by a soft-templating method and KOH activation method. The pore structure of the NPCs can be easily tailored by introducing the soft-templating agent (surfactant F127) or changing the activation temperature. To ascertain the potential of such PBZ-based NPCs as electrode materials for EDLCs and solid adsorbents for CO2 capture, we tested the electrochemical behaviour of the NPCs in 6 M KOH aqueous electrolyte and the CO2 capture performance at ambient pressure. The influence of pore structure and nitrogen, oxygen functionalities of the NPCs on electrochemical performance and CO2 capture properties were investigated in detail.

2 Experimental

2.1 Preparation of PBZ based HPCs

In a 250 mL three-necked round bottom flask equipped with a magnetic stirrer, a thermometer, and a reflux condenser, melamine (4.2 g) and formaldehyde (10.0 g) were added. The mixture was heated to 80 °C for 30 min and then cooled to room temperature (denoted as solution A). Surfactant F127 (3.6 g) and 4-cyanophenol (19.8 g) were dissolved in absolute ethanol (60.0 g) and stirred for 60 min (denoted as solution B). Then solution B were added into solution A, and heated under reflux at 90 °C for 6 h. After cooling to room temperature, the reaction mixture was poured into the dish to evaporate ethanol at room temperature for 12 h. The obtained benzoxazines were step-heated in an oven to 100, 150, 180, 220 and 250 °C, and held at each temperature for 4 h.

The composites of PBZ and surfactant F127 were further carbonized under a nitrogen atmosphere by heating at 600 °C for 5 h with a ramp rate of 1 °C min−1. The obtained carbonized samples were denoted as NPC-c, where c refers to carbonization. Then, NPC-c was chemically activated by heating a KOH–NPC-c mixture (weight ratio of 2[thin space (1/6-em)]:[thin space (1/6-em)]1) at 600, 700 or 800 °C for 1 h in a tube furnace under flowing nitrogen (with a ramping rate of 3 °C min−1), respectively. Then, the products were repeatedly washed with 1 M HCl and deionized water until the pH value of the filtrate reached about 7 and dried at 120 °C for 12 h. The obtained activated carbon materials were denoted as NPC-1, NPC-2 and NPC-3, respectively. For comparison, the sample named NPC-0 was prepared without adding any surfactant F127 and was activated at 600 °C, where 0 represents none amount of F127.

2.2 Structure characterization

N2 adsorption isotherms were measured using a Micromeritics ASAP2020 analyzer at 77 K. Before measurements were taken, all samples were degassed at 473 K for 12 h. The Brunauer–Emmett–Teller (BET) method was utilized to calculate the specific gravimetric surface areas (SBET). The total pore volume values (Vtotal) were estimated from the adsorbed amount at a relative pressure P/P0 of 0.99. The micropore pore volume (Vmicro) and micropore surface area (Smicro) were estimated using the t-Plot method. The pore size distributions (PSDs) were derived from density functional theory (DFT) method. Scanning electron microscope (SEM) investigations were carried out with a JEOL JSM-700 microscope instrument at an accelerating voltage of 10.0 kV. X-ray photoelectron spectra (XPS) were obtained on a AXIS Ultra DLD spectrometer with an exciting source of MgKα (1486.6 eV). Elemental analysis was performed by an Elementar Vario Macro EL Cube microanalyzer. Fourier transform infrared (FT-IR) spectroscopy was carried out using a Bruker Vertex70 spectrometer over the wavenumber range of 4000–400 cm−1. X-ray diffraction (XRD) patterns were obtained on a X-ray diffractometer (XRD, Bruker D8) with Cu Kα radiation (λ = 0.15406 nm). The structural variation of the samples were identified by using a laser confocal Raman spectrometer (Nanofinder 3.0 Raman spectrometer, Tokyo Instrument, 488 nm). The electrical conductivity (σ) of the NPCs was tested by the four-point probe method on a four-point probe meter (RTS-8, Guangzhou, China) at room temperature. A round HPC tablet was fabricated by pressing (∼20 MPa) 50 mg of the NPC powders by a tablet compression machine. The thickness and diameter of the round tablet were tested using a vernier caliper.

2.3 Electrochemical measurement

The working electrode was fabricated by mixing the NPC material (90 wt%) with poly(tetrafluoroethylene) (PTFE, 10 wt%) binder to form a slurry. After well mixed, the slurries were coated onto the nickel foams and dried in a vacuum oven at 80 °C for 24 h. The mixture was pressed on a nickel foam current collector at a pressure of 10 MPa with the ratio of the mass and the area at 5–7 mg cm−2. Electrochemical measurements were performed using a three-electrode system and a two-electrode system, respectively. In a three-electrode system, platinum wire and Hg/HgO electrode were used as the counter and reference electrode, respectively. All of the electrochemical measurements including cyclic voltammetry (CV), galvanostatic charge–discharge (GCD), and electrochemical impedance spectroscopy (EIS) were performed on the electrochemical workstation CHI660C instrument (Shanghai Chenhua Apparatus Co. Ltd.) under ambient condition. The specific gravimetric capacitance (Cg, F g−1) calculated from galvanostatic charge–discharge cycling experiments are calculated by the following equation:
image file: c4ra13637c-t1.tif
where i is the constant discharging current (A), Δt is the discharge time (s), ΔV is the voltage window (in present work, ΔV = 0.9 V), and m is the mass of active materials (g).

2.4 CO2 sorption measurement

The CO2 and N2 adsorption isotherms were performed on an automated gas sorption analyzer (Quantachrome Autosorb-1, USA) via conventional volumetric technique at 0 and 25 °C, respectively. All sample were degassed at 150 °C for at least 2 h before adsorption measurement. To investigate the recyclability of the NPCs for CO2 capture, the sample was regenerated by evacuating at 150 °C for 2 h in vacuum and after that four successive runs of adsorption isotherms were recorded.

3 Results and discussion

3.1 Preparation of PBZ-based NPCs

Fig. 1a illustrates the synthesis route for NPCs. A novel precursor, the bifunctional benzoxazine with nitrile functionality, was synthesized from 4-cyanophenol, melamine and formaldehyde by the Mannich condensation reaction via a solution method.22,24 The benzoxazine monomers were then converted into PBZs through thermally activated ring-opening polymerization reactions. The evolutions of the nitrile functionalities and the benzoxazine ring in PBZs were characterized by FT-IR spectroscopy (Fig. 1b). The broad peaks at about 3380 cm−1 for the monomer, PBZ cured at 180 and 250 °C belong to the O–H or N–H stretching mode of the phenolic hydroxyl group and amine group. The characteristic peaks at 930 cm−1 (out of plane-bending vibrations of C–H), 1230 cm−1 (asymmetric stretching of C–O–C), 1030 cm−1 (symmetric stretching of C–O–C), 1081 cm−1 (asymmetric stretching of C–N–C), 1340 cm−1 (CH2 wagging), and 1470–1600 cm−1 (benzene ring) correspond to benzoxazine structure, respectively.31 These characteristic absorption peaks gradually decreased with the increase of cuing temperature from 180 to 250 °C, indicating the increase of the extent of the ring-opening of the monomer at higher temperature. The peaks at 2230 cm−1 for the monomer, PBZ cured at 180 and 250 °C are assigned to the cyano group, which also decreased evidently with the increase of the curing temperature, implying the gradually disappearance of cyano group at elevated polymerization temperature. Besides, the characteristic peaks at 1548 cm−1 (quadrant stretch), sharp peaks at 808 cm−1 (out-of-plane ring bending by sextants) for the monomer and PBZs, which belongs to the triazine, became stronger with the increase of curing temperature, probably due to the transformation of certain amount of cyano groups into triazine.32 These results prove the formation of a novel nitrile-functional benzoxazine and corresponding PBZ. It reveals that during the curing procedure, not only benzoxazine monomers took place ring-opening polymerization reaction to form oxazine-rings, but also the reactive cyano groups could be further transformed into triazine rings, which resulted in an extended 2D-framework to improve the cross-linking density of the PBZs.22 Therefore, such PBZ-based NPCs exhibit high char yield (more than 39.9 wt% as shown in Table 1) and high nitrogen content (see Table S1, ESI) after thermal treatment. In order to develop mesopores of the NPCs, the soft-templating agent (surfactant F127) were introduced into low molecule weight benzoxazine solution to form mesostructure via the interaction of hydrogen bonds between PEO segments of F127 and O, N species of benzoxazines after solvent evaporation.29,33 The mesopores were created after carbonization process, resulting from the decomposition of surfactant F127 at 600 °C. Finally, KOH activation method under mild activation conditions (in a low weight ratio of KOH–precursor = 2[thin space (1/6-em)]:[thin space (1/6-em)]1 for 1 h) was utilized to improve its microporosity.
image file: c4ra13637c-f1.tif
Fig. 1 (a) Synthetic scheme for the NPCs and schematic representation of the N, O functionalities in the NPCs, (b) FT-IR spectra of benzoxianze monomer, PBZ cured at 180 and 250 °C, and NPC-0–NPC-3.
Table 1 Yields and the textural characteristics of the NPCs
Sample Yielda (wt%) SBET (m2 g−1) Smicro (m2 g−1) Vtotal (cm3 g−1) Vmicro (cm3 g−1) Vmicro/Vtotal (%)
a Yield (wt%) = (dry NPCs mass/precursor PBZs mass) × 100.
NPC-c 79.6 127.4 74.9 0.13 0.07 53.8
NPC-0 68.0 1232.5 1067.6 0.46 0.44 95.7
NPC-1 54.7 1254.9 956.9 0.57 0.43 75.4
NPC-2 46.7 2036.3 1589.6 0.95 0.69 72.6
NPC-3 39.9 2267.3 1577.1 1.05 0.72 68.6


3.2 Morphology

The typical SEM images of all NPCs are shown in Fig. 2. NPC-c exhibits rough surface (Fig. 2a), which is considered to be liable to be activated by the activating agent KOH. NPC-0 has a smooth surface with no obvious pores or cavities (Fig. 2b). But several cavities can be found on the surface of NPC-1 (Fig. 2c). The difference of morphologies between NPC-0 and NPC-1 can only be attributed to the introduction of the soft-templating agent. The mesopores derived from decomposition of surfactant F127 in NPC-1 provided more accessible surface to react with KOH, which leaded to the formation of cavities on its surface. The surface became rough for NPC-2 (Fig. 2d) and more cavities could be found on its surface. It was probably caused by the violent etching of the carbon surface by KOH-activation at high activation temperature. As the activation temperature increased from 700 to 800 °C, more cavities were formed on the surface of the NPC-3, and there was an enlargement of the size of the cavities from about a few micrometers to several hundreds of micrometers (Fig. 2e). The presence of abundant voids for NPC-2 and NPC-3 might offer sufficient reservoirs for electrolyte, which was desirable for the carbon-based electrode.
image file: c4ra13637c-f2.tif
Fig. 2 SEM images of the NPCs: (a) NPC-c, (b) NPC-0, (c) NPC-1, (d) NPC-2, and (e) NPC-3.

3.3 Structure and composition of NPCs

The structure of the NPCs was studied by the XRD technique (Fig. 3). Two broad diffraction peaks appear at 2θ = 24° and 44° for NPC-c, NPC-0 and NPC-1, which correspond to the typical (002) and (10) diffractions of the hexagonal graphitic carbon with the amorphous character, respectively.34 The XRD patterns of NPC-2 and NPC-3 exhibit only one broaden diffraction peak centered at 44°, corresponding to the (10) diffractions of graphitic carbon. In addition, considerable intensity of NPC-2 and NPC-3 in the low-angle scatter implies the existence of abundant pores.35 The slightly higher intensity of NPC-3 reveals a higher graphitization degree than that of NPC-2, due to fewer heteroatoms in the carbon matrix at higher activation temperature. The local graphitic structure of the NPCs were also demonstrated by Raman spectroscopy. As shown in Fig. 3b, two peaks at 1600 and 1350 cm−1 could be observed in the Raman spectra of all NPCs. The peak at 1600 cm−1 (G band) is attributed to the vibration of sp2-bonded carbon atoms in a 2D hexagonal lattice, which is associated with the (002) diffraction peak in the XRD pattern. The peak at 1350 cm−1 (D bands) is related to the defects and disordered structures in carbon materials.5 The intensity ratio of the D-band to G-band (ID/IG) depends on the type of graphitic materials and reflects the degree of graphitization of the materials. The values of ID/IG for NPC-c, NPC-0–NPC-3 are 1.01, 0.96, 0.92, 0.86, and 0.83, respectively. It indicates that the degree of graphitization of the NPCs increases in the order of NPC-3 > NPC-2 > NPC-1 > NPC-0 > NPC-c. It further suggest that the degree of graphitization for NPC-1–NPC-3 becomes higher with the increase of activation temperature, which is well in agreement with the XRD data.
image file: c4ra13637c-f3.tif
Fig. 3 (a) XRD patterns and (b) Raman spectra of the NPCs.

The specific surface area and porous structure of NPCs were analyzed by nitrogen sorption technique. The nitrogen adsorption–desorption isotherms are shown in Fig. 4a. It can be seen that the N2 sorption isotherm for the carbonized sample NPC-c was type IV isotherm with an H4-type hysteresis loops at medium relative pressure from p/p0 = 0.5 to p/p0 = 0.8, according to the IUPAC classification, which denotes the presence of mesoporosity. Furthermore, the DFT pore size distribution for NPC-c clearly reveals the formation of mesopores of size about 2.1 nm (Fig. 4b). The isotherm for NPC-0 is type I, indicative of typical microporous carbon material with no mesopores. Thus, it demonstrates the successfully synthesis of polybenzoxazine-based mesoporous carbon NPC-c by a soft-templating method. The isotherms for NPC-1–NPC-3 are type IV with obvious H4-type hysteresis loops at p/p0 > 0.5, indicating the existence of mesopores.36 Moreover, the steep increase in the adsorbed volume at low relative pressures (p/p0 < 0.1) for KOH-activated samples NPC-0–NPC-3 implies the existence of a large amount of micropores. A abrupt increase in the amount of adsorbed N2 at high relative pressure approaching to 1.0 for NPC-1–NPC-3 can be ascribed to the N2 adsorption in the macropores. Table 1 provides details of the textual characteristics of the NPCs. Compared with the carbonized sample NPC-c, the KOH-activated samples NPC-0–NPC-3 show much higher N2 sorption capacities, BET surface area, and pore volume, indicating the high efficiency of chemical activation in developing the microporosities. NPC-0 and NPC-1 have similar surface area (Table 1), but different pore structure (see Fig. 4b): NPC-0 possesses abundant micropores in the narrow size range of 0.8–1.1 nm, but NPC-1 contains a large fraction of micropores and newly developed mesopores in the size range of 2.3–2.5 nm. Remarkably, the concentration of surfactant F127 for the synthesis of NPC-1 is limited, which resulted in the low mesoporosity. Thus, few mesopores in NPC-1 makes little contribution to the enhancement of surface area and pore volume, in comparison with NPC-0. In addition, as the activation temperature increased from 600 to 800 °C, the total surface area, total pore volume, and micropore pore volume of NPC-1–NPC-3 increased rapidly. It can be ascribed to the different mechanism at different activation temperature. The well-developed pore structure of NPC-1, which was activated by KOH at 600 °C, was obtained from the redox reaction between carbon and KOH as shown in eqn (1).19

 
6KOH + 2C → 2K + 3H2 + 2K2CO3 (1)


image file: c4ra13637c-f4.tif
Fig. 4 (a) N2 adsorption isotherms and (b) DFT pore size distributions for the NPCs.

However, when the activation temperature increased from 600 to 700 or 800 °C, K2CO3 started to decompose to K2O and CO2. The carbonized precursor of NPC-2 and NPC-3 was further activated by CO2 (physical activation, the gasification of the carbon with CO2) and K compounds (chemical activation, redox reactions between carbons and KO, K2CO3) above 700 °C,19 which could produce additional, abundant micropores and the great increase of micropore area and micropore volume, in comparison with NPC-1 (see Table 1). The decrease of the yield of the NPC1–NPC-3 with the increase of activation temperature also confirm the above mechanism.

Furthermore, the size of the mesopore was also gradually enlarged from 2.45 (for NPC-1), 2.73 (for NPC-2) to 2.95 nm for NPC-3 (Fig. 4b), due to stronger activation condition (a higher activation temperature).37 Besides, NPC-1–NPC-3 also possess weak PSD peaks at about 100.6, 108.6 and 136.7 nm (Fig. 4b), respectively, indicating the existence of few macropores, which is consistent with results obtained from the N2 sorption isotherms. In a word, the mesoporous carbon NPC-c exhibits poor pore structure, NPC-0 is a typical microporous carbon, and NPC-1–NPC-3 possess abundant, well-developed micropores, some small mesopores and a little macropores. It reveals that the pore structure of PBZ-based NPCs can be easily adjusted by changing the activation temperature or introducing a soft-templating agent.

The surface functionalities of the NPCs were analyzed by means of FT-IR spectroscopy (Fig. 1b). The broad band at 3460 cm−1 for NPC-0–NPC-3 is assigned to the N–H or O–H stretching. and the strong band at 1622 cm−1 is ascribed to the N–H in-plane deformation vibrations. The broad medium-strong peaks at about 950 and 650 cm−1 are assigned to out-of-plane N–H deformation vibration. In addition, the intensity of the C–N bond gradually decreased with the elevated activation temperature. It indicates the loss of N species, which is consistent with the elemental analysis results. The broad peaks at 1017 cm−1 are assigned to the C–O groups in phenols or ethers. The strong peak at about 1383 cm−1 is probably ascribed to the C[double bond, length as m-dash]C or C[double bond, length as m-dash]O stretching vibration. Thus, the FT-IR results confirm the existence of the nitrogen and oxygen functionalities in the NPCs.

The chemical compositions of the NPCs were further determined by using a CHN elemental analyzer and the results are shown in Table S1 (ESI). The nitrogen content for the carbonized sample NPC-c reaches as high as 5.47 wt%, and the nitrogen content for the KOH-activated samples NPC-0–NPC-3 still retained 2.33 to 5.32 wt%. Besides, all NPCs also contain high oxygen content in range of 10.26 to 14.22 wt%. Such high nitrogen and oxygen contents can only derive from the presence of the large amount of nitrogen and oxygen functionalities in the PBZs (see Fig. 1a), which are considered to effectively enhance the hydrophilicity and wettability of the NPCs in aqueous electrolytes. Compared with NPC-c, the loss of nitrogen species and the increase of the oxygen species for NPC-0 can be attributed to the results of the KOH activation. However, the introduction of triblock copolymer F127 resulted in the maintenance of the nitrogen species in comparison with NPC-c, mainly due to the slightly loss of the carbon and oxygen species during the carbonization and activation process. In detail, the presence of large number of oxygen-rich surfactant F127 in the surfactant/PBZ composite probably leaded to the more easily decomposition of the carbon and oxygen species in the precursor during carbonization, resulting in the formation of gaseous products (such as CO and CO2). Thus, NPC-1 could retain more nitrogen content than that of NPC-0. Noticeably, the nitrogen and oxygen contents for NPC-1–NPC-3 decreased evidently with the enhancement of the activation temperature, due to the volatilization of the nitrogen and oxygen species at elevated activation temperature.

The nature of the nitrogen and oxygen species at the surface of the NPCs are further investigated by the XPS spectra (Fig. 5). The surface nitrogen and oxygen contents for all NPCs show a similar trend as the elemental analysis results. The XPS spectra of the N 1s orbital display four peaks at 398.4, 400.2, 401.0, and 403.0 eV for all NPCs (Fig. 5a–e), which can be attributed to the pyridine-N (N-6), pyrrole-N or pyridone-N (N-5), quaternary-N (N-Q) and pyridine-N-oxide (N-X),5,38 respectively (see Fig. 1a). Content of each nitrogen component are shown in Table S2 (ESI). It can be found that the introduction of the soft-templating agent for NPC-1 resulted in the increase of N-5 and N-Q contents, but the obvious decrease of N-X content, in comparison with NPC-0. It further confirmed the conclusion obtained from the elemental results: the decomposition of the oxygen species for NPC-1 in the presence of oxygen-rich surfactant F127. In addition, the surface nitrogen contents and the ratios of N-6 and N-5 decreased distinctly with raising the activation temperature, which is in accordance with the elemental analysis results. However, the ratios of N-Q for NPC-1–NPC-3 at higher temperature increased from 11.37%, 19.47 at% to 23.45 at%, due to better thermal stability for N-Q than that of other nitrogen functionalities.39 It has been reported that only N-6 and N-5 are electrochemically active for pseudo-capacitance effect in an alkaline aqueous electrolyte, which participate in the reversible pseudofaradaic redox reactions.9,10,40 In addition, N-6, which neighbours two carbon atoms in a graphitic sp2 network, displays the strong hydrogen bond interactions with the surrounding C–H bonds.41 For pyridonic-N, the p orbital in its –OH can produce p–π conjunction effect with its π bond, resulting in the enhancement of its Lewis basicity.42 Therefore, N-6 and pyridonic-N in N-5 exhibit stronger Lewis basicity than other types of nitrogen functionalities, and they also play a key role in enhancing CO2 adsorption capacity. Remarkably, N-6 and N-5 accounts for more than 73 at% of the total nitrogen species for all samples. It can be inferred that such N-5 and N-6 rich NPCs are desirable candidates for high-performance electrode and CO2 capture. Furthermore, the O 1s spectral curves can be resolved into five oxygen functional groups with fixed energy positions centered at 531.3, 532.3, 533.3, 534.2, and 535.9 eV (Fig. 5f–j), which are assigned to the species of quinone, C[double bond, length as m-dash]O, C–O, C–OH, and adsorbed H2O, respectively.43 It is well-known that quinone and C–O groups in the carbon matrix are not electrochemically active in the reversible redox reactions in an alkaline medium.41 Instead, the reduction of phenolic hydroxyl C–OH and the deprotonation of the carboxyl C[double bond, length as m-dash]O exhibited quasi-reversible pseudocapacitances.42,44 Fortunately, the percentage of the C–OH and C[double bond, length as m-dash]O exceed as high as 47.8% of the total O species for all samples, which will also make a great contribution to the total capacitance of the NPC electrodes.


image file: c4ra13637c-f5.tif
Fig. 5 XPS spectra of all samples: N 1s spectra of (a) NPC-c, (b) NPC-0, (c) NPC-1, (d) NPC-2, and (e) NPC-3, and O 1s spectra of (f) NPC-c, (g) NPC-0, (h) NPC-1, (i) NPC-2, and (j) NPC-3.

Table 2 lists the electrical conductivity of the NPCs. It can be seen that the electrical conductivity σ values for NPC-c, NPC-0–NPC-3 are 2.96, 3.07, 3.39, 3.44, and 3.58, respectively, which are much higher than that of many activated carbons and ordered mesoporous carbons without incorporating any heteroatoms (0.2–2 S cm−1).45 It can be attributed to the local graphite-like microstructure and large amount of N, O species in the carbon network.46 The electrical conductivity enhance evidently with the increase of N-Q content (see Table S2, ESI) for NPC-0–NPC-2. N-Q are inset into the carbon matrix and bonded to three carbon atoms (see Scheme 1), which can effectively improve the conductivity of carbonaceous materials.47 Thus, the higher content of N-Q, the better electrical conductivity of the carbon materials. However, NPC-3 with lower N-Q content still shows the highest electrical conductivity than other samples, mainly resulting form its highest degree of graphitization.

Table 2 The conductivity, electrochemical properties and CO2 uptakes at 1 bar of the NPCs
Sample σ (S cm−1) Cg (F g−1) Cg/SBET (μF cm−2) CO2 uptake (mmol g−1)
1 A g−1 40 A g−1 1 A g−1 40 A g−1 0 °C 25 °C
NPC-c 2.96 69.6 54.7 2.60 1.79
NPC-0 3.07 303.1 128.0 24.6 10.4 5.47 3.65
NPC-1 3.39 338.2 182.4 27.0 14.5 6.20 3.95
NPC-2 3.44 362.4 199.6 17.8 9.80 5.11 3.38
NPC-3 3.58 285.6 184.1 12.6 8.12 4.15 2.96


image file: c4ra13637c-s1.tif
Scheme 1

3.4 Electrochemical performance

Fig. 6 shows the CV curves of NPC-c, NPC-0–NPC-3 electrodes at different scan rates from 5 to 200 mV s−1. The CV curves at all scan rates for NPC-c electrode exhibit severely distorted rectangular shapes, indicating poor capacitor behaviors, because of its low porosity and surface area. The CV curves for NPC-0–NPC-3 electrodes at low scan rates of 5 and 50 mV s−1 (Fig. 6a and b) show ideal rectangular shapes as well as small, broad oxidation and reduction peaks, resulting from the co-contribution of EDLC arising from charge separation at the electrode/electrolyte interface and pseudo-capacitance arsing from Faradaic reactions of the N, O functionalities in the carbon matrix.12,14 In detail, the NPC-2 electrode shows the largest rectangular curve corresponding to the highest capacitance among the five samples. However, at high scan rates of 100 and 200 mV s−1 (Fig. 6c and d), CV curves for NPC-2 and NPC-3 electrodes still maintain roughly rectangular-like shapes, but NPC-0 electrode and NPC-1 electrode exhibit distorted CV shapes due to increased electrical resistance.48 It indicates that NPC-2 and NPC-3 have much better ionic accessibility and smaller resistance within the electrode than that of NPC-0, which are beneficial for quick charge–discharge operations.44 Moreover, the degree of deviation from ideal rectangular shape for NPC-0 electrode is more significant than that of NPC-1 electrode. It can be ascribed to the difference of the pore structure of the NPCs. NPC-1 possesses few mesopores and more cavities on its carbon surface, which facilitate the fast penetration of the electrolyte through the pore channels, and decrease the diffusion resistance, especially at high scan rates.49 However, NPC-0 is a typical microporous carbon material and its pore size distribution peak is centered in the range of 0.8–1.1 nm, which limits the accessibility of the surface, and results in large electrical resistance. It further confirms the importance of presence of mesopores in porous carbons as high performance electrode materials.2,7
image file: c4ra13637c-f6.tif
Fig. 6 CV curves for NPC-c, NPC-0, NPC-1, NPC-2, and NPC-3 electrodes at scan rates of (a) 5, (b) 50, (c) 100, and (d) 200 mV s−1.

Fig. 7a presents the GCD curves of all NPCs electrodes at a current density of 1.0 A g−1. All curves are shaped like an arc line with no obvious IR drop, due to the pseudo-faradic reactions during the charge–discharge processes. It can be seen that NPC-2 electrode shows the largest discharge time, but NPC-0, NPC-1 and NPC-3 electrodes show slightly reduced discharge time. It indicates that NPC-2 electrode provides the largest specific capacitance (362.4 F g−1), which agrees with the trend obtained from CV results. The specific gravimetric capacitances Cg and the surface area normalized capacitances Cg/SBET calculated from the GCD curves (Fig. 7a and c) are listed in Table 2. It reveals that the capacitances per surface area at 1 A g−1 for NPC-c, NPC-0, and NPC-1 electrodes reach up to 54.7, 24.6, and 27.0 μF cm−2, which are much higher than the theoretical EDLC capacitance of the carbon-based materials (10–20 μF cm−2).3 It further indicates the existence of large pseudo-capacitance arsing from nitrogen and oxygen functionalities in the NPCs.


image file: c4ra13637c-f7.tif
Fig. 7 GCD curves at current densities of (a) 1 and (b) 10 A g−1; (c) the specific gravimetric capacitance as a function of discharge current density; (d) Nyquist plot and inset image shows the data of high frequency range.

Even when the current density increases to 10 A g−1 (Fig. 7b), the GCD curves for NPC-1–NPC-3 electrodes retain as a linear-like shape with high capacitance retention of up to 244.4, 260.7 and 218.4, respectively, indicating excellent electrochemical reversibility and capacitive performance. As the activation temperature increased, the internal resistance drop (IR drop) for NPC-1–NPC-3 became smaller. It can be attributed to the wider pore size and larger fractions of macro-/mesopores, resulting from KOH corrosion at higher temperature. Furthermore, it can be seen that there is the greatest IR drop from −0.2 to 0 V for NPC-0 among the four KOH activated samples at 10 A g−1, indicating the largest internal resistance and poor rate capability for NPC-0 electrode.50 These observations are in good agreement with the distorted shapes of CV curves of all samples at high scan rate.

In order to further investigate the contribution of pseudo-capacitance by nitrogen and oxygen functionalities to the total specific gravimetric capacitance, the discharge curve can be divided into two parts due to the different extent of inflection at about −0.2 V in the GCD curve. The extended lines of the linear parts were draw in Fig. 8 to calculate pseudo-capacitance in 6 M KOH aqueous solution. ΔTD stands for the discharge time of the EDL, and ΔTT stands for the total discharge time of the overall capacitance.10 Therefore, the pseudo-capacitance calculated from (ΔTTTD) of NPC-0, NPC-1, NPC-2 and NPC-3 electrodes are 178.1, 193.0, 160.2, and 96.8 F g−1 at 1 A g−1, which accounts for about 58.8, 57.1, 44.2 and 33.9% of the corresponding total capacitances, respectively. It confirms the pronounced contribution of pseudo-capacitance for the NPC electrodes.


image file: c4ra13637c-f8.tif
Fig. 8 Discharge time of the pseudocapacitance parts of (a) NPC-0, (b) NPC-1, (c) NPC-2, and (d) NPC-3 at 1 A g−1.

Rate capability is an important factor for high-performance supercapacitors. Fig. 7c exhibits the specific gravimetric capacitances at different current densities for all samples. The capacitances for NPC-1–NPC-3 electrodes decrease slowly as the current density increases, indicating a quick charge–discharge propagation capability and outstanding rate capability.51 However, the capacitances for NPC-c and NPC-0 electrodes drop evidently with the increase of current density, which shows poor rate capability. Notably, the NPC-1 electrode gives larger specific gravimetric capacitances at all current densities, and shows better capacitance retention performance than that of NPC-0 electrode. Two factors may lead to this result: firstly, NPC-1 possesses much higher N-5 and N-6 content and slightly lower O content than that of NPC-0, which provides a larger additional pseudo-capacitance; secondly, the presence of mesopores in NPC-1 favor the charge transfer process and fast diffusion of electrolyte ions during the GCD operation at high current densities.52 In addition, NPC-2 electrode exhibits the largest capacitance at all current densities in comparison with other four samples. The specific gravimetric capacity of NPC-2 electrode at 10, 20, 40 A g−1 still preserves very high capacitances of 296.1, 260.7 and 199.6, respectively, which corresponds to the capacitance retention of 81.7, 71.9 and 55.0% of the value at 1 A g−1. It is noteworthy that the specific gravimetric capacitance value (362.4 F g−1 at 1 A g−1) obtained for NPC-2 is much higher than many nitrogen-containing porous carbon materials as shown in Table S3 (ESI). Such high specific gravimetric capacitance and good rate capability for NPC-2 can be attributed to the following three factors: firstly, its high surface area, large pore volume, and good electrical conductivity, which ensures the high capacitance of EDLC; secondly, appropriate pore size distribution with micro/mesoporous structure, which is beneficial for rapid electrolyte ions transport through the pore channels, more electrochemically, accessible surface for charge accumulation, and better utilization of the active material; thirdly, large amount of electrochemically, active surface N-6, N-5, C–OH, and C[double bond, length as m-dash]O functionalities in the carbon framework, which generate pronounced pseudo-capacitance in an alkaline electrolyte solution by participating in reversible redox reactions.

EIS reveals the internal resistance, charge transfer in the electrode material and electrolyte, and the resistance between the electrode and electrolyte.53 Fig. 7d shows the Nyquist plots of the five electrode materials. Nyquist plots for all samples consist of one small semicircle in the high frequency region, a linear part with an angle of 45° in medium frequency region and nearly vertical line at low frequency region. The internal resistance of the electrode can be obtained by taking the interception of the curve to the real component Z′ axis.54 Thus, the internal resistances of NPC-c, NPC-0, NPC-1, NPC-2, and NPC-3 electrodes are 0.76, 0.80, 0.56, 0.55, and 0.51 Ω, respectively, indicating that NPC-1, NPC-2 and NPC-3 electrodes possess much better electrical conductivity in comparison with NPC-0. These results conform with the electrical conductivity of the NPCs obtained by the four-probe method. The presence of small semicircles can be attributed to the interface resistance of the electrode and current collectors and the resistance between active material particles.55 With the increase of activation temperature, the shortened sloping ling at high frequency indicates lower diffusion resistance, probably due to the widened pore size for NPC-2 and NPC-3. Compared with NPC-0 electrode, the sloping line for NPC-1 electrode becomes shortened obviously, resulting from more accessible pores for NPC-1. These results are consistent with the results from the GCD curves. The NPC-2 and NPC-3 electrodes exhibit an almost vertical line at low frequency region, implying outstanding capacitive behaviour with low Warburg resistance.39 These results confirm the importance of developing hierarchical pore structure with certain amount of meso-/macropores in porous carbon materials as high-rate supercapacitor electrodes to lower the diffusion resistance and improve the surface accessibility for fast electrolyte ion transfer.

In addition, the cycling stability of the four NPCs electrode was investigated by using the continuous charge–discharge experiment at a current density of 10 A g−1. Fig. 9 shows that almost no obvious decay was observed after 5000 cycles for the four NPCs electrodes at 10 A g−1. About 88.7, 92.2, 94.7, and 95.9% of the initial specific gravimetric capacitances for NPC-0–NPC-3 are still retained, respectively. This demonstrates that all NPCs exhibit excellent long-term stability, probably due to the highly chemical stable surface functionalities strongly bonding with the carbon, and the fully reversible Faradaic redox reactions during cycling process.40,56


image file: c4ra13637c-f9.tif
Fig. 9 The variation of the specific gravimetric capacitance with the cycle number for the four NPCs electrodes at a current density of 10 A g−1.

3.5 CO2 capture performance

The NPCs were also evaluated as adsorbents for CO2 capture. Fig. 10a and b show the equilibrium CO2 isotherms at 0 and 25 °C, respectively. Table 2 summarizes the CO2 uptakes of the NPCs. It can be found that at 1 bar, the CO2 uptakes for the carbonized sample NPC-c are 2.60 and 1.79 mmol g−1 at 0 and 25 °C, respectively. Such high CO2 uptake for NPC-c with low porosity can be ascribed to the existence of the highest nitrogen content, which effectively promote the adsorption of acidic CO2 gas. Remarkably, the CO2 uptakes for the KOH-activated samples NPC-0–NPC-3 dramatically increase in comparison with the NPC-c, which are in the range of 4.15–6.20 and 2.96–3.95 mmol g−1 at 0 and 25 °C, respectively. In detail, compared with NPC-0, the CO2 uptakes at 0 and 25 °C for NPC-1, which possesses similar surface area and pore volume, increased by 13.4 and 8.2%, respectively. It can be attributed to higher contents of basic N-6, N-5 functionalities for NPC-1 than that of NPC-0, which effectively enhances the CO2 adsorption capacity at ambient pressure. In addition, the larger fraction of mesopores for NPC-1 makes the micropore surface more accessible, and improves the adequate utilization of active adsorption sites, which is also beneficial for the enhancement of CO2 uptakes. Furthermore, the CO2 uptakes for NPC-1–NPC-3 at 0 and 25 °C decreased evidently with the increase of activation temperature. There are two reasons for this phenomenon: the inappropriate pore structure for the NPC-2 and NPC-3. Although NPC-2 and NPC-3 has high surface area and well-developed pore structure, the micropores of NPC-2 and NPC-3 were broadened at high activation temperature in comparison with NPC-1, resulting in the formation of abundant large-sized micropores (about 1.8 and 1.9 nm for NPC-2 and NPC-2, respectively, as shown in Fig. 4b). Therefore, they possess wide micropore PSDs and low fractions of micropores (Table 1). However, such wide micropore structure have a negative impact on the CO2 adsorption performance, owing to the weak adsorption potential between the CO2 molecules and the micropores in the NPCs. Secondly, thermal treatment at higher temperature also resulted in lower nitrogen content as shown in Table S1 (ESI). The loss of basic N-6, N-5 functionalities in the carbon framework for NPC-2 and NPC-3 leaded to the weakened affinity between the NPCs and the acidic CO2 molecules via the acid–base reactions,57 resulting in lower CO2 adsorption capacity. It is noticeable that the CO2 uptake reaches the maximum value of 3.95 and 6.20 mmol g−1 at 0 and 25 °C for material NPC-1 activated at 600 °C, respectively. Such high CO2 uptake is comparable to, or higher than that of many nitrogen-containing porous carbon materials, such as N-doped porous carbons from nitrogen-containing polymers,16,17,19 N-doped activated carbon from a biomass waste,18 and N-doped porous carbons from polypyrrole functionalized graphene sheets.20 It is reported that micropores with pore size below 1.5 nm which afford a high adsorption potential are beneficial for CO2 adsorption.58 Thus, the micropore structure of the porous carbon materials plays a significant role on the CO2 uptake at ambient or low pressure. Remarkably, the pore size distribution of NPC-1 mainly lies in the narrow range of 0.70–1.13 nm. Thus, the highest CO2 uptake for NPC-1 among the four NPCs can be attributed to its high micropore surface area, large micropore pore volume, appropriate pore structure, and highest basic nitrogen content. Moreover, the CO2 adsorption capacities for all samples decreased with the increase of adsorption temperature from 0 to 25 °C, indicating the adsorption process was an exothermic process.59
image file: c4ra13637c-f10.tif
Fig. 10 CO2 adsorption isotherms of the NPCs at (a) 0 and (b) 25 °C. (c) Isosteric heat of CO2 adsorption (Qst) for the NPCs as a function of CO2 uptake, (d) CO2 multicircle adsorption isotherms (filled symbols) and N2 adsorption isotherm (open symbols) for NPC-1 at 25 °C.

In order to determine the strength of the interactions between CO2 molecules and the surface of NPCs, the isosteric heat of CO2 adsorption (Qst) was calculated using CO2 adsorption isotherms at 0 and 25 °C based on Clausius–Clapeyron equation (Fig. 10c).1 The Qst values for all samples are exhibited in Fig. 1. The isosteric heat of adsorption of CO2 on all samples lies in the range 19–51 kJ mol−1 with the CO2 uptakes varying from 0.1 to 3.7 mmol g−1, which are higher than those previously reported for various nitrogen-containing porous carbons (see Table S4, ESI). Such high isosteric heat can be attributed to the strong acid–base interaction between basic N-6 and N-5 functionalities and acidic CO2 molecules. It is remarkable that the initial Qst values at low CO2 uptake decreased evidently with the decrease of nitrogen contents for all NPCs. It confirms that the importance of the presence of nitrogen functionalities in enhancing the CO2 uptake. In addition, as the CO2 uptakes exceeded 2.0 mmol g−1, the Qst values for NPC-c decreased significantly to 19 kJ mol−1, indicating the weak interaction between CO2 and the carbon host. The decrease of the Qst values at higher CO2 uptake could be attributed to the fewer accessible, unoccupied sites for the CO2 adsorption at a higher CO2 uptake. But even at a high coverage (3.0 mmol g−1), four KOH-activated samples NPC-0–NPC-3 still retained high Qst values, about 25.3, 26.0, 23.7, and 22.5 kJ mol−1, respectively. It can be ascribed to the well-developed micropore structure and narrow microporosity for NPC-0–NPC-3, in comparison with the carbonized sample NPC-c.

The CO2/N2 selectivity of NPC-1 was studied by the ideal adsorption solution theory (IAST) that predicts mixture gas adsorption equilibriums based on single component adsorption isotherms.16 Fig. 10d exhibits that the single component N2 and CO2 isotherms at 25 °C. It can be seen that N2 uptake at 25 °C for NPC-1 is much lower than that of CO2 under the same testing conditions. The adsorption capacity is only 0.29 mmol g−1 for N2, but 3.95 mmol g−1 for CO2 at 1 bar. The initial slopes for N2 and CO2 isotherms are calculated to be 0.30 and 9.52, respectively. Thus, the adsorption selectivity of CO2 over N2 for NPC-1 is 32.0 at 25 °C, which is comparable to, or higher than those previously reported values of nitrogen-doped hollow carbon nanospheres,60 porous carbon monoliths,61 and N-doped microporous carbons.62 It implies that NPC-1 has a high selectivity for CO2/N2 separation. Fig. 10c also shows the recyclability of NPC-1 tested by means of CO2 adsorption–desorption cycles at 25 °C. Noticeably, there is a negligible drop in CO2 adsorption capacity after 5 cycles. This demonstrates that NPC-1 possesses outstanding recyclability, and it can be easily regenerated.

4 Conclusions

Nitrogen-containing porous carbons have been successfully fabricated from a novel polybenzoxazine by a soft-templating method and KOH chemical activation method. Compared with microporous carbon material NPC-0, NPC1 and NPC-2 with micro-/mesopore structure exhibited improved capacitive performances. It can be attributed to their high surface area, appropriate pore size distribution, good electrical conductivity, and the presence of N, O functionalities in the carbon matrix. The material NPC-2 exhibits the highest specific gravimetric capacitance (362.4 F g−1 at 1 A g−1) with a high rate capability and electrochemical stability. High CO2 uptakes of 6.20 and 3.95 mmol g−1 at 1 bar were achieved for sample NPC-1 at 0 and 25 °C, respectively. It reveals that such nitrogen-containing porous carbons with well-developed pore structure, high nitrogen content, and good conductivity are promising electrode materials for supercapacitors and superior adsorbents for CO2 capture.

Acknowledgements

This work is supported by the National Natural Science Foundation of China (no. 51002166, 51172251, and 51061130536) and Shanxi Province Coal-Based Key Scientific and Technological Project (no. MD2014-09).

Notes and references

  1. K. N. Wood, R. O. Hayre and S. Pylypenko, Energy Environ. Sci., 2014, 7, 1212–1249 CAS.
  2. L. Estevez, R. Dua, N. Bhandari, A. Ramanujapuram, P. Wang and E. P. Giannelis, Energy Environ. Sci., 2013, 6, 1785–1790 CAS.
  3. Y. P. Zhai, Y. Q. Dou, D. Y. Zhao, P. F. Fulvio, R. T. Mayes and S. Dai, Adv. Mater., 2011, 23, 4828–4850 CrossRef CAS PubMed.
  4. L. Wang and R. T. Yang, J. Phys. Chem. C, 2012, 116, 1099–1106 CAS.
  5. Y. Tan, C. Xu, G. Chen, Z. Liu, M. Ma, Q. Xie, N. Zheng and S. Yao, ACS Appl. Mater. Interfaces, 2013, 5, 2241–2248 CAS.
  6. J. A. Thote, K. S. Iyer, R. Chatti, N. K. Labhsetwar, R. B. Biniwale and S. S. Rayalu, Carbon, 2010, 48, 396–402 CrossRef CAS PubMed.
  7. M. Inagaki, H. Konno and O. Tanaike, J. Power Sources, 2010, 195, 7880–7903 CrossRef CAS PubMed.
  8. Z. Li, Z. Xu, H. Wang, J. Ding, B. Zahiri, C. M. B. Holt, X. Tan and D. Mitlin, Energy Environ. Sci., 2014, 7, 1708–1718 CAS.
  9. K. R. Datta, V. V. Balasubramanian, K. Ariga, T. Mori and A. Vinu, Chem.–Eur. J., 2011, 17, 3390–3397 CrossRef CAS PubMed.
  10. Y. M. Tan, C. F. Xu, G. X. Chen, Z. H. Liu, M. Ma, Q. J. Xie, N. F. Zheng and S. Z. Yao, ACS Appl. Mater. Interfaces, 2013, 5, 2241–2248 CAS.
  11. L. F. Chen, X. D. Zhang, H. W. Liang, M. G. Kong, Q. F. Guan, P. Chen, Z. Y. Wu and S. H. Yu, ACS Nano, 2012, 6, 7092–7102 CrossRef CAS PubMed.
  12. J. Yan, T. Wei, W. Qiao, Z. Fan, L. Zhang, T. Li and Q. Zhao, Electrochem. Commun., 2010, 12, 1279–1282 CrossRef CAS PubMed.
  13. D. X. Yuan, T. X. Zhou, S. L. Zhou, W. J. Zou, S. S. Mo and N. N. Xia, Electrochem. Commun., 2011, 13, 242–246 CrossRef CAS PubMed.
  14. L. Zhao, L. Z. Fan, M. Q. Zhou, H. Guan, S. Y. Qiao, M. Antonietti and M. M. Titirici, Adv. Mater., 2010, 22, 5202–5206 CrossRef CAS PubMed.
  15. X. Hong, K. S. Hui, Z. Zeng, K. N. Hui, L. J. Zhang, M. Y. Mo and M. Li, Electrochim. Acta, 2014, 130, 464–469 CrossRef CAS PubMed.
  16. Y. F. Zhao, L. Zhao, K. X. Yao, Y. Yang, Q. Zhang and Y. Han, J. Mater. Chem., 2012, 22, 19726–19731 RSC.
  17. X. Y. Ma, M. H. Cao and C. W. Hu, J. Mater. Chem. A, 2013, 1, 913–918 CAS.
  18. D. Lin, X. Zhang, X. Cui and W. Chen, RSC Adv., 2014, 4, 27414–27424 RSC.
  19. J. C. Wang and Q. Liu, Nanoscale, 2014, 6, 4148–4156 RSC.
  20. V. Chandra, S. U. Yu, S. H. Kim, Y. S. Yoon, D. Y. Kim, A. H. Kwon, M. Meyyappan and K. S. Kim, Chem. Commun., 2012, 48, 735–737 RSC.
  21. Y. Yagci, B. Kiskan and N. N. Ghosh, J. Polym. Sci., Part A: Polym. Chem., 2009, 47, 5565–5576 CrossRef CAS.
  22. N. N. Ghosh, B. Kiskan and Y. Yagci, Prog. Polym. Sci., 2007, 32, 1344–1391 CrossRef CAS PubMed.
  23. X. Liu and Y. Gu, J. Appl. Polym. Sci., 2002, 84, 1107–1113 CrossRef CAS.
  24. T. Agag and T. Takeichi, Macromolecules, 2003, 36, 6010–6017 CrossRef CAS.
  25. H. J. Kim, Z. Brunovska and H. Ishida, Polymer, 1999, 40, 6565–6573 CrossRef CAS.
  26. G. P. Cao, W. J. Chen, J. J. Wei, W. T. Li and X. B. Liu, eXPRESS Polym. Lett., 2007, 1, 512–518 CrossRef CAS.
  27. T. Chaisuwan and H. Ishida, J. Appl. Polym. Sci., 2006, 101, 548–558 CrossRef CAS.
  28. Y. Liu, S. Zhao, H. Zhang, M. Wang and M. Run, Thermochim. Acta, 2012, 549, 42–48 CrossRef CAS PubMed.
  29. G. P. Hao, W. C. Li, D. Qian, G. H. Wang, W. P. Zhang, T. Zhang, A. Q. Wang, F. Schuth, H. J. Bongard and A. H. Lu, J. Am. Chem. Soc., 2011, 133, 11378–11388 CrossRef CAS PubMed.
  30. S. Wang, W. C. Li, G. P. Hao, Y. Hao, Q. Sun, X. Q. Zhang and A. H. Lu, J. Am. Chem. Soc., 2011, 133, 15304–15307 CrossRef CAS PubMed.
  31. M. Baqar, T. Agag, R. Huang, J. Maia, S. Qutubuddin and H. Ishida, Macromolecules, 2012, 45, 8119–8125 CrossRef CAS.
  32. Z. Brunovska, R. Lvon and H. Ishida, Thermochim. Acta, 2000, 357–358, 195–203 CrossRef CAS.
  33. S. L. Zhang, L. Chen, S. X. Zhou, D. Y. Zhao and L. M. Wu, Chem. Mater., 2010, 22, 3433–3440 CrossRef CAS.
  34. F. Su, C. K. Poh, J. S. Chen, G. Xu, D. Wang, Q. Li, J. Lin and X. W. Lou, Energy Environ. Sci., 2011, 4, 717–724 CAS.
  35. Y. W. Zhu, S. Murali, M. D. Stoller, K. J. Ganesh, W. W. Cai, P. J. Ferreira, A. Pirkle, R. M. Wallace, K. A. Cychosz, M. Thommes, D. Su, E. A. Stach and R. S. Ruoff, Science, 2011, 332, 1537–1541 CrossRef CAS PubMed.
  36. M. S. Park, B. O. Jeong, T. J. Kim, S. Kim, K. J. Kim, J. S. Yu, Y. Jung and Y. J. Kim, Carbon, 2014, 68, 265–272 CrossRef CAS PubMed.
  37. L. K. C. de Souza, N. P. Wickramaratne, A. S. Ello, M. J. F. Coata, C. E. F. Da Costa and M. Jaroniec, Carbon, 2013, 65, 334–340 CrossRef CAS PubMed.
  38. G. P. Hao, W. C. Li, D. Qian and A. H. Lu, Adv. Mater., 2010, 22, 853–857 CrossRef CAS PubMed.
  39. L. Sun, C. Tian, Y. Fu, Y. Yang, J. Yin, L. Wang and H. Fu, Chem.–Eur. J., 2014, 20, 564–574 CrossRef CAS PubMed.
  40. C. O. Ania, V. Khomenko, E. Raymund-Piñero, J. B. Parra and F. Béguin, Angew. Chem., Int. Ed., 2007, 17, 1828–1836 CAS.
  41. W. Wei, C. Liu, Z. Y. Zhao, L. Zhang, J. Zhou, S. P. Zhuo, Z. F. Yan, H. Cao, G. Q. Wang and S. Z. Qiao, Energy Environ. Sci., 2012, 5, 7323–7327 Search PubMed.
  42. X. Q. Fan, L. X. Zhang, G. B. Zhang, Z. Shu and J. L. Shi, Carbon, 2013, 61, 423–430 CrossRef CAS PubMed.
  43. X. Zhao, Q. Zhang, B. Zhang, C. M. Chen, A. Wang, T. Zhang and D. S. Su, J. Mater. Chem., 2012, 22, 4963–4969 RSC.
  44. L. Jiang, J. Yan, L. Hao, R. Xue, G. Sun and B. Yi, Carbon, 2014, 56, 146–154 CrossRef PubMed.
  45. D. Yu, K. Goh, L. Wei, H. Wang, Q. Zhang, W. Jiang, R. Si and Y. Chen, J. Mater. Chem. A, 2013, 1, 11061–11069 CAS.
  46. D. C. Guo, J. Mi, G. P. Hao, W. Dong, G. Xiong, W. C. Li and A. H. Lu, Energy Environ. Sci., 2013, 6, 652–659 CAS.
  47. J. Wu, D. Zhang, Y. Wang and B. R. Hou, J. Power Sources, 2013, 227, 185–190 CrossRef CAS PubMed.
  48. M. Seredych, D. Hulicova-Jurcakova, G. Q. Lu and T. J. Bandosz, Carbon, 2008, 46, 1475–1488 CrossRef CAS PubMed.
  49. E. Raymundo-Pinero, K. Kierzek, J. Machnikowski and F. Béguin, Carbon, 2006, 44, 2498–2507 CrossRef CAS PubMed.
  50. Y. H. Hsu, C. C. Lai, C. L. Ho and C. T. Lo, Electrochim. Acta, 2014, 127, 369–376 CrossRef CAS PubMed.
  51. B. Xu, D. Zheng, M. Jia, G. Cao and Y. Yang, Electrochim. Acta, 2013, 98, 176–182 CrossRef CAS PubMed.
  52. L. F. Chen, Z. H. Huang, H. W. Liang, W. T. Yao, Z. Y. Yu and S. H. Yu, Energy Environ. Sci., 2013, 6, 3331–3338 CAS.
  53. B. Qiu, C. Pan, W. Qian, Y. Peng, L. Qiu and F. Yan, J. Mater. Chem. A, 2013, 1, 6373–6378 CAS.
  54. Y. Hu, H. Liu, Q. Ke and J. Wang, J. Mater. Chem. A, 2014, 2, 11753–11758 CAS.
  55. C. Zheng, X. Zhou, H. Cao, G. Wang and Z. Liu, J. Power Sources, 2014, 258, 290–296 CrossRef CAS PubMed.
  56. M. Zhou, F. Pu, Z. Wang and S. Guan, Carbon, 2014, 68, 185–194 CrossRef CAS PubMed.
  57. X. Fan, L. Zhang, G. Zhang, Z. Shu and J. Shi, Carbon, 2013, 61, 423–430 CrossRef CAS PubMed.
  58. L. Liu, Q. F. Zhang, X. X. Hou and Z. Y. Yuan, J. Mater. Chem., 2012, 22, 15540–15548 RSC.
  59. M. Sevilla and A. B. Fuertes, Energy Environ. Sci., 2011, 4, 1765–1771 CAS.
  60. S. Feng, W. Li, Q. Shi, Y. Li, J. Chen, Y. Ling, A. M. Asiri and D. Zhao, Chem. Commun., 2014, 50, 329–331 RSC.
  61. X. Ma, Y. Li, M. Cao and C. Hu, J. Mater. Chem., 2014, 2, 4819–4826 RSC.
  62. Y. Zhao, X. Liu, K. X. Yao, L. Zhao and Y. Han, Chem. Mater., 2012, 24, 4725–4734 CrossRef CAS.

Footnote

Electronic supplementary information (ESI) available: Elemental and XPS analysis, XPS peak positions and content of each nitrogen, oxygen component, comparison of the capacitive performance and CO2 capture performance of some nitrogen-containing porous carbon materials. See DOI: 10.1039/c4ra13637c

This journal is © The Royal Society of Chemistry 2015