DOI:
10.1039/C4RA13596B
(Paper)
RSC Adv., 2015,
5, 513-520
Controllable synthesis and morphology-dependent photocatalytic performance of anatase TiO2 nanoplates†
Received
1st November 2014
, Accepted 21st November 2014
First published on 21st November 2014
Abstract
Uniform rhombic anatase TiO2 nanoplates with selectively exposed {010} facets were successfully fabricated using a novel solvothermal method without adding surfactant or templates. In our synthetic approach, the coordination effect of acetic acid (HAc) and N,N-dimethyl formamide (DMF) regulated the reaction rate and contributed to the formation of TiO2 nanoplates. The TiO2 samples were characterized by X-ray diffraction (XRD), transmission electron microscopy (TEM), infrared spectra (IR), UV-visible diffuse reflectance spectroscopy (DRS), Brunauer–Emmett–Teller (BET) specific surface areas and photoluminescence spectra (PL). The TEM characterization results suggested that the growth of rhombic nanoplates was governed by a nucleation–crystallization–dissolution growth mechanism. The mechanism demonstrated that both the reaction time and the HAc/DMF ratio played crucial roles in controlling size and shape of TiO2 nanocrystals. By tuning the ratio of HAc to DMF, reaction time and reaction temperature, the photocatalytic performance of the as-synthesized TiO2 samples was improved. The enhanced photocatalytic activity could be ascribed to the exposed {010} facets and the high surface areas of the TiO2 nanoplates.
Introduction
Semiconductor photocatalysis technology has been extensively studied since 1972 (ref. 1) in remission of increasingly serious environment and energy crisis. Undoubtedly, of all semiconductor photocatalysts, titanium dioxide (TiO2) is the most studied semiconductor photocatalyst owing to its abundance, nontoxicity and stability.2 By far, there are three natural polymorphs of titania, known as: anatase (space group: I41/amd), rutile (space group: P42/mnm), and brookite (space group: Pbca). Anatase TiO2, which contains more defects in lattice to produce oxygen vacancies and capture the electrons, has the highest activity among these three phases. However, the applications of photocatalyst depend not only on the crystal phase but also on the particle size and shape. The morphology of nanoparticles (NPs) may change physical and chemical properties markedly.3 For instance, the single-crystal nanosheets of anatase TiO2, which were fabricated by Yang et al. firstly, had superior photoreactivity 5 times greater than that of P25.4
Over the past decades, there are a number of synthetic routes to the preparation of TiO2 NPs, such as sol–gel, nonaqueous sol, micelle/reversemicelle, polyol, sonochemical synthesis, hydro-/solvothermal methods and other approaches.5 Notwithstanding these techniques, there are limitations in the mild and green synthesis of TiO2 NPs with controlled size and shape. For example, in a conventional sol–gel process, it takes a long time even several months for sols to turn into gels and calcination is neccessary.6 In terms of hydro-/solvothermal method, it is limited to regulate the hydrolytic reaction rate accurately for crystal growth. Generally, organic macromolecule7 and specific anions,8 which both are new polluters introduced into system, are often applied to control the size and morphology of TiO2 NPs. Since it was discovered that fluorine ion could modify TiO2 morphology by Lu et al., hydrogen fluoride has been used widely to produce anatase TiO2.9 Unfortunately, hydrogen fluoride acts as a highly toxic and extremely corrosive chemical to human beings. Consequently, seeking environment-friendly ways of TiO2 NPs with high performance is of significance right now. Meanwhile, understanding the shape-guiding process and the growth mechanism of nanocrystals (NCs) is valuable to the yield of NPs with desired sizes and morphologies.
Herein, we proposed a reliable and fluorine-free solvothermal synthetic method to obtain rhombic TiO2 nanoplates with {010} facets exposed in the non-aqueous solvent. In this method, tetrabutyl titanate (TBT) was applied as the titanium source; acetic acid (HAc) and N,N-dimethyl formamide (DMF) were used as capping agents to condition the special crystal facets. In this paper, the morphology evolution and the growth mechanism which were confirmed by a nucleation–crystallization–dissolution growth process were demonstrated in detailed. Additionally, the photocatalytic activities of TiO2 in the degradation of methyl orange (MO) under ultraviolet (UV) light (λ = 365 nm) irradiation were studied. The superior photocatalytic activity could be ascribed to the nanostructures which had the unique morphology and the exposed {010} facets. The innovation of our work were using HAc and DMF as capping agents to control the reaction rate to form the TiO2 nanoplates and studying the relationship between photocatalytic properties and morphology-effect of as-prepared TiO2 samples.
Experimental section
Materials and reagents
All the chemicals used in the experiment were chemical pure reagent grade. Tetrabutyl titanate (TBT, 98.0%, Shanghai Chem. Co) was used as precursor for the preparation of the TiO2 nanoplates. Acetic acid solution (CH3COOH, 99.5%, Shanghai Chem. Co.), N,N-dimethyl formamide (DMF, 99.5%, Shanghai Chem. Co.), ethanol (C2H5OH, 99.7%, Shanghai Chem. Co.) were used as the solvent. Doubly distilled water was used for all the synthesis and treatment processes.
Synthesis of rhombic-shaped anatase TiO2
In a typical preparation, tetrabutyl titanate was added by drops into 20 mL HAc. After the mixture solvents dissolved completely, 40 mL DMF and 10 mL absolute ethanol were added to the mixture in the volume ratio (HAC
:
DMF
:
ethanol) of 2
:
4
:
1. After being stirred for 2 h, the transparent solution was obtained. The autoclave was sealed and maintained at 180 °C for 24 h, and then cooled to the room temperature. The products were filtered with distilled water and dried in air at 60 °C for 12 h.
Characterization of the photocatalyst
The crystalline structure of the catalysts was characterized by the powder X-ray diffraction (XRD) employing a scanning rate of 0.05° s−1 in a 2θ range from 10° to 80°, in a Bruker D8 Advance using the monochromatized Cu Kα radiation. The particle size and morphology of the catalysts were analyzed by the transmission electron microscope (TEM), which were taken on a Tecnai G20 (FEI Co., Holland) TEM using an accelerating voltage of 200 kV. The infrared spectra were collected using a Nicolet Nexus 6700 (ThermoScientific, Courtaboeuf, France) spectrometer and KBr as background. The Brunauer–Emmett–Teller (BET) specific surface areas of the samples were evaluated on the basis of nitrogen adsorption isotherms using a Micromeritics ASAP 2020 gas adsorption apparatus (USA). The ultraviolet-visible diffuse reflectance spectra (DRS) were collected using a Shimadzu UV-2450 spectrophotometer from 200 to 800 nm by using BaSO4 as background. The photoluminescence (PL) spectra of the samples were recorded with a PE LS55 spectrophotometer.
Photodegradation experiment
The photocatalytic performance of the as-prepared sample was tested by the degradation of methylene orange (MO) under the UV irradiation. In a typical experiment, 10 mg of the photocatalyst and 10 mL of MO solution (20 mg L−1) were added to a small crucible, and then the mixed solution was stirred in the darkness for 1 h after ultrasonic treatment. When reaching adsorption equilibrium, the photocatalytic reaction was initiated by irradiating the system with a 16 W Lamplic UV lamp (main wavelength 365 nm). At given time intervals, 1 mL aliquots were collected, centrifuged, and then filtered to remove the catalyst particles for analysis. The filtrates were finally analyzed by an UV-vis spectrophotometer (UV-2450).
Results and discussion
The XRD pattern in Fig. 1 indicated that the as-prepared sample belonged to tetragonal anatase phase TiO2 with lattice constant a = 3.7852 Å, b = c = 9.5139 Å (JCPDS File no. 21-1272). Fig. 2 corresponded to the TEM images of this sample. From Fig. 2a and b, one could easily identify that the morphology of this sample was plate-like monocrystal, and the sizes of these plates were about 90 nm in length and about 30 nm in width. The further HRTEM images in Fig. 2c and d displayed that the TiO2 nanoplate was an approximate rhombic, while the angle of this rhombic was only 43.4°. And the exposed facet of this tiny rhombic calculated from two crossed lattice fringes in Fig. 2d was {010}. The two crossed lattice fringes in Fig. 2d could be identified as (101) and (002) facets respectively, that is to say that the as-prepared TiO2 nanorhombic was enclosed by {101} facets as Fig. 2c showed, and this conclusion was also in accord with the Fast Fourier Transform (FFT) analysis Fig. 2e.
 |
| Fig. 1 XRD pattern of the as-prepared TiO2 sample prepared at 180 °C for 12 h. | |
 |
| Fig. 2 (a)–(c) TEM images of the rhombic nanoplates. (d) HRTEM image recorded from an individual rhombic nanoplate. (e) Fast Fourier Transform (FFT) analysis. (f) The structure model of TiO2 rhombic crystals from y-axis view, the blue and red balls represent the Ti and O atoms. | |
To understand the growth mechanism of the TiO2 nanoplates under the present experimental conditions, it was necessary to look into the phase structures and morphologies of the intermediates involved in the formation. We had systematically surveyed their growth process by analyzing the TEM and XRD characterization results of the samples at different growth stages. Fig. 3 gave the TEM images of six samples taken from the different reaction time: from 3 h to 48 h. These images revealed the morphology transformation process of the TiO2 nanostructures clearly when the solvothermal temperature was kept at 180 °C. No precipitation could be observed when the reaction time was less than 3 h. At the early stage, the morphology of the 3 h TiO2 sample was amorphous and aggregate with large size (Fig. 3a). The corresponding XRD patterns (Fig. 4a) clearly showed that the tetragonal system anatase phase of TiO2 occurred even reacted for 3 h despite with poor crystallinity. As the reaction period was prolonged, more and more TiO2 nanoplates emerged (Fig. 3b) and involved into rhombic-like nanoplates (Fig. 3c) which were likely exfoliated from the former amorphous nanocrystal (NCs). Not unexpectedly, the intermediary nanoplates underwent an evolution into relatively pure rhombic nanoplates at the point of 12 h (Fig. 3d), this phenomenon was similar to the observation of Wu et al.10 and Dinh et al.11 In the meantime, the XRD patterns of these samples were illustrated in Fig. 4. As the solvothermal time increased from 3 h to 12 h, the diffraction peaks increased gradually and became narrower and sharper, especially the strongest diffraction peak indexed to (101) crystal planes. It indicated that the crystals grew up gradually and tended to be well-crystallized TiO2 comparatively based on the Scherrer formula. After 12 h, the {101} edges of TiO2 sample had a tendency to dissolve most of rhombic-like nanoplates transformed into spindle-like ones (Fig. 3e) and then almost all of them changed into rod-like ones (Fig. 3f). Accordingly, the crystalline intensity of these three samples lessened inconspicuously in agreement with the TEM analysis in the ripening process.
 |
| Fig. 3 TEM image of the TiO2 sample at the ratio of HAc : DMF 1 : 2 at 180 °C for different reaction time (a) 3 h (b) 4.5 h (c) 6 h (d) 12 h (e) 24 h (f) 48 h. | |
 |
| Fig. 4 XRD patterns of TiO2 samples at the ratio of HAc : DMF 1 : 2 for different reaction time 3 h, 4.5 h, 6 h, 12 h, 24 h, 48 h at 180 °C. | |
As HAc and DMF were the two main solvents in the system, the HAc/DMF ratios were further varied with the total solution amount kept constant in order to elucidate their respective roles in the system. By fixing the HAc
:
DMF volume ratio at 1
:
2, there were rhombic-shaped TiO2 NPs with uniform size (Fig. 5b). With the increase of the amount of HAc, more and more TiO2 nanoplates connected together and turned into flower-like architectures (Fig. 5a). These flowery structures were composed of sharp nanoplates which were about 100–150 nm in length and 50 nm in width. As the amount of HAc was tapered off, the TiO2 NCs transformed into irregularly thinner and smaller NPs (Fig. 5c and d). From another aspect, the narrower diffraction peaks in the XRD analysis (Fig. 6) indicated that the larger sizes were consistent with the TEM images. Obviously, the TiO2 crystal growth rate was retarded with the DMF amount increased. When the ratio of HAc
:
DMF was lower than 1
:
2, the NPs size decreased markedly and the shape became irregular. We also prepared some samples by adding more HAc or DMF in the reaction system. In the absence of HAc, only many rough tiny NPs were observed (Fig. 7a). When more HAc were added, the NCs were so agglomerated that grew into thicker and bigger slabs. However, the samples with only HAc added were eroded to ordinary irregular plates (Fig. 7b), in contrast to the larger plates of only 12 h samples (Fig. 7c). HAc promoted the growth of TiO2 crystal so greatly that many TiO2 slabs connected. We supposed that the slabs would corrode into the amorphous particles when only HAc were added into reaction system. Moreover, it confirmed that it was an eroding process started from 12 h in which HAc played a major role. Hence, we believed that the coordination effect of HAc and DMF determined the final morphology of the TiO2 nanoplates in the system.
 |
| Fig. 5 TEM images of the TiO2 samples at different ratio of HAc : DMF (a) 1 : 1 (b) 1 : 2 (c) 1 : 3 (d) 1 : 4 at 180 °C for 24 h. | |
 |
| Fig. 6 XRD patterns of TiO2 samples at the different ratios of HAc : DMF (a) 1 : 1 (b) 1 : 2 (c) 1 : 3 (d) 1 : 4 at 180 °C for 24 h. | |
 |
| Fig. 7 TEM images of TiO2 samples (a) only DMF added for 24 h (b) only HAc added for 12 h and (c) only HAc added for 24 h. | |
To confirm the anisotropic growth of TiO2 samples comprehensively, we should combine theories with practice. It is established that the formation of TiO2 undergoes two main steps in liquid phase reaction: hydrolysis of titanium precursors and condensation reactions to form a Ti–O–Ti network.11,12 Thus, the rate of formation and crystal growth affected the final shape of TiO2 nanostructures dramatically. As we know, the hydrolytic reaction rate of TBT is quite fast.13 Because of this, HAc and DMF were applied to modify the metal alkoxides and control the reaction rate, which was favorable for the formation of TiO2 with controllable morphology. The infrared spectra (IR) of as-prepared TiO2 samples were applied to estimate all the equations in the diverse conditions (Fig. 8). With regard to the 3 h sample in Fig. 8a, the two absorption bands at 1042.6 and 1128.5 cm−1 were the stretching vibrations of the O–C–C bonds from the butyl groups of TBT. Two absorption bands were observed at 1425.5 and 1534.5 cm−1, which were attributed to the symmetric and asymmetric stretching vibrations of the carboxylate groups respectively. The separation of these bands (Δν) indicated coordination modes of TBT and the carboxylic group, viz., monodentate (Δν = 425 cm−1), bidentate chelating (Δν = 130–80 cm−1, and bidentate bridging (Δν = 140–160 cm−1).12b The two bands observed in the IR spectrum of the 3 h sample were attributed to the bidentate chelating of the acetate anions reaction from the acidolysis product of TBT (Δν = 109 cm−1). While in the spectrum of 12 h samples (Fig. 8b), the peaks from TBT and carboxylic groups disappeared. And it indicated that all the peak intensity of TiO2 samples with DMF used only (Fig. 8c) had weakened evidently compared with that in the Fig. 8b. Comparing to the TiO2 sample at the 1
:
2 ratio of HAc
:
DMF, the feature peaks of other samples with one solvent added were not obvious. According to all the TEM images, we supposed that the coordination effect of the two solvents contributed to the formation of TiO2 nanoplates. The absorption band at 1600 cm−1 resulted from the bending vibration of the Ti–OH bonds, which could be hidden by hydroxyl groups of TiO2 in 1637.5 cm−1. These hydroxide groups in TiOH formed the TiO2 NCs by the condensation reaction at high temperature. Fig. 8a and b showed the broad band at 3400 cm−1 and the feature peak at 1637.5 cm−1, which correspond to the water absorbed on the surface and the hydroxyl groups of the TiO2 nanoplates. When the Fig. 8c TiO2 sample was calcined at 400 °C for 2 h, the intensity of these bands decreased with other bands unexchanged (Fig. 8d). These water molecules and hydroxyl groups absorbed on the surface played an important role in photocatalytic applications, because these species produced hydroxyl radicals on the TiO2 surfaces.14 The related equations were described as follows.
|
 | (1) |
|
 | (2) |
|
 | (3) |
 |
| Fig. 8 IR spectra of TiO2 samples (a) at the 1 : 2 HAc : DMF ratio for 3 h, (b) at the 1 : 2 HAc : DMF ratio for 12 h, (c) only DMF added for 24 h, (d) only DMF added for 24 h sample calcined at 400 °C. | |
At the initial step of the reaction, TBT can readily react with HAc to generate unstable milk colloidal titanium acetate complexes Ti(O–COCH3)4, in which butoxide groups were replaced by acetic ligands releasing of butoxyl alcohol (eqn (1)). When DMF was added, the milk solution became clear. DMF is a kind of aprotic solvent, which can make titanium cations solventlized.15 It was expected that the tetrahedron coordination structure of [Ti(DMF)4](OCOCH3)4 was formed in which the symmetry center was a Ti4+ ion.15a,16 Titanium acetate complexes reacting with DMF brought about corresponding titanium chelates and these stable chelates tended to hydrolyze more slowly. As the reaction proceeded, the DMF molecules would be taken off from these titanium chelates under high temperature and pressure. Then, the titanium acetate ligands reacted to generate Ti–OH and subsequently Ti–O–Ti bonds were obtained through condensation processes (eqn (2)).
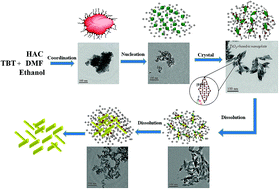
The TiO2 crystal growth was discussed overall. To the best of our knowledge, the morphology of the TiO2 NCs was governed by the relative growth rate of different crystal planes. Through careful analysis of the I41 symmetry group of anatase TiO2, every TiO6 octahedra joined to each other to form a TiO2 unit cell. Generally, the inherent crystal structure of anatase TiO2 was truncated octahedral bipyramid that had eight {101} facets and two {001} facets.17 And the average surface energy of anatase TiO2 facet was 0.90 J m−2 for {001}, 0.53 J m−2 for {010} and 0.44 J m−2 for {101}.18 Due to the high surface energy of {001} facets, anatase TiO2 growing along [001] occurred progressively and resulted in the depletion of the {001} facets based on Wulff construction.17a On account of the TiO2 crystal structure and our experiment results, a tentative mechanism for the formation of anatase TiO2 crystals in our system was proposed which was illustrated in Scheme 1. Initially, TBT reacted with HAc and DMF through the hydrolysis and condense process to form amorphous TiO2 precursors as mentioned above in eqn (1) and (2). Later, TiO2 precursors converted to the building units (monomers). Subsequently, a nucleation of the TiO2 crystal would happen and lots of crystal seeds started to come out. DMF, at the same time, gradually hydrolyzed to generate NH(CH3)2 and HCOOH in the presence of a trace amount of water produced by a slow esterification reaction or adsorbed water of solvents (eqn (3)).12a It is demonstrated that carboxylic acids binds very strongly to anatase {001} facets,19 whereas amide tends to adhere on the {101} ones.20 The selective bond of these molecules to different facets of TiO2 restricted the crystal growing in corresponding [001] and [101] direction. Due to the selective adsorption of organic acid and amide on the different facets, rhombic-shaped TiO2 nanoplates emerged. As the reaction time extended, the nanoplates dissolved to form spindle- and rod-shaped TiO2 nanoplates. It was predicted that the dissolution would not cease until an equilibrium state achieved finally.
 |
| Scheme 1 Schematic illustrating the formation process of the TiO2 nanoplates. | |
In conclusion, the HAc played three roles in this reaction. Firstly, it reacted with TBT to produce butyl acetate to accelerate the hydrolysis process. Secondly, the effect of HAc absorbed on the {001} facet restrained the TiO2 NCs from growing along [001] direction. Lastly, it played a significant role in the corrosion process as mentioned in Fig. 6. Meanwhile, the DMF played two roles. On the one hand, it acted as the chemical modifier of titanium acetate to lower its reactivity. So the macromolecules temporarily stabled the tiny anatase NCs against immediate single crystal formation or uncontrolled aggregation. On the other hand, the effect of its hydrolysis product NH(CH3)2 absorbed on the {101} facet inhibited the TiO2 crystal growing along [101] direction. By the coordination effect of HAc and DMF with TBT, the TiO2 crystal growth was described as a controlled nucleation–crystallization–dissolution process.
The reaction temperature also had a great influence on tuning morphology of different kinds of NPs. We had fixed the HAc
:
DMF
:
ethanol ratio at 2
:
4
:
1 and conducted experiments with the temperature selected at 150 °C and 200 °C for 24 h to investigate the effect of the reaction temperature on the shape of TiO2 NPs. The yield TiO2 samples of 150 °C was only a quarter compared with at 180 °C. There were amorphous precursors and irregular nanoplates (Fig. 9a). When the temperature was increased to 200 °C, all of regular TiO2 nanoplates were obtained, as illustrated in Fig. 9c. We found that the 180 °C was the optimal reaction temperature to form regular and high crystalline TiO2 nanoplates (Fig. 9b).
 |
| Fig. 9 TEM of TiO2 samples at (a) 150 °C (b) 180 °C (c) 200 °C at the HAc : DMF ratio of 1 : 2 for 24 h. | |
To reveal the photocatalytic performance of these TiO2 nanoplates, the samples were evaluated in the photocatalytic oxidation of MO under ultraviolet light irradiation, as shown in Fig. 10 and 11. The photodegradation efficiency (%) has been calculated as:
|
 | (4) |
where
C0 was the initial concentration of MO and
C was the concentration of dye after photo irradiation. In
Fig.10, commercially available pure anatase nanoparticles were employed as reference photocatalyst. When no catalysts were involved, decomposition of MO was negligible within the test period of 15 min. The samples with DMF added only showed few catalytic activities towards MO decomposition. Comparatively, the high reactivity of samples at the different ratio of HAc/DMF was shown in
Fig. 11a. When the DMF volume lessened, the MO could be degraded completely in 15 min, which could be ascribed to the smaller and the more dispersed particles as was indicated in
Fig. 5. The different reaction period of samples also played an important role in the photocatalytic reaction, which caused a various decomposition efficiency, as was shown in
Fig. 11b. We found that the activity enhanced from 6 h to 24 h and declined from 24 h to 48 h. In
Fig. 3, the perfect rhombic nanoplates formed gradually from 3 h to 12 h as the crystallinity enhanced. The high crystallinity of regular TiO
2 nanoplates could accelerate the transfer of photogenerated electrons and holes to improve the activity.
21 From 24 h to 48 h, the activity declined as the morphology evolved from rhombic to spindle and to rod. The morphology of external exposed {010} facets could be another reason for photocatalytic activity. Photoexcited charge carriers can transfer between different facets, especially {001}, {010} and {101} facets in terms of anatase TiO
2. The reaction sites for the effective reduction were preferentially located on the {101} facets, while the oxidation sites proceed on the {010} and {001} facets due to the crystallographic anisotropy and different electronic energy levels of facets.
22 The photoexcited electrons tended to transfer to the {101} facets and the photoinduced holes moved along the [001] direction so that the photoexcited charge carriers of anatase TiO
2 nanoplates were spatially separated more efficiently than that of irregular particles.
23 In this work, the as-synthesized anatase TiO
2 nanoplates grew along the [001] orientation and the edges of the sides were surrounded by {101} facets. The anatase TiO
2 nanoplates had a surface area of {101} for photocatalytic reduction and {010} for oxidation, which was suitable for photocatalytic degradation of organic compounds. Thus, the photocatalytic performance enhanced along with the {010} facet forming and declined as it dissolved. The
Scheme 2 illustrated the probable mechanism about the spatial separation and the transfer of photointroduced electron–hole pair for photocatalytic degradation on the anatase TiO
2 rhombic nanoplate.
 |
| Fig. 10 Degrading MO activities of the TiO2 samples adding HAc, the as-synthesized TiO2 rhombic nanoplates exhibited good catalytic activity obviously superior to reference commercial TiO2 and the TiO2 sample added HAc only. The HAc : DMF = 1 : 2 or DM for 24 h, commercial TiO2 and catalyst-free in 15 min under ultraviolet-light (λ = 365 nm) irradiation. | |
 |
| Fig. 11 Degrading MO activities of TiO2 samples (a) at the different ratios of HAc : DMF 1 : 1, 1 : 2, 1 : 3 and 1 : 4 (b) at the ratio of HAc : DMF = 1 : 2 for different time 6 h, 12 h, 24 h, 36 h and 48 h in 15 min under ultraviolet-light (λ = 365 nm) irradiation. | |
 |
| Scheme 2 The probable spatial separation and transfer of photointroduced electron–hole pair for photocatalytic degradation on the anatase TiO2 rhombic nanoplate under UV irradiation. | |
To investigate the crucial factors that affect the photocatalytic activity, the TiO2 products with different morphologies were selected for further characterization. They were denoted as R1–TiO2 (rhombic-like), S–TiO2 (spindle-like), R2–TiO2 (rod-like), F1–TiO2 (flower-like), F2–TiO2 (fractionlet-like) and C–TiO2 (commercial TiO2). The surface area of TiO2 samples was investigated using nitrogen adsorption–desorption measurements as shown in the Table 1. The TiO2 samples showed a typical type III pattern with an obvious hysteresis loop, which was representative of slice-like structure. The table indicated that the R1–TiO2 had a much larger specific surface area (73.9 m2 g−1) compared with commercial TiO2 (9.9 m2 g−1). After the dissolution, the surface area increased to 103.6 m2 g−1 (S–TiO2) and then reduced to 72.5 m2 g−1 (R2–TiO2). It could illustrate the enhancement and decline of photocatalytic performance from 12 h to 48 h for larger surface area resulted in more contact between the photocatalyst and reactant.24 Comparing to F1–TiO2 (37.8 m2 g−1), F2–TiO2 (124.3 m2 g−1) had the larger surface area, it showed higher activity in the photocatalytic reaction. We drew a conclusion that the photocatalytic activity strictly depended on the BET surface area. UV-vis diffuse reflectance spectra (DRS) were employed to characterize the optical properties of the samples which were closely related to electronic structure and morphology. Fig. 12 represented UV-Vis diffuse reflectance spectra and Tauc plot of the as-synthesized TiO2 samples with different morphologies. The absorption edges were found to be 375.8, 357.2 and 366.7 nm for F1–TiO2, S–TiO2, F2–TiO2 in the UV light region. Light-absorption discrepancies for R1–TiO2, S–TiO2, R2–TiO2 samples could be ignored under the same experimental conditions as was indicated by nearly the same absorption edges (Table 1). Optical band gap energies of the sample were estimated from DRS by using the following equation:
where
α,
ν,
A, and
Eg were absorption coefficient, light frequency, proportionality constant, and optical band-gap energy, respectively.
25 By extrapolating the linear portion of the (
Ahν)
2 versus hν curves to the energy axis at
a = 0, the
Eg values of 3.55 eV, 3.70 eV and 3.64 eV were calculated for F1–TiO
2, S–TiO
2 and F2–TiO
2. Compared with the values of commercial TiO
2 (3.32 eV), this observed value showed a blue shift, which could be associated with the quantum size effects.
10 The quantum effects get more obvious for smaller size of the NPs as we know. It well elucidated that the micro-structured F1–TiO
2 had the narrowest band gap when the band gap of nano-structured R1–TiO
2, S–TiO
2, R2–TiO
2 and F2–TiO
2 were broader.
Table 1 BET surface area and band gap energy of the as-synthesized TiO2 samples with different morphologies and commercial TiO2
Sample |
Time (h) |
Ratio of HAc : DMF |
BET (m2 g−1) |
Eg (eV) |
F1–TiO2 |
24 h |
1 : 1 |
37.8 |
3.55 |
R1–TiO2 |
12 h |
1 : 2 |
73.9 |
3.70 |
S–TiO2 |
24 h |
1 : 2 |
103.6 |
3.70 |
R2–TiO2 |
48 h |
1 : 2 |
72.5 |
3.70 |
F2–TiO2 |
24 h |
1 : 4 |
124.3 |
3.64 |
C–TiO2 |
— |
— |
9.9 |
3.32 |
 |
| Fig. 12 UV-Vis diffuse reflectance spectra and Tauc plot of as-synthesized TiO2 samples with different morphologies. | |
The nature of catalytic activity was further confirmed through ˙OH measurements using coumarin as a fluorescence probe under UV irradiation (Fig. 13). ˙OH was one of the reactive species to degrade organic macromolecules, from H2O absorbed on the TiO2 surface oxidized by photoinduced holes.26 In the PL spectra for 20 mg L−1 coumarin solution with 12 minutes irradiation time, it revealed that the ˙OH radicals increment velocity slowed down as the exposed {010} facet dissolved. The more areas of {010} facets led to more effective separation of photoinduced electrons and holes for photocatalysis. It well explained that the photocatalysis activity increased firstly and then decreased as the reaction time prolonged. In the inset, a rapid PL intensity of the R1–TiO2 sample increased at about 455 nm (excited at 332 nm) was observed indicating the fast production rate of ˙OH radicals.
 |
| Fig. 13 Fluorescence intensities of as-synthesized TiO2 sample with different morphologies and commercial TiO2 at 455 nm (excitation at 332 nm) using coumarin as a fluorescence probe of ˙OH in 12 min and inset is the PL spectra changes of R1–TiO2. | |
Conclusion
In conclusion, the uniform anatase TiO2 nanoplates with tunable sizes and morphologies were successfully fabricated on a large scale by a simple solvothermal route of employing both HAc and DMF as capping agents. In this system, reaction time and the ratio of HAc/DMF ensured a fine control of the growth of TiO2 NPs with desired morphology. The electron microscopy investigation and the infrared spectra indicated that the growth process of the nanoplates was governed by a nucleation–crystallization–dissolution growth mechanism. The mechanism revealed that the both HAc and DMF played multiple roles during the hydrolytic–condensation process of anatase crystals in the system. The collaborative effects of HAc and DMF made the reaction rate suited to the TiO2 crystal growth. In addition, the obtained anatase crystals exhibited improved performance as photocatalysis materials, which could be largely attributed to the morphology-dependent properties of TiO2, including the exposed {010} facet and the surface area. Moreover, such nanocrystals with controlled morphology would be valuable for further investigation of other applications.
Acknowledgements
This work was supported by Natural Science Foundation of Hubei Province (2013CFA089).
Notes and references
- A. Fujishima and K. Honda, Nature, 1972, 238, 37–38 CrossRef CAS.
-
(a) A. Fujishima, X. Zhang and D. Tryk, Surf. Sci. Rep., 2008, 63, 515–582 CrossRef CAS PubMed;
(b) K. Nakata and A. Fujishima, J. Photochem. Photobiol., 2012, 13, 169–189 CrossRef CAS PubMed.
-
(a) C. Han, R. Luque and D. D. Dionysiou, Chem. Commun., 2012, 48, 1860–1862 RSC;
(b) T. Ichijo, S. Sato and M. Fujita, J. Am. Chem. Soc., 2013, 135, 6786–6789 CrossRef CAS PubMed;
(c) Z. Sun, J. H. Kim, Y. Zhao, F. Bijarbooneh, V. Malgras, Y. Lee, Y. M. Kang and S. X. Dou, J. Am. Chem. Soc., 2011, 133, 19314–19317 CrossRef CAS PubMed.
- H. G. Yang, G. Liu, S. Z. Qiao, C. H. Sun, Y. G. Jin, S. C. Smith, J. Zou, H. M. Cheng and G. Q. Lu, J. Am. Chem. Soc., 2009, 131, 4078–4083 CrossRef CAS PubMed.
- C. Z. Wen, H. B. Jiang, S. Z. Qiao, H. G. Yang and G. Q. Lu, J. Mater. Chem., 2011, 21, 7052–7061 RSC.
-
(a) S. Costacurta, G. Dal Maso, R. Gallo, M. Guglielmi, G. Brusatin and P. Falcaro, ACS Appl. Mater. Interfaces, 2010, 2, 1294–1298 CrossRef CAS PubMed;
(b) R. López and R. Gómez, J. Sol-Gel Sci. Technol., 2011, 61, 1–7 CrossRef;
(c) D. P. Macwan, P. N. Dave and S. Chaturvedi, J. Mater. Sci., 2011, 46, 3669–3686 CrossRef CAS;
(d) H. Terrisse, A.-F. Bando, T. Cottineau, L. Brohan and M. Richard-Plouet, J. Sol-Gel Sci. Technol., 2013, 67, 288–296 CrossRef CAS PubMed;
(e) D. Wang, L. Xiao, Q. Luo, X. Li, J. An and Y. Duan, J. Hazard. Mater., 2011, 192, 150–159 CrossRef CAS PubMed.
-
(a) M. Iijima, M. Kobayakawa, M. Yamazaki, Y. Ohta and H. Kamiya, J. Am. Chem. Soc., 2009, 131, 16342–163433 CrossRef CAS PubMed;
(b) M. Niederberger and G. Garnweitner, Chem.–Eur. J., 2006, 12, 7282–7302 CrossRef CAS PubMed.
-
(a) T.-Y. Ke, C.-W. Peng, C.-Y. Lee, H.-T. Chiu and H.-S. Sheu, CrystEngComm, 2009, 11, 1691–1695 RSC;
(b) L. Wu, B. X. Yang, X. H. Yang, Z. G. Chen, Z. Li, H. J. Zhao, X. Q. Gong and H. G. Yang, CrystEngComm, 2013, 15, 3252–3255 RSC;
(c) M.-H. Yang, P.-C. Chen, M.-C. Tsai, T.-T. Chen, I. C. Chang, H.-T. Chiu and C.-Y. Lee, CrystEngComm, 2013, 15, 2966–2971 RSC.
- H. G. Yang, C. H. Sun, S. Z. Qiao, J. Zou, G. Liu, S. C. Smith, H. M. Cheng and G. Q. Lu, Nature., 2008, 453, 638–641 CrossRef CAS PubMed.
- B. Wu, C. Guo, N. Zheng, Z. Xie and G. D. Stucky, J. Am. Chem. Soc., 2008, 130, 17563–17567 CrossRef CAS PubMed.
- C. T. Dinh, T. D. Nguyen, F. Kleitz and T. O. Do, ACS Nano, 2009, 3, 3737–3743 CrossRef CAS PubMed.
-
(a) X. L. Li, Q. Peng, J. X. Yi, X. Wang and Y. Li, Chem.–Eur. J., 2006, 12, 2383–2391 CrossRef CAS PubMed;
(b) E. Stathatos, D. Papulis, C. A. Aggelopoulos, D. Panagiotaras and A. Nikolopoulou, J. Hazard. Mater., 2012, 211–212, 68–76 CrossRef CAS PubMed.
- E.I. du Pont de Nemours and Company, 2001, Organic titanates product information–TNBT.
- L. Pan, J. J. Zou, S. B. Wang, Z. F. Huang, X. W. Zhang and W. Li, Appl. Surf. Sci., 2013, 268, 252–258 CrossRef CAS PubMed.
-
(a) H. SuzukI and S.-I. Ishiguro, Acta. Crystallogr., 1998, C54, 586–588 CAS;
(b) M. Sindoro, A.-Y. Jee and S. Granick, Chem. Commun., 2013, 49, 9576–9578 RSC;
(c) M. Yang, Z. Shen, T. Chen, H. Bi, B. Yang and W. Xu, Dalton Trans., 2013, 42, 1174–1179 RSC.
- T. Cottineau, M. Richard-Plouet, J.-Y. Mevellec and L. Brohan, J. Phys. Chem. C, 2011, 115, 12269–12274 CAS.
-
(a) R. O. Da Silva, R. H. Goncalves, D. G. Stroppa, A. J. Ramirez and E. R. Leite, Nanoscale, 2011, 3, 1910–1916 RSC;
(b) A. S. Barnard and L. A. Curtiss, Nano Lett., 2005, 7, 1261–1266 CrossRef.
- J. Pan, G. Liu, G. Q. Lu and H. M Cheng, Angew. Chem., Int. Ed., 2011, 50, 2133–2137 CrossRef CAS PubMed.
-
(a) X. L. Li, Q. Peng, J. X. Yi, X. Wang and Y. Li, Chem.–Eur. J., 2006, 12, 2383–2391 CrossRef CAS PubMed;
(b) H. Z. Zhang, R. Z. Lee Penn, R. J. Hamers and J. F. Banfield, J. Phys. Chem. B, 1999, 103, 4656–4662 CrossRef CAS;
(c) Y.-W. Jun, F. Maria, M. F. Casula, J.-H. Sim, S. Y. Kim, J. Cheon and A. P. Alivisatos, J. Am. Chem. Soc., 2003, 51, 15981–15985 CrossRef PubMed.
- J. Joo, S. G. Kwon, T. Yu, M. Cho, J. Lee, J. Yoon and T. Hyeon, J. Phys. Chem. B, 2005, 109, 15297–15302 CrossRef CAS PubMed.
- P. Zheng, R. Hao, J. Zhao, S. Jia, B. Cao and Z. Zhu, J. Mater. Chem. A, 2014, 2, 4907–4911 CAS.
- L. Pan, J. J. Zou, S. Wang, X. Y. Liu, X. Zhang and L. Wang, ACS Appl. Mater. Interfaces, 2012, 4, 1650–1655 CAS.
-
(a) M. D'Arienzo, J. Carbajo, A. Bahamonde, M. Crippa, S. Polizzi, R. Scotti, L. Wahba and F. Morazzoni, J. Am. Chem. Soc., 2011, 133, 17652–17661 CrossRef PubMed;
(b) M. M. Maitani, K. Tanaka, D. Mochizuki and Y. Wada, J. Am. Chem. Soc., 2011, 2, 2655–2659 CAS;
(c) T. Tachikawa, S. Yamashita and T. Majima, J. Am. Chem. Soc., 2011, 133, 7197–7204 CrossRef CAS PubMed.
-
(a) C. H. Kang, L. Q. Jing, T. Guo, H. C. Cui, J. Zhou and H. G. Fu, J. Phys. Chem. C, 2009, 113, 1006–1013 CrossRef CAS;
(b) G. H. Tian, H. G. Fu, L. Q. Jing, B. F. Xin and K. Pan, J. Phys. Chem. C, 2008, 112, 3083–3089 CrossRef CAS;
(c) B. Liu, L. Liu, X.-F. Lang, H.-Y. Wang, X. W. Lou and E. Aydil, Energy Environ. Sci., 2014 Search PubMed.
- M. A. Butler, J. Appl. Phys., 1977, 48, 1914–1920 CrossRef CAS PubMed.
- H. Lin, L. Li, M. Zhao, X. Huang, X. Chen, G. Li and R. Yu, J. Am. Chem. Soc., 2012, 134, 8328–8331 CrossRef CAS PubMed.
Footnote |
† Electronic supplementary information (ESI) available: See DOI: 10.1039/c4ra13596b |
|
This journal is © The Royal Society of Chemistry 2015 |
Click here to see how this site uses Cookies. View our privacy policy here.