
Box–Behnken designed adsorption based elution – unique separation process for commercially important acetyl shikonin from Arnebia nobilis†
Shankar Subramaniam,
Anbumathi Palanisamy and
Aravind Sivasubramanian *
*
School of Chemical and Biotechnology, SASTRA University, Thanjavur 613402, India. E-mail: arvi@biotech.sastra.edu
First published on 16th December 2014
Abstract
Acetyl shikonin (AS), a pharmaceutically and commercially important compound, is a minor constituent in the industrial crop Arnebia nobilis. A Box–Behnken optimized, robust separation technique for AS was established by an adsorption based elution method. Optimized yields depict an increase of 78.9% total recovery of AS (97.8% pure), compared to conventional chromatography.
Naphthoquinones like shikonin and alkannin have been timelessly proved to be potent compounds harbouring a plethora of bioactivities and many are commercially important.1 Arnebia nobilis roots contain naphthoquinones and are one of the plants in the traditional Indian medicinal formulation called ‘Ratan Jot’.2 A nobilis is called as ‘seemai-vembalampattai’ in Tamil, and is used as a traditional folk medicine for antimicrobial activity.3 This plant is widely found in India4 and has been reported to have wound healing properties,5 due to the presence of shikonins and alkannins. The phytochemistry of the plant has been well documented, the naphthoquinone β,β-dimethylacryl shikonin is present as a major compound along with acetyl shikonin and other quinone derivatives.6
The compound acetyl shikonin (AS) (Fig. 1) is an important member of shikonins and it finds abundant use in food colouring and dye stuff industry.7 AS is a plant pigment which is known to be anti-microbial,8 anti-inflammatory9 anti-ulcerogenic10 and anti-tumorigenic molecule.11 It is also used commercially for healing wounds in Greece and Japan.12 Because of its varied use, it would be of good use if a simple, efficient method can be developed for the isolation of the minor constituent AS, without compromising on purity. AS has been previously isolated from many plants through conventional solvent extraction and chromatography procedures.1 However, separation through conventional methodologies leads to large scale use of solvents, longer separation time13 and higher cost14 of isolation. Therefore, unique techniques that specifically isolate single desired pigment molecules are required in modern commercial separation processes, apart from yield and purity.
 | ||
| Fig. 1 Acetyl shikonin. | ||
Response surface methodology (RSM) is a versatile statistical technique extensively applied to solve, model and enhance tedious optimization problems involving numerous influential factors.15 Apart from central composite design (CCD) and face centered central composite design (FCCD), one of the most commonly used rotatable models for second order polynomial equations and fitting is Box–Behnken design (BBD). A BBD experiment is often utilized to study the influence of various process parameters (independent variables) on the overall outcome of the process (dependent variable/response). Controlled preliminary experiments are performed to identify these independent variables that affect the process that needs to be optimized through a statistical experimental design. Box–Behnken design is one such quadratic experimental design which belongs to a class of response surface designs. It is a well-known method and an effective design practice involving lower number of experimental runs and model fitting thus economizing the time and resources needed for experimental processes as is routinely used in many optimization studies.16 BBD is an efficient option and important substitute to the CCD, where researchers in their studies require preferring three evenly spaced levels. The spherical nature of the BBD, combined with the fact that the designs are rotatable or near-rotatable, makes it widely applied for optimizing separation processes for molecules from plants.17
The present study involves development of a novel technique called ‘Adsorption based elution’ for efficient separation of the biologically active molecule, AS. The developed isolation technique operates on the principle of the adsorption of the A. nobilis plant extract on activated carbon and then selective desorption of AS using isopropanol (IPA), as a “green” solvent. The technique developed was later improved by applying RSM to the operational parameters leading to optimized yield and purity. Adsorption isotherms were studied to explain the adsorption scenario, involved in the developed technique. To the best of our knowledge, there has been no previous report on use of similar separation technique for isolation of plant pigments.
The efficiency of the developed separation technique was checked based on series of preliminary experiments and the whole process was optimized for maximum recovery of pure AS. Hexane extract (HE) was prepared from authenticated plant material (root bark) of A. nobilis. The best adsorbent was selected based on a preliminary adsorption experiment with hexane extract.† The isotherm models with single solute (AS) and multi-solute (HE) were compared and differences in adsorption capacities were observed.† The various experimental conditions are given in Table 1. Activated carbon (10 g l−1) (particle size: 200–325 mesh size; surface area: 750 m2 g−1) was added to solution containing 500 mg of hexane extract solubilized in 100 ml of 30% IPA in water (v/v). The experiment was maintained at room temperature with agitation of 100 rpm for 90 min. After equilibration, excess solution was aspirated out and pure water was added. Separation of pigment molecules was done by addition of increasing concentrations of IPA in water (10–100% [v/v]). The contact time for desorption was maintained as 30 min. The pigment separated in different IPA/water ratio was analysed through High Performance Thin Layer Chromatography (HPTLC). The ratio which yielded pure AS was used for modelling studies.
| Parameter | AS | ASHE |
|---|---|---|
| a AS-acetyl shikonin, ASHE-acetyl shikonin in hexane extract, r-correlation coefficient. | ||
| Langmuir isotherm | ||
| Q (mg g−1) | 36.52 | 5.23 |
| KL (l g−1) | 25.97 | 20.67 |
| R | 0.99 | 0.99 |
![[thin space (1/6-em)]](https://www.rsc.org/images/entities/char_2009.gif) |
||
| Freundlich isotherm | ||
| Kf (l g−1) | 19.95 | 6.91 |
| N | 4.76 | 5.56 |
| R | 0.88 | 0.81 |
The influential parameters were identified from classical optimization experiments based on their effect on target response (yield of AS). Consequently, only parameters such as amount of activated carbon (AC), desorption time and percentage of IPA/water (v/v) (3 factor) at 3 levels (−1, 0, +1) from their scanned range were considered for Box–Behnken method based experimental design to obtain the standard set of experiments for RSM based modelling and optimization. Stirring speed was maintained at 150 rpm and neutral pH for all the experiments. 3 factors and 3 levels Box–Behnken design generated 15 set of experiments/runs which were carried out with 3 replicates and the average is depicted in Table S1.†
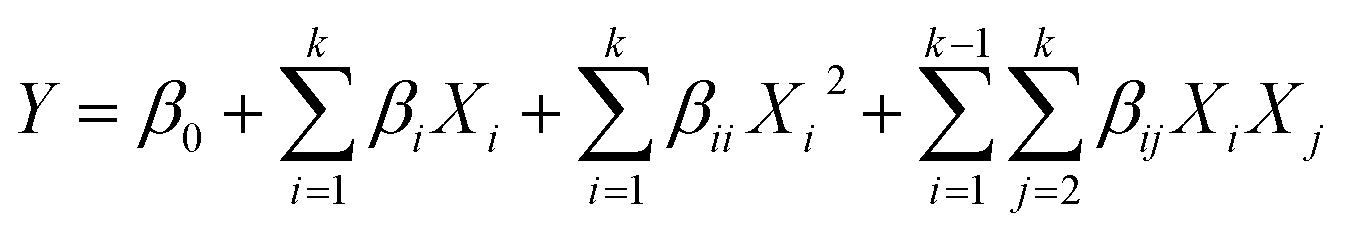
Experimental data thus obtained were fitted in second-order polynomial model and regression coefficients were determined as in eqn (1).
 | (1) |
A final run of experiment with the RSM optimized parameters was performed and the yield and purity of AS was analysed through HPTLC.
Activated carbon (AC), a highly commercialized adsorbent of industrial dyes was selected. Later, specific grade of AC was selected based on experiments which used two grades of AC (A & B) with different properties (particle size: 200–325 mesh size and surface area: 750 m2 g−1 for A, particle size: 100–325 mesh size and surface area 600 m2 g−1 for B). It is evident from Fig. S1† that AC with surface area 750 m2 g−1 worked well in adsorbing pigments from solvent extract of plant material. Grade A needed 35 min to completely adsorb all pigments (99%), whereas B needed 50 min. Thus, grade A was selected as desired adsorbent for further optimization studies.
Pigments (adsorbates) adsorb to adsorbents in a particular solvent system that favours maximum adsorption. Later, higher concentrations of the same solvent could be used to desorb the pigments. Such practices are usually used in dye effluent treatments.18 In current study, the same principle of adsorption/desorption was utilized for specific removal of single pigment molecule. Initially, pigments from solvent extract were dissolved in suitable solvent mixture containing 30% IPA in water (v/v). This solvent ratio completely solubilizes and also aids in the adsorption process once this pigment solution is stirred along with adsorbent. Since, the dyes extracted are water immiscible, the higher presence of water in solution drives the pigments to get adsorbed onto adsorbent. Once adsorption is over, selective desorption occurs, because of the high affinity of IPA to knock out the pigment molecules from adsorbent. When the IPA concentration in water is 70% (v/v), pure AS is eluted out, and is depicted in Fig. 2. IPA, a “green” solvent19 is ideal for this process because it has a relative lower polarity index of 3.9,20 than other alcohols, and is miscible with water and solubilizes the pigments in current study.
 | ||
| Fig. 2 Adsorption based elution of acetyl shikonin. (A) Extract with adsorbent (AC) before adsorption, (B) extract with adsorbent after adsorption (C) acetyl shikonin eluted with 70% IPA in water (v/v) after 30 min of desorption. | ||
AS thus obtained, was as a red amorphous powder and had a molecular formula of C18H18O6, implying ten degrees of unsaturation, as established by LC-MS. The proton and carbon NMR data were in complete concurrence with the literature.21
The ambiguity in the compound being either an alkannin or a shikonin derivative was resolved with optical rotation studies. The specific rotation [α]20D of AS was found to be +456 (c 0.1, CHCl3), corroborating with the literature reports21 (Fig. S2–S4†).
In this study, the kinetics of adsorption of AS in HE (multisolute interactions) on the capacity of AC was investigated. Fig. S5† gives conventional plots of the liquid phase pigment concentration versus solid phase pigment concentration. The adsorption data obtained were correlated to two commonly used equilibrium isotherm models: Langmuir (eqn (2)); Freundlich (eqn (3));22
 | (2) |
| qe = KfCe1/n | (3) |
The adsorption rates and kinetics differ for a solute in a single solute and multi-solute systems. Since, solvent extracts from plant material contains mixture of pigments, it is imperative to suggest that AS follows the adsorption kinetics governing the multi-solute systems. To study this kinetics, isotherms were analysed for both individual AS and HE containing AS. It was determined that amount of AS in HE was 26% (HPTLC). Experiments were conducted under identical conditions where AS (single solute) with concentration range 50–750 mg l−1 and for HE (50–1500 mg l−1) containing initial concentration of AS (10–375 mg l−1) as determined by HPTLC. As expected, the amount of AS adsorbed to AC was reduced by 85% in HE system than in single system containing the AS pigment alone. Isotherm studies show that adsorption of AS as a single solute is better than in multi-solute system. This is due to predominance of other pigments that is available in extract (∼74%). This minority of AS with respect to other pigments in total concentration, indeed aids in successful desorption of pure AS firstly from the adsorbent pores with no elution of other pigments at 70% IPA in water (v/v). Isotherm studies indicate that the adsorption model satisfies Langmuir theory where the number of adsorption sites on AC is restricted and that the AS along with other pigments forms a monomolecular layer on the adsorbent at the adsorption saturation condition. The current adsorption kinetics does not follow Freundlich equation (eqn (3)). This is substantiated by the correlation coefficients (r2) values which are higher for Langmuir (0.99) than Freundlich (<0.9) isotherms.23 The isothermal parameters are given in Table 1.
Adsorption is a process which includes many influential parameters. Preliminary experiments were conducted with known parameters to study their effects and influential significance on adsorption/desorption of AS from HE of A. nobilis.
Initially, amount of minimum adsorbent required for complete adsorption/desorption of AS was evaluated. Varying amount of AC (2.5–12.5 g l−1) was added in pigment solutions containing 500 mg of HE at RT and 100 rpm agitation for 90 min adsorption and 30 min desorption. The minimum amount of adsorbent needed to completely separate pure AS was noted. Fig. S6† shows that 8.75 g l−1 of AC is required for complete adsorption of HE and selective desorption of AC. A quantity less than this value would affect yield and greater than this value would affect time of desorption. Later, desorption time required to selectively separate AS from AC was studied by analysing the amount of pure AS desorbed by HPTLC at different desorption time (5–60 min). Experiments were done at 8.75 g l−1 of AC at RT at 100 rpm agitation. The time which yielded maximum amount of pure AS was recorded. Fig. S6† shows that 30 min is ideal for complete desorption of AC. Desorption time less or greater than 30 min would affect yield and purity of AC respectively. Another set of experiments with optimized values of AC (8.75 g l−1) and desorption time (30 min), were repeated to find exact ratio of IPA/water (v/v) that yielded maximum amount of pure AS. Fig. S6† shows that with 70% IPA/water (v/v), AS comes out completely with significant purity. Finally, the effect of agitation was studied in desorption patterns by maintaining the experimental sets containing AC (8.75 g l−1) for 30 min at different agitation speeds (50–200 rpm). It was found that agitation speed had no effect on yield and purity of AS but only affected time needed to completely desorb pure AS, increasing agitation decreased desorption time but sometimes caused premature desorption of undesired pigments other than AS. Therefore, to determine an ideal balance between desorption time and agitation speed, agitation speeds with respect to time were recorded to reach desired yield of AS. Agitation at 150 rpm produced desired yield of AS at 30 min, and thus it was used for all optimized experiments.
Using the Box–Behnken experimental design, the second-order polynomial quadratic response equation (eqn (1)) was used to establish a mutual link between the studied parameters.24 An empirical mutual relationship between the response dependent variables and independent parameters based on the coded factors was established according to the equation below.
| Y1 = 5.17 + 0.15X1 + 0.1X2 + 0.1X3 + 0.35X1X2 + 0.15X1X3 + 0.05X2X3 − 1.21X12 − 0.36X22 − 0.51X32 | (4) |
The Box–Behnken matrix and experimental results for adsorption based elution for yield of AS are summarized in Table S1.† The suitability and significance of studied model could be better evaluated by utilizing Analysis of variance (ANOVA).25 The results of ANOVA for amount of AS are depicted in Table S2 and S3† whose statistical observations demonstrates that the regression model has a high coefficient of determination (R2 = 0.99), indicating that 99% of the variations in extraction process of metabolites could be explained by the independent factors. Also, the Radj2 (0.98) value explains significance of the model.26 There seems to be no significant difference between R2 and Radj2 values, which is desirable for the model. ‘Adeq precision’ measures the difference between signals to noise ratio, which for this model are 32.98 for AS. Since, it is greater than 4.0, it is considered as an adequate desirable value.27 Also, in the present study, F-values are greater and P values are much lesser depicted in Table S2,† implies that the coefficients obtained are significant in the model.
The coefficients and standard error(s) are depicted in Table S3.† The corresponding F-values for coefficients indicate that the IPA (X3) produces the largest effect in extracting AS in the process (F-value: 33.75, P < 0.002). It was followed by time (X2) (F-value: 15, P < 0.0017) and then amount of adsorbent (X1). This implies that IPA–water ratio is most important in optimizing the process compared to other factors. Also, the coefficients of main effects (X1 − X3) were significant compared to the interaction effects. The square effects of all the main effects (X12 − X32) are significant (P < 0.0001) for target response. In the interaction effects, all the coefficients were significant except between the IPA–water ratio: time for target response.
A three-dimensional response surface and contour graph were plotted based on obtained model equation to evaluate the interaction among the operational factors and to determine the optimum values of each parameter.28 The effects of influential parameters on yield of AS are shown in Fig. 3a–c. For example, in Fig. 3a, interaction between amount of activated carbon (A) and time (B) is plotted where, yield of AS increases as A increases from 7.5–8.75 g l−1 mol−1 and then decreases when it extends to 10 g l−1. Similarly, as time (B) reaches 30 min, the yield reaches the maximum and then decreases. This phenomenon is seen in all the surfaces drawn based on interaction effects of different factors.
 | ||
| Fig. 3 Response surface plots for yield of AS showing interaction of different process parameters. Interaction of (a) time vs. amount of adsorbent (b) IPA vs. amount of adsorbent (c) IPA vs. time. | ||
Usually numerical optimization method is used for optimization in which a desirable value for each input factor and response can be selected.11 Using these conditions, the maximum achieved amount of AS was 5.26 mg g−1 DM at 8.93 g l−1 of AC, 31 min and 72% of IPA/water (v/v) at 150 rpm agitation. This result indicates an acceptable fit among the obtained data and the desirability of the model at all points. An additional experiment was carried out to confirm the amount of AS yielded at optimized conditions (5.25 mg g−1 DM). This was in accordance to predicted value of 5.26 mg g−1 DM as in Table S4.† The final yield of 0.52% clearly substantiates a significant increase compared to initial yields of 0.11% as given in Table 2. The optimized yields depict an increase of 78.9% in total recovery of AS, further emphasizing the potential for development and optimization of adsorption based elution procedure taking into account the process economics.
Conclusions
In the present study, an active molecule with many applications, acetyl shikonin (AS) was isolated from the medicinal and industrial plant Arnebia nobilis. The isolation was done based on adsorption based elution, utilizing the potential of activated charcoal (particle size: 200–325, surface area: 750 m2 g−1) to adsorb the pigments and then selectively desorb with 70% IPA/water (v/v). The adsorption mechanism was found to follow Langmuir model as analysed by isotherm models. Optimization by response surface modelling by Box–Behnken design depicted that the amount of adsorbent (8.93 g l−1), desorption time (31 min), IPA (72% v/v in water) at agitation of 150 rpm as optimized values yielded 5.25 mg g−1 of plant dry material. The final yield of AS was 0.52% (w/w) which depicts an increase of 78.9% in total recovery of AS compared to initial yields of 0.11% (w/w) through conventional column chromatography. This developed, adsorption based elution, can open up new vistas for process development and scale up of commercial metabolite production with minimum time and labour required along with better process economics. This would in turn increase the medicinal application of acetyl shikonin in management of abnormal health conditions thereby increasing the utilization of the pigment molecule.Acknowledgements
The authors would like to thank the Management, SASTRA UNIVERSITY, for providing the necessary facilities and the TRR funding. The financial support of Department of Science and Technology, Government of India, under fast track scheme (SR/FT/CS-10/2011) is earnestly acknowledged.Notes and references
- (a) V. P. Papageorgiou, A. N. Assimopoulou, E. A. Couladouros, D. Hepworth and K. C. Nicolaou, Angew. Chem., Int. Ed., 1999, 38, 270–301 CrossRef; (b) S. Malik, S. Bhushan, M. Sharma and P. S. Ahuja, Crit. Rev. Biotechnol. DOI:10.3109/07388551.2014.961003.
- (a) A. Arora and D. Rastogi, Indian J. Fibre Text. Res., 2012, 37, 91–97 CAS; (b) A. Arora, D. Gupta, D. Rastogi and M. L. Gulrajani, Indian J. Fibre Text. Res., 2012, 37, 178–182 CAS.
- (a) A. S. Ganthi, M. Yogaraj and M. P. S. Subramanian, Natural Product Radiance, 2009, 8, 542–545 Search PubMed; (b) A. Arora, D. Gupta, D. Rastogi and M. L. Gulrajani, J. Nat. Prod., 2012, 5, 168–178 CAS.
- T. Pulliah, Encyclopaedia of World medicinal plants, 2006 Search PubMed.
- S. M. S. Chauhan, R. Singh and G. B. Ganguly, Asian J. Chem., 2003, 1791–1794 CAS.
- Y. N. Shukla, J. S. Tandon, D. S. Bhakuni and M. M. Dhar, Phytochemistry, 1971, 10, 1909–1915 CrossRef CAS.
- A. Arora, D. Gupta, D. Rastogi and M. Gulrajani, Color. Technol., 2012, 128, 350–355 CAS.
- L. Brigham, P. Michaels and H. Flores, Plant Physiol., 1999, 119, 417–428 CrossRef CAS PubMed.
- B. Singh, M. K. Sharma, P. R. Meghwal, P. M. Sahu and S. Singh, Phytomedicine, 2003, 10, 375–380 CrossRef CAS PubMed.
- A. Toker, F. Akçay, H. Aksoy, H. Süleyman, U. Özgen and H. Erdem, Turk. J. Med. Sci., 2013, 315–320 CAS.
- H.-J. Lee, H.-J. Lee, V. Magesh, D. Nam, E.-O. Lee, K. S. Ahn, M.-H. Jung, K.-S. Ahn, D.-K. Kim, J.-Y. Kim and S.-H. Kim, Yakugaku Zasshi, 2008, 128, 1681–1688 CrossRef CAS.
- I. Orhan, Biotechnological Production of Plant Secondary Metabolites, Bentham Science Publishers, 2012 Search PubMed.
- (a) G. Moorthy, S. Subramaniam, S. Murali, R. Muralidharan and A. Sivasubramanian, Der Pharma Chemica, 2014, 6, 129–134 CAS; (b) S. Subramaniam, M. Keerthiraja and A. Sivasubramanian, Rev. Bras. Farmacogn., 2014, 24, 44–50 CrossRef CAS PubMed.
- (a) C. Mahugo Santana, Z. Sosa Ferrera, M. Esther Torres Padrón and J. Juan Santana Rodríguez, Molecules, 2009, 14, 298–320 CrossRef PubMed; (b) A. E. İnce, S. Şahİn and S. G. Şümnü, Turk. J. Agric. For., 2013, 69–75 Search PubMed.
- (a) J. Prakash Maran and S. Manikandan, Dyes Pigm., 2012, 95, 465–472 CrossRef CAS PubMed; (b) B. S. Kaith, R. Sharma, S. Kalia and M. S. Bhatti, RSC Adv., 2014, 4, 40339–40344 RSC.
- G. J. Swamy, A. Sangamithra and V. Chandrasekar, Dyes Pigm., 2014, 111, 64–74 CrossRef CAS PubMed.
- (a) R. H. Myers, D. C. Montgomery and C. M. Anderson-Cook, Response Surface Methodology: Process and Product Optimization Using Designed Experiments, Wiley, 2009 Search PubMed; (b) J. He, H. Yan and C. Fan, RSC Adv., 2014, 4, 42608–42616 RSC; (c) X.-Y. Qv, Y.-Y. Guo and J.-G. Jiang, RSC Adv., 2014, 4, 42202–42210 RSC; (d) K. Selvam, M. Govarthanan, S. Kamala-Kannan, M. Govindharaju, B. Senthilkumar, T. Selvankumar and A. Sengottaiyan, RSC Adv., 2014, 4, 13045 RSC.
- A. Shajahan, S. Shankar, V. Kaviyarasan and V. Narayanan, International Conference on Green technology and environmental Conservation (GTEC-2011), 2011, pp. 238–243 Search PubMed.
- E. Yilgor, G. E. Atilla, A. Ekin, P. Kurt and I. Yilgor, Polymer, 2003, 44, 7787–7793 CrossRef CAS PubMed.
- P. C. Sadek, The HPLC Solvent Guide, Wiley, 2002 Search PubMed.
- J. Y. Kim, H. J. Jeong, J.-Y. Park, Y. M. Kim, S.-J. Park, J. K. Cho, K. H. Park, Y. B. Ryu and W. S. Lee, Bioorg. Med. Chem., 2012, 20, 1740–1748 CrossRef CAS PubMed.
- S. J. Allen, G. McKay and K. Y. Khader, Environ. Pollut., 1988, 52, 39–53 CrossRef CAS.
- Y. Al-Degs, M. Khraisheh, S. J. Allen, M. N. Ahmad and G. M. Walker, Chem. Eng. J., 2007, 128, 163–167 CrossRef CAS PubMed.
- M. Fathinia, A. R. Khataee, M. Zarei and S. Aber, J. Mol. Catal. A: Chem., 2010, 333, 73–84 CrossRef CAS PubMed.
- (a) J. L. Campos, J. M. Garrido-Fernández, R. Méndez and J. M. Lema, Bioresour. Technol., 1999, 68, 141–148 CrossRef CAS; (b) R. D. C. Soltani, A. Rezaee, H. Godini, A. R. Khataee and A. Hasanbeiki, Chem. Ecol., 2012, 29, 72–85 CrossRef.
- M. Amini, H. Younesi, N. Bahramifar, A. A. Z. Lorestani, F. Ghorbani, A. Daneshi and M. Sharifzadeh, J. Hazard. Mater., 2008, 154, 694–702 CrossRef CAS PubMed.
- S. Mannan, A. Fakhru'l-Razi and M. Z. Alam, J. Environ. Sci., 2007, 19, 23–28 CrossRef CAS.
- S. R. Senthilkumar, M. Dempsey, C. Krishnan and P. Gunasekaran, Bioresour. Technol., 2008, 99, 7781–7787 CrossRef CAS PubMed.
Footnote |
| † Electronic supplementary information (ESI) available: Description of experimental procedure, statistical data of RSM, selection of adsorbent, isotherm plots, classical optimization observations, LC-MS spectra, NMR spectra. See DOI: 10.1039/c4ra13570a |
| This journal is © The Royal Society of Chemistry 2015 |