Two series of novel 3D potentially porous heterometallic Cu–Ln coordination frameworks assembled by 3,4-pyridinedicarboxylic acid with different topologies and channels: syntheses, structures, luminescence and magnetic properties

Xuan-Wen Liua, Rui Guoa, He Liua, Ye-Qi Yua, Xi-Wei Qia, Jing-Yuan Xub and Cheng-Zhi Xie*b
aKey Laboratory of Electronic Information and Energy Materials of Qinhuangdao, Northeastern University at Qinhuangdao, Qinhuangdao, 066004, P. R. China
bTianjin Key Laboratory on Technologies Enabling Development of Clinical Therapeutics and Diagnostics (Theranostics), School of Pharmacy, Tianjin Medical University, Tianjin 300070, P. R. China. E-mail: xiechengzhi@tmu.edu.cn

Received 31st October 2014 , Accepted 19th January 2015

First published on 19th January 2015


Abstract

Self-assembly of rare earth salts, Cu(NO3)2 and 3,4-pyridinedicarboxylic acid (3,4-pdcH2) resulted in the formation of two series of 3 d–4f heterometallic coordination polymers: [Ln2Cu3(3,4-pdc)6(H2O)12mH2nCH3OH (Ln = Eu (1, m = 22, n = 0), Gd (2, m = 22, n = 0) and Tb (3, m = 15.5, n = 5)) and [LnCu(3,4-pdc)2(OAc)(H2O)3]·8H2O (Ln = Ho (4), Er (5)). Their structures have been determined by single-crystal X-ray diffraction analyses and further characterized by elemental analyses, IR spectra, PXRD and TGA. The structures of isomorphous complexes 1–3 (Form I) are constructed with irregular (4,4)-connected 2D [Cu3(3,4-pdc)6(H2O)3]n sheets pillared by Ln(H2O)4, showing an intriguing 3D 36·418·53·6 framework with the treatment of the Ln2Cu3 unit as an 8-connected node. Complexes 4 and 5 (Form II) are constructed with (4,4)-connected 2D [Cu(3,4-pdc)2(H2O)]n sheets pillared by bimetallic units Ln2(OAc)2(H2O)4, exhibiting a fascinating 3D architecture with (4,8)-connected fluorite (412·612·84)(46)2 topology. There exist different 1D channels in the polymers of Form I and Form II, in which solvent molecules are accommodated. Moreover, their luminescence and magnetic properties have been investigated.

Introduction

The rational design and construction of novel metal–organic frameworks (MOFs) has attracted great attention; MOFs with flexible or rigid microporous channels have potential applications in selective molecular recognition and separation,1 physical gas storage,2 sensors,3 ion-exchange4 and heterogeneous catalysis.5 Among these, there are extensive research interests in the assembly of 3d–4f heterometallic coordination polymers not only due to their fascinating topologies and intriguing architectures, but also their potential applications in magnetism, luminescent materials, adsorption and chemical sensing.6 The preparation of 3d–4f heterometallic microporous MOF is still a great challenge for the following reasons: (a) competitive reactions between transition and lanthanide metals chelated to the same ligand tends to homometallic complexes rather than heterometallic polymers; (b) the higher coordination numbers and versatile geometries of lanthanide frequently causes structural interpenetration that gives rise to a reduced cavity volume or even a nonporous structure.5b,7

Although it is not yet possible to prepare fully predictable 3d–4f microporous MOFs, the selective combination of metal centers, bridging ligands and co-ligands is an effective strategy for rational design and creative synthesis of desired frameworks. Thus, in designing extended porous 3d–4f MOFs, judicious selection of the properties of ligands, such as shape, functionality, flexibility, symmetry, length, and substituent group is crucial to the construction of target polymers.8 Because multidentate ligands containing N and O atoms have different affinities to transition and lanthanide metal ions, a typical approach to construct 3d–4f MOFs is reacting 3d and 4f metallic ions with a multidentate bridging ligand containing both N- and O-donor atoms. And π-conjugated organic molecules are commonly used as linkers due to their rigidity, which often prevents interpenetration of the network, and the majority of them are based on rigid backbones functionalized with multicarboxylate groups or heterocyclic groups for metal–ligand coordination. Nitrogen-containing heterocyclic carboxylate, such as pyridine-carboxylic and imidazole-carboxylic acid, as multi donor ligands, have been demonstrated to be interesting structural and versatile building blocks for producing coordination polymers, and have also been picked out to synthesize 3d–4f polymers during the past few decades.6a,c,7,9 3,4-Pyridinedicarboxylic acid (3,4-pdcH2) is an efficient ligand, which contains a number of N or O coordination sites and rich coordination modes. Polymeric structures of 3,4-pdc complexes with alkaline, transition, and lanthanide metals were reported in which the 3,4-pdc ligand has shown good multi-connecting ability resulting in diversified structures.10 Whereas, complexes based on 3,4-pdc ligand containing both lanthanide and transition metals are still rare, only a series of Ln–Ag heterometallic coordination polymers constructed from 3,4-pdc ligand have been reported.10e Herein, we report the syntheses, crystal structures, luminescence and magnetic properties of five heterometallic 3d–4f complexes [Eu2Cu3(3,4-pdc)6(H2O)12]·22H2O (1), [Gd2Cu3(3,4-pdc)6(H2O)12]·22H2O (2), [Tb2Cu3(3,4-pdc)6 (H2O)12]·15.5H2O·5CH3OH (3), [HoCu(3,4-pdc)2(OAc)(H2O)3]·8H2O (4) and [ErCu(3,4-pdc)2(OAc)(H2O)3]·8H2O (5), in which two series of Cu–Ln polymers exhibit different topologies and potentially microporous channels.

Results and discussion

Syntheses

Acting as multi-dentate ligand, 3,4-pdc possesses the capability to bridge metal centers in various coordination modes, and we got potentially porous Cu–Ln 3D framework successfully. The hydrothermal method is a very popular synthetic technique in preparing porous MOFs, while it seemed inapplicable in this 3,4-pdc 3d–4f system. From the entropic point of view, synthesis at a higher temperature could reduce terminal ancillary ligands.7 Comparing with 2,n-pdc (n = 3–6), chelating ability of 3,4-pdc is weak, thus the high coordination number of lanthanide with water or other solvent molecules seems inevitable. For synthesizing the potentially porous framework under mild condition, diffusion method was used in the self-assembly process. The synthetic strategy employed for complexes 4 and 5 in Form II was triggered after complexes 1–3 in Form I had been structurally characterized. Seeing that crystalline isomorphous complexes of Ho(III) and Er(III) in Form I could not be obtain by the same diffusion method, which probably due to the difference of lanthanide ions, we wondered whether polymers with different 3D structure could be constructed by adding another auxiliary organic ligand to replace coordinated water molecules which located on Ln(III) ion. Acetate has been used extensively in coordination chemistry and could be introduced easily into the coordination polymers by using lanthanide acetate. In the self-assembly process, acetate combined with Ln(III) ion in starting material successfully remain in the final MOF and take place of some coordinated water molecules of Ln(III) ion, thus we got another series of potentially porous 3d–4f framework in Form II (Ln = Ho(III) or Er(III)). By contract, using lanthanide acetate of Eu, Gd and Tb as reactant, we could not get crystalline product suitable for X-ray analysis. Microcrystalline solid precipitated from solution were examined by PXRD, in which polymer in Form I existed in the mixture. The structural distinctions of Form I and Form II are tentatively attributed to the introduction of acetate and the influence of different Ln cations in the construction of MOFs. Complexes 1–5 are all stable in air at ambient temperature and are almost insoluble in common solvents such as water, alcohol, acetonitrile, chloroform, acetone, and toluene, being consistent with their polymeric nature.
Crystal structures of [Eu2Cu3(3,4-pdc)6(H2O)12]·22H2O (1), [Gd2Cu3(3,4-pdc)6(H2O)12]·22H2O (2) and [Tb2Cu3(3,4-pdc)6(H2O)12]·15.5H2O·5CH3OH (3). The single-crystal X-ray analyses of complexes 1–3 reveal that they are isomorphous and crystallize in the same monoclinic space group P21/n, in which the complicated 3D structures are all built up with basic unit [Ln2Cu3(3,4-pdc)6(H2O)12]. Thus, we choose complex 1 as a representative example to describe here in detail.

The asymmetric unit of the 3D framework in 1 contains two crystallographically independent europium ions, three copper ions, six 3,4-pdc ligands and twelve coordinated water molecules (Fig. 1). Eu1(III) and Eu2(III) ions are both nine-coordinated with distorted tricapped trigonal prismatic geometry: four carboxylate oxygen atoms from two 3,4-pdc ligands and five oxygen atoms of coordinated water molecules for Eu1; five carboxylate oxygen atoms from three 3,4-pdc ligands and four oxygen atoms of coordinated water molecules for Eu2 (Fig. S1, ESI). Three crystallographically independent Cu(II) ions exhibit two different coordination geometries (Fig. S2, ESI). Cu1 and Cu3 atoms are both five-coordinated with tetragonal–pyramidal geometry, in which the equatorial plane is occupied by two N atoms and two O atoms from four different 3,4-pdc ligands, and the axial position is occupied by one water molecule. The Cu2 atom has a slightly distorted octahedron geometry with three oxygen atoms and two nitrogen atoms from four distinct 3,4-pdc ligands and one oxygen atom from coordinated water molecule. The coordination modes of 3,4-pdc in structurally characterized complexes 1–5 are summarized in Chart 1. As can be seen, the nitrogen atom always links copper atom, the 4-carboxyl group prefers connecting to copper atom in a monodentate or bidentate fashion, and the 3-carboxyl group tends to ligate lanthanide metal in a bidentate or monodentate fashion or even be free. Six 3,4-pdc ligands in 1 adopt four different coordination modes, in which three 3,4-pdc ligands adopt mode I, another three 3,4-pdc ligands adopt mode II, III and IV, respectively. Except ligand in Form IV, which link two metal ions, the other 3,4-pdc ligand all affords a three-connecting node linking three metal ions.


image file: c4ra13533d-f1.tif
Fig. 1 Local coordination environments of Eu(III) and Cu(II) ions in complex 1 (hydrogen atoms are omitted for clarity).

image file: c4ra13533d-c1.tif
Chart 1 Representations of coordination modes I–IV of 3,4-pdc.

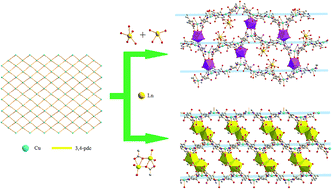
The 3D structure of complex 1 is complicated. Firstly, each Cu(II) ion connects four 3,4-pdc ligands and each 3,4-pdc ligand bridges two Cu(II) ions, forming an extended irregular (4,4)-connected 2D plane, which is composed by asymmetric unit [Cu3(3,4-pdc)6(H2O)3] (Fig. 2a). Eu(H2O)5 (for Eu1) and Eu(H2O)4 (for Eu2) spacers lay between the layers, while only Eu(H2O)4 acting as pillars to further construct the 3D infinite structure (Fig. 2b). In total, Eu1 ion is linked to four Cu(II) ions (two Cu1, one Cu2 and one Cu3) through 3,4-pdc ligands; Eu2 linked to six Cu(II) ions (one Cu1, two Cu2 and three Cu3); while every Cu(II) ion is linked to four adjacent Cu(II) ions and three (for Cu1), three (for Cu2) or four (for Cu3) Eu(III) ions, in which the different Eu⋯Cu and Cu⋯Cu distances are list in Table 2. Simplifying 3,4-pdc ligands as nodes, the connecting mode of metal ions are shown in Fig. 2c and d.


image file: c4ra13533d-f2.tif
Fig. 2 (a) 2D network constructed by [Cu3(3,4-pdc)6(H2O)3] in 1 viewed along the c axis, (b) 3D framework viewed along the a axis, purple polyhedrons represent Eu2 ions which act as pillars, (c) 2D network showing the connecting modes of Cu(II) and Eu1, 3,4-pdc ligands are simplified as nodes, (d) 3D framework showing the connecting modes of Cu(II) and Eu(III) ions, (e) the 8-connected topological structure of 1.
Table 1 Crystal data and structure refinement for complexes 1–5
Complex 1 2 3 4 5
Empirical formula C42H50Cu3Eu2N6O40 C168H344Cu12Gd8N24O232 C94H180Cu6Tb4N12O113 C64H124Cu4Ho4N8O84 C32H62Cu2Er2N4O42
Mr 1773.42 8433.15 4303.42 3263.59 1636.46
T/K 113(2) 113(2) 113(2) 113(2) 113(2)
λ 0.71073 0.71073 0.71073 0.71073 0.71073
Crystal system Monoclinic Monoclinic Monoclinic Monoclinic Monoclinic
Space group P2(1)/n P2(1)/n P2(1)/n P2(1)/c P2(1)/c
a 13.945(3) 13.958(3) 13.934(3) 10.792(2) 10.632(2)
b 30.633(6) 30.682(6) 30.722(6) 13.889(3) 13.862(3)
c 20.585(4) 20.529(4) 20.494(4) 19.739(4) 19.498(4)
β 98.79(3) 98.82(3) 98.71(3) 100.91(3) 99.98(3)
V3 8690(3) 8688(3) 8672(3) 2905.1(10) 2830.3(10)
Z 4 1 2 1 2
Dc [g cm−3] 1.355 1.612 1.648 1.865 1.920
μ/mm−1 2.222 2.333 2.441 3.525 3.788
F(000) 3508 4236 4332 1620 1624
Crystal size/mm 0.20 × 0.18 × 0.12 0.20 × 0.18 × 0.15 0.20 × 0.18 × 0.16 0.20 × 0.19 × 0.18 0.20 × 0.19 × 0.19
θ range for data 1.62–25.02° 1.33–25.02° 1.62–25.02° 1.92–25.50° 2.94–25.49°
Limiting indices h, k, l −16 to 16, −36 to 36, −20 to 24 −16 to 16, −36 to 36, −19 to 24 −16 to 16, −36 to 36, −24 to 24 −13 to 13, −15 to 16, −23 to 23 −12 to 12, −11 to 16, −14 to 23
Reflections measured 59[thin space (1/6-em)]176 65[thin space (1/6-em)]189 87[thin space (1/6-em)]730 23[thin space (1/6-em)]098 10[thin space (1/6-em)]839
Unique reflections 15[thin space (1/6-em)]079 15[thin space (1/6-em)]266 15[thin space (1/6-em)]307 5383 5239
R(int) 0.0543 0.0489 0.0490 0.0659 0.0323
Max./min. transmission 0.7764 and 0.6649 0.7210 and 0.6526 0.7584 and 0.6411 0.5539 and 0.5110 0.5330 and 0.5179
Parameters 895 1300 1246 392 439
GOF 1.068 1.070 1.032 1.252 1.039
R1, wR2 [I > 2σ(I)] 0.0402/0.1055 0.0528/0.1422 0.0612/0.1630 0.0579/0.1432 0.0344/0.0784
R1, wR2 (all data) 0.0482/0.1096 0.0606/0.1489 0.0670/0.1675 0.0665/0.1457 0.0409/0.0833
Δρ(max./min.)/e Å−3 1.590/−1.560 1.994/−1.892 2.985/−2.376 1.910/−1.494 1.238/−1.505


Table 2 Eu⋯Cu and Cu⋯Cu separation bridged via 3,4-pdc (Å)a
a Symmetry transformations used to generate equivalent atoms for 1: #1 x − 1, y, z; #2 −x + 3/2, y − 1/2, −z + 1/2; #3 −x + 2, −y, −z + 1; #4 x + 1/2, −y + 1/2, z + 1/2; #5 x − 1/2, −y + 1/2, z + 1/2; #6 −x + 5/2, y − 1/2, −z + 1/2.
For Eu1
Eu(1)⋯Cu(1) 7.670(2) Eu(1)⋯Cu(1)#1 7.746(2)
Eu(1)⋯Cu(2) 6.747(1) Eu(1)⋯Cu(3)#2 6.816(1)
[thin space (1/6-em)]
For Eu2
Eu(2)⋯Cu(1)#3 6.909(1) Eu(2)⋯Cu(2) 6.945(2)
Eu(2)⋯Cu(2)#4 6.933(1) Eu(2)⋯Cu(3) 8.598(1)
Eu(2)⋯Cu(3)#5 7.706(2) Eu(2)⋯Cu(3)#4 7.706(2)
[thin space (1/6-em)]
For Cu⋯Cu
Cu(1)⋯Cu(2) 8.909(2) Cu(1)⋯Cu(2)#3 8.783(2)
Cu(1)⋯Cu(3)#2 8.863(2) Cu(1)⋯Cu(2)#6 8.972(2)
Cu(2)⋯Cu(3) 8.873(2) Cu(2)⋯Cu(3)#6 8.911(2)


A better insight into the nature of this intricate framework can be achieved by the application of a topological approach, i.e. reducing multidimensional structures to simple nodes and connection nets. If we select metal ions as nodes, this 3D architecture can be simplified as a 5-nodal (4,6,7,7,8)-connected net with Schläfli symbol of (34·42)(35·42·52·66)(35·45·56·66)(36·46·56·63)(412·612·84) based on the analysis with TOPOS 4.0 (Fig. S3),11 which has not been reported as far as we know. If treating the [Eu3Cu2] units as individual nodes, this network can be considered as an 8-connected (also see Fig. 2c and d) hex hexagonal primitive topology with a Schläfli symbol of (36·418·53·6) (Fig. 2e), which is also be analysized using TOPOS 4.0. Indeed, the metal–organic frameworks based on nets with coordination numbers ≥8 are rare12 and very few cases have been found with this topological notation.13

Interestingly, the view along the a axis (Fig. 2 and S3, ESI) shows S-shape channels and smaller hexagonal channels, which are filled with a mass of guest water molecules. As shown in Fig. 3, the dimensions of nanotube which encircle S-shape channel is about 19.5 × 16.9 Å (calculated between opposite metal atoms), showing a 56-member ring (56MR) comprising 2Eu, 6Cu, 32C, 4N and 12O atoms (C, N and O come from eight 3,4-pdc). To the best of our knowledge, 56MR have not been previously reported. In addition, two opposite Eu(H2O)5 moieties extend into the void surrounded by 56MR, forming S-shape channel. The PLATON14 program reveals that the voids in complex 1 occupy 40.9% of the crystal volume (after the removal of the guest water molecules).


image file: c4ra13533d-f3.tif
Fig. 3 The cross section of the nanotube for 1, which shows 56MRs.

Complexes 2 and 3 posses the similar topology structure and channel with 1, in which the voids occupy 40.9% and 41.6% of the crystal volume, respectively. S-shape channels and smaller hexagonal channels are all filled with a mass of guest water molecules as shown in Fig. S5 for complex 2. The Ln–O distance decreases with increasing lanthanide atomic number (Eu–O 2.415(2)–2.544(2) Å, Gd–O 2.409(2)–2.541(2) Å and Tb–O 2.334(2) −2.527(2) Å), which is interpreted as a result of the lanthanide contraction. As a result, the cell volume of the latter complex is slightly smaller than the former.

Crystal structures of [[HoCu(3,4-pdc)2(OAc)(H2O)3]·8H2O (4) and [ErCu(3,4-pdc)2(OAc)(H2O)3]·8H2O (5). The crystal structures of complexes 4 and 5 are isostructural, so 4 is chosen as a representative from two lanthanide compounds. The crystal structure of complex 4, as depicted in Fig. 4, is built up with asymmetric unit [HoCu(3,4-pdc)2(OAc)(H2O)3]·8H2O, which consists of nine-coordinated Ho(III) unit and five-coordinated Cu(II) unit. The Ho(III) ion is in a distorted tricapped trigonal prismatic coordination environment with a HoO9 core: four coordinated oxygen atoms derived from two 3,4-pdc ligands, three coordinated oxygen atoms from two acetate ligands and two oxygen atoms of coordinated water molecules. The Cu(II) ion is pentacoordinate in a square pyramidal coordination environment (trigonality factor τ = (αβ)/60 = 0.05, where α = 177.4(2)° and β = 174.4(2)°), in which the equatorial plane was occupied by two N atoms (N1, N2) and two O atoms (O3A, O7B; #A = 1 − x, −1/2 + y, 1/2 − z, #B = −x, −1/2 + y, 1/2 − z) from four different 3,4-pdc ligands, and the axial position was occupied by one oxygen atom (O5) from coordinated water molecule. Due to the Jahn–Teller effect, the axial Cu1–O5 distance (2.301(7) Å) is larger than the other Cu–O distance (1.981(5) and 1.997(5) Å). Both of 3,4-pdc ligands adopt a quadridentate chelating–bridging mode to chelate one Ho(III) ion and link two Cu(II) ions (Mode I in Chart 1). Acetate ligand adopts μ3211 chelating–bridging mode to link two Ho(III) ions, which use two O donor to chelate one Ho(III) ion and also employ its one oxygen atom to link another Ho(III) ion. The Ho⋯Ho distance is 4.117(1) Å; the Ho⋯Cu distances are 7.982(2) and 7.255(2) Å; the Cu⋯Cu distances are 8.958(2) and 8.840(2) Å, respectively.
image file: c4ra13533d-f4.tif
Fig. 4 Local coordination environments of Ho(III) and Cu(II) ions in complex 4 (hydrogen atoms are omitted for clarity).

Similar to complex 1, Cu(II) ion, which bridged by four 3,4-pdc ligands, could act as 4-connected node, resulting in wavelike (4,4)-connected 2D plane, which is composed by unit [Cu(3,4-pdc)2(H2O)] (Fig. 5a). The planes packing along the c axis are further linked by dinuclear Ho(III) units to result in a 3D coordination framework (Fig. 5b). The resulting 3D framework bears two types of rhomboid channels viewed along the a and b axes, which are all filled with lattice water molecules (Fig. S6, ESI).


image file: c4ra13533d-f5.tif
Fig. 5 (a) 2D network constructed by [Cu(3,4-pdc)2(H2O)] in 4 viewed along the c axis, (b) 3D framework viewed along the b axis, yellow polyhedrons represent Ho(III) ions which act as pillars.

Cross sections (Fig. 6) shows that potentially porous channels along a and b axes are all encircled by 4Ho, 2Cu, 2 acetate and four 3,4-pdc (dimensions of nanotubes are about 16.2 × 9.3 and 11.7 × 8.4 Å, calculated between opposite metal atoms). The difference is that neighbouring Ho(III) and Cu(II) ions are linked through NC2(COO) spacer of 3,4-pdc around the former channel, while in the latter neighbouring Ho(III) and Cu(II) are linked through C2(COO)2 spacer of 3,4-pdc. The void volumes of the channels without the guest molecules, calculated by PLATON, are 34.4% for 4 and 32.8% for 5, respectively.


image file: c4ra13533d-f6.tif
Fig. 6 Cross sections of the potentially porous channels along the a axis (a) and b axis (b) for 4.

To get further insight into the structure of 4, a topological analysis of this 3D framework was performed. As shown in Fig. 7, one dinuclear Ho(III) unit is surrounded by four 3,4-pdc, two acetate anions and four aqua ligands, which connects eight Cu(II) ions. Therefore, we could defines the bimetallic Ho(III) unit as a eight-connected node. Likewise, although a Cu(II) ion connects eight Ho(III) ions through 3,4-pdc ligands, it actually serves as a four-connected node because two holmium metal atoms bridged by 3,4-pdc constitute a bimetallic core and should be considered as one. As discussed above, the structure of complex 4 is binodal with eight-connected (dinuclear Ho(III) unit) and four-connected (Cu(II) ion) nodes. The framework can be rationalized by considering the shortest circuits starting and ending at dinuclear Ho(III) unit and Cu(II) ion, leading to the formation of a fluorite (412·612·84)(46)2 topology.


image file: c4ra13533d-f7.tif
Fig. 7 (a) View showing that the binuclear Ho(III) unit can be simplified to a eight-connected node, (b) schematic representation of the fluorite (412·612·84)(46)2 topology in 4.

Powder X-ray diffraction and thermal gravimetric analyses

Powder X-ray diffraction (PXRD) analyses were performed on crystalline powders of 1–5. The experimental PXRD patterns are consistent with the corresponding simulated ones from the singlecrystal data, which confirms the phase purity of the products (Fig. S7 and S8, ESI). For complexes 2–5, simulated PXRD patterns were got from singlecrystal data containing all the crystalline water molecules by the MERCURY software. For complex 1, the scattering from the highly disordered solvent molecules was removed from singlecrystal data, while the simulated PXRD patterns of isomorphous complexes 1–3 are all very similar.

To examine the thermal stability and dehydration properties of these potentially microporous MOFs, thermal gravimetric analysis (TGA) were measured on crystalline samples of 1–5 under nitrogen atmosphere from room temperature to 750 °C (Fig. S9, ESI). Complexes 1–3 showed similar TGA curves, while 4 and 5 showed similar curves, so complexes 1 and 4 are employed as representatives. The TGA curves indicate that the lattice and coordinated water molecules are removed in a single step in the temperature range 65–180 °C (found, 29.1%; calculated, 29.2%) for polymer 1 and 70–195 °C (found, 23.8%; calculated, 24.4%) for polymer 4, respectively. The weight loss above 305 °C (for 1) and 295 °C (for 4) is sharp, indicating the decomposition of organic ligands. After decomposition of complexes at high temperature, the weight of residue are responded to Eu2O3·3CuO for 1 (found 28.3%; calcd 28.1%) and 1/2Ho2O3·CuO for 4 (found 33.1%; calcd 32.9%), respectively.

Photoluminescence properties

The ultraviolet and visible spectra of complexes 1–5 show strong absorption signals at 270 nm, which may be attributed to electronic transition of the ligand itself. The photo luminescence properties of solid samples of ligand and complexes were investigated. The free 3,4-pdcH2 ligand presents a weak fluorescence band with a maximum at 338 nm under excitation at λ = 270 nm, which could be attributed to the π → π* intraligand fluorescence. Complexes 1, 3, 4 and 5 emit moderately intense luminescence bands with a maximum at about 365 nm, upon irradiation with a wavelength of 270 nm (see Fig. S10, ESI), which originate from intraligand π → π* transition of typically conjugated organic system, but is red-shift to the near visible region. The enhancement of luminescence may be ascribed to a ligand chelating to the lanthanide center, which effectively increases the rigidity of the ligand and reduces the loss of energy by radiationless decay.15

Complex 1 shows strong emission when excited with 271 nm radiation and the five characteristic emission bands in visible region can be seen from the emitting spectrum of 1. The most intense band at 618 nm is assigned to a 5D07F2 f–f transition, while the four relatively weak bands at 580, 593, 652 and 699 nm are assigned to 5D07F0, 5D07F1, 5D07F3 and 5D07F4 transitions, respectively (Fig. 8). The intensity radio of electric dipole 5D07F2 transition to dipole 5D07F1 magnetic transition is 4.0, showing that symmetry of coordination environment of Eu(III) ions is low,16 which is in agreement with the crystal structure analysis that the Eu(III) locates at the asymmetric coordination field. The appearance of the symmetry-forbidden emission 5D07F0 at 580 nm also indicates that Eu(III) ions in 1 possess the noncentrosymmetric coordination environment. The luminescence spectrum of complex 3 shows the characteristic emission of Tb(III) ion in the visible region with maximum wavelengths of 485, 545, 585 and 621 nm, respectively, which are attributed to 5D47F6, 5D47F5, 5D47F4 and 5D47F3 transitions of Tb(III) ion, respectively. This luminescent phenomenon was also observed in other reported terbium complexes.17 5D47F5 is the most intense transition showing strong green light, which has the largest probability for both electric-dipole and magnetic-dipole induced transitions.


image file: c4ra13533d-f8.tif
Fig. 8 Solid-state photoluminescence spectra of complexes 1 and 3 at room temperature.

Magnetic properties

Variable-temperature magnetic susceptibility data at the magnetic field of 1000 Oe in the temperature of 1.8–300 K were collected for complexes 1–5.

Fig. 9 shows the temperature dependence of the χM and χMT curves for complex 1. At 300 K, the χMT value of 1 is 3.94 cm3 K mol−1, which is much larger than the calculated value of 1.125 cm3 K mol−1 expected for three independent Cu(II) ion and two independent ground-state Eu(III) ions (J = 0, S = 3, L = 3, 7F0, 0 cm3 K mol−1). The disagreement should be ascribed the presence of thermally populated excited states, as is well-known for Eu(III) complexes (the expected value 1.5 cm3 K mol−1 for one Eu(III) ion calculated by Van Vleck at 293 K).18 There is a continuous decrease in the values of χMT as the temperature is lowered from 300 to 12 K, at which the χMT product reaches a minimum value of 1.69 cm3 K mol−1. It should be attributed to the depopulation of the levels with nonzero J values. Upon further lowering the temperature, χMT increases dramatically to reach a value of 2.42 cm3 K mol−1 at 1.8 K. The 1/χM data above 100 K obey the Curie–Weiss law [χ = C/(Tθ) with C = 5.56 cm3 K mol−1, θ = −114.8 K] (Fig. S11, ESI). The large negative Weiss constant may reveal the antiferromagnetic couplings within the molecule.


image file: c4ra13533d-f9.tif
Fig. 9 Temperature dependence of χM (○) and χMT (▽) for 1, the solid line represents the best fit curve based on the equations indicated in the text.

Obviously, a strictly theoretical treatment of magnetic properties for such a complicated 3D system cannot be carried out. However, to obtain a rough quantitative estimate of the magnetic interaction parameters between paramagnetic species, we assume that the total magnetic susceptibility χtot is given by the sum of the isolated Cu(II) and Eu(III) ions. The temperature dependence of the χM can be reproduced by eqn (1)–(3), which take into account the seven states 7F0, 7F1, 7F2, 7F3, 7F4, 7F5 and 7F6 generated by the interelectronic repulsion and spin–orbit coupling.19 N, β, k and g have their usual meaning and λ is the spin–orbit coupling parameter. Then the zJ′ parameter based on the molecular field approximation is introduced (eqn (4)) to roughly simulate the magnetic interactions between the paramagnetic species.18a,20

 
image file: c4ra13533d-t1.tif(1)

image file: c4ra13533d-t2.tif
where
 
x = λ/kT (2)
 
χtot = 2χEu + 3χCu (3)
 
χM = χtot/[1 − zJχtot/Ng2β2] (4)

The best fitting for the experimental data gives λ = 226 cm−1, zJ′ = 1.29 cm−1, gCu = 2.09. The agreement factor R = ∑(χobsdχcacld)2/∑(χobsd)2 is 1.06 × 10⁻³. The obtained λ = 226 cm−1 is close to those reported previously,19a,21 which could be comparable to the value (263 cm−1) deduced from the energy difference between the ground state 7F0 and the lowest-lying split component of 7F1 caused by the crystal field perturbation.

The value of χMT of 2 at 300 K is 17.17 cm3 K mol−1, which is slightly higher than the expected value of 16.885 cm3 K mol−1 for two isolated Gd(III) ions in the 8F7/2 ground state with an isotropic g value of 2.00 (C = 7.88 cm3 K mol−1) and three isolated Cu(II) ions (S = 1/2, g = 2.0, C = 0.375 cm3 K mol−1). While the temperature decreases, the χMT value remains roughly constant down to 50 K and then it increases and reaches maximum of 17.90 cm3 K mol−1 (Fig. 10). The fitting of experimental data with a Curie–Weiss law leads to C = 17.13 cm3 K mol−1 and θ = 0.20 K (Fig. S12, ESI). The Gd(III) ion, with an 8F7/2 single-ion (f7) ground state, does not possess a first-order orbital moment. So, the contributions of the orbital angular momentum do not need to be taken into consideration. The increase of χMT values on cooling and the existence of a positive θ value indicate the presence of weak ferromagnetic interaction between Gd(III) and Cu(II) ions in the complex.22


image file: c4ra13533d-f10.tif
Fig. 10 The plots of χMT versus T for 2 (■), 3 (●), 4 (▲) and 5 (▼).

At room temperature, the χMT product of 3 (Fig. 10) is 25.3 cm3 K mol−1, in good agreement with the expected value of 24.8 cm3 K mol−1 for 3 Cu(II) (C = 0.375 cm3 K mol−1) and 2 Tb(III) (S = 3, L = 3, 7F6, g = 3/2, C = 11.815 cm3 K mol−1). Upon lowering of the temperature, the χMT product is roughly constant down to 100 K before exhibiting a slow increase, reaching a maximum of 28.4 cm3 K mol−1 at around 15 K, then decreasing to a minimum value of 27.4 cm3 K mol−1 at 1.8 K. The profile of the χMT vs. T curve is strongly suggestive of the occurrence of two competitive phenomena. The decrease of χMT on lowering the temperature in the low-temperature region is most probably governed by the depopulation of the Tb Stark levels, while the increase of χMT at higher temperature may be attributed to a ferromagnetic interaction between Cu(II) and Tb(III).23 The plot of 1/χM versus T over the whole temperature range obeys the Curie–Weiss law with C = 24.99.23 cm3 K mol−1 and θ = 2.06 K. The C value is comparable with the two Tb(III) and three Cu(II) ions with noninteraction, and the θ value indicates that magnetic interactions between metal ions are very weak. We can not find an accurate fit of the magnetic data for this system.

Although complexes 1–3 are isomorphous, they displays different magnetic behaviors, which mainly arises from the intrinsic natures of different lanthanide ions. Due to the long distance and lack of any important magnetic pathway through pyridine carboxylate ligand, magnetic interactions between adjacent metal ions will be rather weak. The large and different magnetic anisotropy, and complicated Stark energy levels of lanthanide ions from the splitting of individual 2S+1LJ states, should be responsible for the significant differences of magnetic behaviors in these complexes.

At 300 K, the χMT product is 13.38 (for 4) and 11.26 (for 5) cm3 K mol−1 (Fig. 10), respectively, which are all slightly smaller than the expected value for one Cu(II) ion and one Ln(III) ions (Ho: 5I8, g = 5/4, C = 14.06 cm3 K mol−1; Er: 4F15/2, g = 6/5, 11.5 cm3 K mol−1). For 4, as the temperature is lowered, the χMT value decreases steadily beyond 50 K, and then decreases in a more abrupt manner, reaching a minimum value of 9.49 cm3 K mol−1 at 1.8 K. For 5, the χMT value remains almost unchanged between 300 and 100 K. As temperature further decreases, χMT value markedly reduces to 6.21 cm3 K mol−1 at 1.8 K. The magnetic behavior in the whole temperature range for two complexes obey the Curie–Weiss law (for 4: C = 13.43 cm3 K mol−1, θ = −4.57 K; for 5: C = 11.41 cm3 K mol−1, θ = −6.09 K). However, although the χMT product decreases and the values of Weiss constant are negative, it is not possible to be sure that this behavior is associated with antiferromagnetic interactions within these complexes due to the presence of strong spin–orbital coupling effects in these Ln(III) ions.

Conclusions

In conclusion, five new potentially microporous 3d–4f MOFs assembled by 3,4-pdc were synthesized, in which introduction of auxiliary acetate ligand and different Ln ions resulted in different topology network. Two series of Cu–Ln polymers were constructed with similar (4,4)-connected 2D Cu sheets and different pillared Ln(III) units, showing hex hexagonal primitive and fluorite topological structures with different channels which are filled by a mass of solvent molecules. Complexes 1 and 3 display strong characteristic emission in the visible region. Magnetic properties of complexes are very different, though the metal magnetic centers are located in the same coordination environment. These results show 3,4-pdc ligands are suitable for constructing of heterometallic frameworks with interesting structures and properties, and these polymers may have potential application in luminescent materials. The 3,4-pdc ligand with various coordination modes combining with other auxiliary ligands can potentially be utilized to constructing novel MOFs with pores and other functionalities, and corresponding work is currently underway in our laboratory.

Experimental

Materials and physical measurements

All of the reagents and solvents employed were commercially available and used directly without further purification. Analyses for C, H and N were carried out on a Perkin-Elmer 240 elemental analyzer. Infrared spectroscopy on KBr pellets was executed on a Bio-Rad FTS 135 spectrometer in the 4000–400 cm−1 regions. The as-synthesized samples were characterized by thermogravimetric analysis (TGA) on a Perkin-Elmer thermogravimetric analyzer Pyris1 TGA up to 1023 K using a heating rate of 10 K min−1 under N2 atmosphere. The powder X-ray diffraction (PXRD) patterns were measured using a Bruker D8 Advance powder diffractometer at 40 kV, 40 mA for Cu Kα radiation (λ = 1.5418 Å). The spectra of fluorescence were measured by MPF-4 fluorescence spectrophotometer with a xenon arc lamp as the light source. Variable-temperature magnetic susceptibilities were measured on a Quantum Design MPMS-7 SQUID magnetometer using an applied magnetic field of 1000 Oe.

Syntheses of the complexes

The same procedure was employed in the preparation of all heterometallic coordination polymers. In a big test tube, a mixture of Cu(NO3)2·3H2O (0.2 mmol) and 0.2 mmol lanthanide salt (Eu(NO3)3·6H2O, 90 mg for 1; Gd(NO3)3·6H2O, 92 mg for 2; Tb(NO3)3·6H2O, 91 mg for 3; Ho(CH3COOH)3·H2O, 72 mg for 4; Er(CH3COOH)3·4H2O, 83 mg for 5) in 25 mL aqueous solution was layered carefully with water–methanol mixed solvent (15 mL, in 1[thin space (1/6-em)]:[thin space (1/6-em)]1 volume ratio) and then layered with a methanol solution (25 mL) of 3,4-pdcH2 (0.4 mmol) and triethylamine (0.4 mmol). The tube was sealed and left undisturbed at room temperature. Blue block crystals suitable for X-ray analysis were obtained after one week, which were collected by filtration, washed with ethyl ether and dried in air. The yields are ca. 14% (1), 21% (2), 15% (3), 19% (4) and 25% (5) based on lanthanide salt. Elemental analysis (%) calcd for 1 (C42H86Cu3Eu2N6O58): C, 24.05; H, 4.13; N, 4.01; found: C 23.70, H 4.30, N 3.82. Calcd for 2 (C42H86Cu3Gd2N6O58): C 23.93, H 4.11, N 3.99; found: C 23.63, H 4.22, N 3.94. Calcd for 3 (C47H90Cu3Tb2N6O56.5): C 26.24, H 4.22, N 3.91; found: C 26.65, H 4.27, N 3.95. Calcd for 4 (C16H31CuHoN2O21): C 23.55, H 3.83, N 3.43; found: C 23.82, H 3.77, N 3.50. Calcd for 5 (C16H31CuErN2O21): C 23.49, H 3.82, N 3.42; found: C 23.31, H 4.01, N 3.64. IR spectra (KBr, cm−1): complex 1: 3445 (s, br), 1625 (s), 1520 (s), 1449 (m), 1399 (m), 1350 (m), 1270 (m), 1189 (m), 1090 (m), 870 (m), 774 (m), 534 (m); complex 2: 3450 (s, br), 1630 (s), 1520 (s), 1450 (m), 1400 (m), 1352 (m), 1268 (m), 1190 (m), 1090 (m), 875 (m), 775 (m), 530 (m); complex 3: 3445 (s, br), 1630 (s), 1525 (s), 1447 (m), 1398 (m), 1349 (m), 1267 (m), 1188 (m), 1088 (m), 872 (m), 775 (m), 535 (m); complex 4: 3480 (s, br), 1645 (m), 1602 (s), 1510 (s), 1392 (m), 1359 (m), 1281 (m), 1188 (m), 1158 (m), 1110 (m), 1085 (m), 870 (m), 774 (m); complex 5: 3472 (s, br), 1640 (m), 1600 (s), 1510 (s), 1395 (m), 1360 (m), 1280 (m), 1186 (m), 1160 (m), 1112 (m), 1083 (m), 870 (m), 775 (m).

X-ray crystallography

Diffraction data for 1–5 were collected at 113(2) K with a Rigaku Saturn CCD diffractometer equipped with graphite monochromated Mo-Kα radiation by using the ω-scan technique. The data were processed using CrystalClear software24 and corrected for Lorentz and polarization effects. Absorption corrections were applied by using a multiscan program. The structures were solved by direct methods and refined by full-matrix least squares based on F2 using the SHELXTL program package.25 Non-hydrogen atoms were subjected to anisotropic refinement. Hydrogen atoms were assigned with common isotropic displacement factors. Hydrogen atoms were included at geometrically calculated positions and refined using a riding model except those bonded to the oxygen atoms in water molecules, which were located on a different Fourier map. In 1, the highly disordered solvent molecules could not be satisfactorily modeled. To resolve these issues, the contribution of the electron density by the remaining water molecule was removed by the SQUEEZE routine in PLATON.14 Number of solvent water molecules in 1 was obtained by element analysis and TGA. The crystallographic data and refinement parameters of 1–5 are listed in Table 1. Selected bond lengths and angles are listed in Table S1, ESI.

Acknowledgements

This work was supported by the National Natural Science Foundation of China (no. 21371135), China Postdoctoral Science Foundation (no. 2014M551036) and Natural Science Foundation of Hebei Province under Grant (no. E2013501135).

References

  1. (a) P. Cui, Y. G. Ma, H. H. Li, B. Zhao, J. R. Li, P. Cheng, P. B. Balbuena and H. C. Zhou, J. Am. Chem. Soc., 2012, 134, 18892 CrossRef CAS PubMed; (b) Q. W. Li, W. Y. Zhang, O. S. Miljanic, C. H. Sue, Y. L. Zhao, L. H. Liu, C. B. Knobler, J. F. Stoddart and O. M. Yaghi, Science, 2009, 325, 855 CrossRef CAS PubMed; (c) H. J. Choi and M. P. Suh, J. Am. Chem. Soc., 2004, 126, 15844 CrossRef CAS PubMed; (d) L. W. Yan, Z. Wang, M. T. Chen, N. J. Wu, J. B. Lan, X. Gao, J. S. You, H. M. Gau and C. T. Chen, Chem.–Eur. J., 2008, 14, 11601 CrossRef CAS PubMed.
  2. (a) M. P. Suh, H. J. Park, T. K. Prasad and D. W. Lim, Chem. Rev., 2012, 112, 782 CrossRef CAS PubMed; (b) Y. Kubota, M. Takata, T. C. Kobayashi and S. Kitagawa, Coord. Chem. Rev., 2007, 251, 2510 CrossRef CAS PubMed.
  3. (a) G. Lu and J. T. Hupp, J. Am. Chem. Soc., 2010, 132, 7832 CrossRef CAS PubMed; (b) B. L. Chen, L. B. Wang, Y. Q. Xiao, F. R. Fronczek, M. Xue, Y. J. Cui and G. D. Qian, Angew. Chem., Int. Ed., 2009, 48, 500 CrossRef CAS PubMed; (c) B. L. Chen, L. B. Wang, F. Zapata, G. D. Qian and E. B. Lobkovsky, J. Am. Chem. Soc., 2008, 130, 6718 CrossRef CAS PubMed.
  4. (a) J. X. Ma, X. F. Huang, Y. Song, X. Q. Song and W. S. Liu, Inorg. Chem., 2009, 48, 6326 CrossRef CAS PubMed; (b) K. S. Min and M. P. Suh, J. Am. Chem. Soc., 2000, 122, 6834 CrossRef CAS.
  5. (a) F. Gándara, A. García-Cortés, C. Cascales, B. Gómez-Lor, E. Gutiérrez-Puebla, M. Iglesias, A. Monge and N. Snejko, Inorg. Chem., 2007, 46, 3475 CrossRef PubMed; (b) C. D. Wu, A. Hu, L. Zhang and W. B. Lin, J. Am. Chem. Soc., 2005, 127, 8940 CrossRef CAS PubMed.
  6. (a) Y. J. Cui, Y. F. Yue, G. D. Qian and B. L. Chen, Chem. Rev., 2012, 112, 1126 CrossRef CAS PubMed; (b) D. L. Geng, M. M. Shang, D. M. Yang, Y. Zhang, Z. Y. Cheng and J. Lin, J. Mater. Chem., 2012, 22, 23789 RSC; (c) B. Zhao, X. Y. Chen, P. Cheng, D. Z. Liao, S. P. Yan and Z. H. Jiang, J. Am. Chem. Soc., 2004, 126, 15394 CrossRef CAS PubMed; (d) C. J. Li, Z. J. Lin, M. X. Peng, J. D. Leng, M. M. Yang and M. L. Tong, Chem. Commun., 2008, 6348 RSC; (e) X. Feng, Y. Q. Feng, L. Lang, L. Y. Wang, H. L. Song and S. W. Ng, Dalton Trans., 2013, 42, 7741 RSC.
  7. B. Zhao, P. Cheng, X. Y. Chen, C. Cheng, W. Shi, D. Z. Liao, S. P. Yan and Z. H. Jiang, J. Am. Chem. Soc., 2004, 126, 3012 CrossRef CAS PubMed , and references cited therein.
  8. (a) K. Liu, W. Shi and P. Cheng, Coord. Chem. Rev., 2014 DOI:10.1016/j.ccr.2014.10.004; (b) S. Kitagawa, R. Kitaura and S. Noro, Angew. Chem., Int. Ed., 2004, 43, 2334 CrossRef CAS PubMed.
  9. (a) P. B. Glover, P. R. Ashton, L. J. Childs, A. Rodger, M. Kercher, R. M. Williams, L. Cola and Z. Pikramenou, J. Am. Chem. Soc., 2003, 125, 9918 CrossRef CAS PubMed; (b) H. S. Wang, B. Zhao, B. Zhai, W. Shi, P. Cheng, D. Z. Liao and S. P. Yan, Cryst. Growth Des., 2007, 7, 1851 CrossRef CAS.
  10. (a) A. M. Plonka, D. Banerjee and J. B. Parise, Cryst. Growth Des., 2012, 12, 2460 CrossRef CAS; (b) X. L. Wang, C. Qin, E. B. Wang, Y. G. Li, C. W. Hu and L. Xu, Chem. Commun., 2004, 378 RSC; (c) E. J. Gao, K. H. Wang, M. C. Zhu and L. Liu, Eur. J. Med. Chem., 2010, 45, 2784 CrossRef CAS PubMed; (d) M. L. Tong, J. Wang, S. Hu and S. R. Batten, Inorg. Chem. Commun., 2005, 8, 48 CrossRef CAS PubMed; (e) C. Qin, X. L. Wang, E. B. Wang and L. Xu, Inorg. Chim. Acta, 2006, 359, 417 CrossRef CAS PubMed; (f) Z. B. Han, X. N. Cheng, X. F. Li and X. M. Chen, Z. Anorg. Allg. Chem., 2005, 631, 937 CrossRef CAS; (g) X. J. Gu and D. F. Xue, CrystEngComm, 2007, 9, 471 RSC.
  11. (a) TOPOS, Version 4.0, http://www.topos.ssu.samara.ru Search PubMed; (b) V. A. Blatov, A. P. Shevchenko and V. N. Serezhkin, Acta Crystallogr., Sect. A: Found. Crystallogr., 1995, 51, 909 CrossRef.
  12. O. Delgado Friedrichs, M. O'Keeffe and O. M. Yaghi, Acta Crystallogr., Sect. A: Found. Crystallogr., 2003, 59, 515 CrossRef PubMed.
  13. P. K. Chen, S. R. Batten, Y. Qi and J. M. Zheng, Cryst. Growth Des., 2008, 9, 2756 Search PubMed , and references cited therein.
  14. A. L. Spek, J. Appl. Crystallogr., 2003, 36, 7 CrossRef CAS.
  15. (a) Z. Miskolczy, L. Biczók and I. Jablonkai, J. Phys. Chem. A, 2012, 116, 899 CrossRef CAS PubMed; (b) T. L. Esplin, M. L. Cable, H. B. Gray and A. Ponce, Inorg. Chem., 2010, 49, 4643 CrossRef CAS PubMed; (c) L. N. Jia, L. Hou, L. Wei, X. J. Jing, B. Liu, Y. Y. Wang and Q. Z. Shi, Cryst. Growth Des., 2013, 13, 1570 CrossRef CAS.
  16. (a) T. H. Zhou, F. Y. Yi, P. X. Li and J. G. Mao, Inorg. Chem., 2010, 49, 905 CrossRef CAS PubMed; (b) C. Z. Xie, B. F. Zhang, X. Q. Wang, B. Yu, R. J. Wang and G. Q. Shen, Z. Anorg. Allg. Chem., 2008, 634, 387 CrossRef CAS.
  17. (a) S. F. Tang, J. L. Song, X. L. Li and J. G. Mao, Cryst. Growth Des., 2006, 6, 2322 CrossRef CAS; (b) J. L. Song, C. Lei and J. G. Mao, Inorg. Chem., 2004, 43, 5630 CrossRef CAS PubMed; (c) J. L. Song and J. G. Mao, Chem.–Eur. J., 2005, 11, 1417 CrossRef CAS PubMed.
  18. (a) X. H. Zhou, Y. H. Peng, X. D. Du, C. F. Wang, J. L. Zuo and X. Z. You, Cryst. Growth Des., 2009, 9, 1028 CrossRef; (b) C. J. Chen, N. Wang, Y. Long, J. Y. Gao, W. P. Xie, X. R. Rana and S. T. Yue, CrystEngComm, 2013, 15, 4611 RSC.
  19. (a) M. Andruh, E. Bakalbassis, O. Kahn, J. C. Trombe and P. Porcher, Inorg. Chem., 1993, 32, 1616 CrossRef CAS; (b) T. Kido, Y. Ikuta, Y. Sunatsuki, Y. Ogawa and N. Matsumoto, Inorg. Chem., 2003, 42, 398 CrossRef CAS.
  20. (a) Y. Liao, W. W. Shum and J. S. Miller, J. Am. Chem. Soc., 2002, 124, 9336 CrossRef CAS PubMed; (b) Y. Ouyang, W. Zhang, N. Xu, G. F. Xu, D. Z. Liao, K. Yoshimura, S. P. Yan and P. Cheng, Inorg. Chem., 2007, 46, 8454 CrossRef CAS PubMed.
  21. (a) L. F. Wang, L. C. Kang, W. W. Zhang, F. M. Wang, X. M. Ren and Q. J. Meng, Dalton Trans., 2011, 40, 9490 RSC; (b) X. J. Wang, Z. M. Cen, Q. L. Ni, X. F. Jiang, H. C. Lian, L. C. Gui, H. H. Zuo and Z. Y. Wang, Cryst. Growth Des., 2010, 10, 2960 CrossRef CAS.
  22. (a) J. Xu, W. P. Sun and M. C. Hong, CrystEngComm, 2011, 13, 3998 RSC; (b) N. Xu, W. Shi, D. Z. Liao, S. P. Yan and P. Cheng, Inorg. Chem., 2008, 47, 8748 CrossRef CAS PubMed.
  23. S. S. Dhers, H. L. C. Feltham, R. Clérac and S. Brooker, Inorg. Chem., 2013, 52, 13685 CrossRef CAS PubMed.
  24. J. W. Pflugrath, Acta Crystallogr., Sect. D: Biol. Crystallogr., 1999, 55, 1718 CrossRef CAS.
  25. G. M. Sheldrick, SHELXL-97, Program for X-ray Crystal Structure Solution, Göttingen University, Germany, 1997 Search PubMed.

Footnote

Electronic supplementary information (ESI) available: X-ray structure data in CIF files for 1–5, table of bond lengths and angles, coordination environments of metal ions in 1, topologic network of 1, 3D framework showing 1D channels in 1, 2 and 4, XRD patterns, TGA curves of 1–5, the emission spectra of free 3,4-pdcH2 ligand and complexes, and other magnetic data. CCDC 1029464 (1), 1029465 (2), 1029467 (3), 1029466 (4) and 1029463 (5). For ESI and crystallographic data in CIF or other electronic format see DOI: 10.1039/c4ra13533d

This journal is © The Royal Society of Chemistry 2015
Click here to see how this site uses Cookies. View our privacy policy here.