Three-dimensional plasmonic hydrogel architecture: facile synthesis and its macroscale effective space†
Lei Ouyangab,
Lihua Zhu*a,
Jizhou Jianga,
Wei Xiec and
Heqing Tang*b
aSchool of Chemistry and Chemical Engineering, Huazhong University of Science and Technology, Wuhan 430074, P. R. China. E-mail: lhzhu63@hust.edu.cn
bKey Laboratory of Catalysis and Materials Science of the State Ethnic Affairs Commission and Ministry of Education, College of Chemistry and Materials Science, South Central University for Nationalities, Wuhan 430074, P. R. China. E-mail: tangheqing@mail.scuec.edu.cn
cDepartment of Chemistry, University of Duisburg-Essen, 45141 Essen, Germany
First published on 18th November 2014
Abstract
A three dimensional (3D) hydrogel SERS substrate decorated with Ag nanoparticles (NPs) was fabricated by in situ reduction of Ag+ ions in a polyvinyl alcohol (PVA) network. This offered tuneable, easily-operational and extremely homogeneous SERS 3D substrates composed of uniformly distributed Ag NPs. Due to its good light penetration, a macro effective space with a depth of more than one hundred micrometres in this translucent 3D network was confirmed by slice observation and depth scanning techniques. Such macro effective space may come from harvesting plasmonic effects between active Ag NP couplings in all of the x, y, and z directions, resulting in a great average field within the whole substrate region. Due to its large effective depth, the 3D hydrogel is more sensitive and more tolerant toward an out-of-focus laser position in trace detection of the sample. The free-standing and flexible structure is also employed in environmental analysis by using a portable Raman instrument, showing its promising potential for real applications.
Introduction
Surface-enhanced Raman spectroscopy (SERS) shows diverse applications in many fields, such as chemical identification,1 food safety,2 environmental protection,3 reaction mechanism studies,4 bio-imaging,5 and bio-analysis.6 Because SERS comes from the excitation of localized metal surface plasmon resonances of a substrate,7 the enhancing effect highly depends on the property of the substrate.8 The recent progress in SERS substrates is attributed to improvements in nanofabrication techniques.9 However, great challenges still remain in new strategies for the development of SERS substrates, which exhibit highly sensitive and reproducible responses and can be easily operated in practical applications.10The substrates involved in earlier studies were nanoparticles (NPs).11 Later, nanorods and nanowires were used as one dimensional (1D) substrates.12 Two dimensional (2D) substrates were nano blocks arranged orderly on a support,13 for example Ag NPs immobilized magnetic Fe3O4 NPs or SiO2 microspheres.14 Because optical scattering and light collection occur in a three dimensional (3D) volume, assembly and templating techniques can create structures that confine the electric field within the entire region of a 3D space, which is defined as a 3D substrate.15 Within the 3D volume, the greatest average field enhancement, rather than the greatest absolute field enhancement, maximizes the generation and collection of SERS signal, thus, 3D substrates provide a new strategy for more sensitive SERS performance.16
One way to prepare a 3D substrate was to decorate NPs on a 1D or 2D template.17 Examples include a 3D substrate with Au NPs on the walls of vertically aligned CNTs,18 and a 3D biomimetic substrate on bioscaffold arrays of cicada wings.19 This type of substrate requires additional supports to reinforce the 3D space. Another way involves a bottom-up method: a silver nanowire 3D structure was fabricated by a layer-by-layer assembling method,20 and a 3D nanostructure of Au nanostars on silicon pillars was obtained by sputtering.21 Although these 3D structures produced outstanding sensitivity for the SERS detection of the analytes (enhancement coefficient up to 107), they often required complex fabrication procedures, such as ion etching and sputter coating. To evaluate the real 3D space property of SERS substrates, we proposed a concept of “effective depth”, which represents the depth in 3D volume that contributes to the SERS signal collected (the difference between “effective depth” and conventional “active depth” can be found in the ESI†). For above mentioned substrates, their effective depths were limited to a few hundred nanometers (for example: 300 nm (ref. 20) and 150 nm (ref. 21)) because the support material had poor light transparency or the metal NPs were decorated in only the outermost surface layer. Therefore, these 3D substrates may be referred to as nanoscale 3D SERS substrates.
It is known that the penetration depth of lasers may expand to several millimetres in common materials.22 These nanoscale 3D SERS substrates with limited effective depth would hide the superiority of the 3D structures. If the effective depth is further increased, more plasmonic sites can enhance the excitation light trapping in the 3D structure; as a result, more target molecules and more efficient light-matter interaction in the effective volume will contribute to a greater enhancement of the imaging. Therefore, it is very important to develop new 3D structures with greater effective depths.
Noble metal NP encapsulated hydrogels may perform as a new type of 3D substrate. Bao et al. prepared a SERS substrate by using alginate gel adsorbed with Au NPs.23 Manikas et al. reported a SERS substrate in which self-assembled Au NPs were physisorbed on poly(N-isopropylacrylamide) thermo-responsive hydrogels.24 These two substrates may be considered as 2D ones because the effective Au NPs were only adsorbed on the surface but not in the bulk of the gel. Shin et al. reported Au NP-encapsulated poly(acrylic acid) gel as a SERS substrate.25 Park et al. reported bacterial cellulose hydrogels containing Au NPs for SERS analysis.26 Yao et al. prepared porous polyvinyl alcohol (PVA) dried gel with Au NPs embedded in the network.27 These gel substrates are 3D ones, which show improved reproducibility and sensitivity. However, the reported preparation methods, such as γ-ray radiation,25 bacterial synthesis,26 and dialysis followed by freeze-drying,28 often need special instruments or are time consuming. It was further noted that little attention was paid to the 3D effective volume in the 3D gel substrates, and their superiority over traditional substrates has not been demonstrated clearly by experimental results, although it was reported that the SERS effect was influenced by the gel strength28 and special environmental changes such as pH and temperature.29
In the present work, we aimed to develop a facile method of fabricating SERS substrates with good sensitivity and homogeneity, and then make use of 3D effective volume rather than nanoscale substrates for SERS detection. Here, we proposed a one-pot method for a 3D plasmonic hydrogel substrate without other reducing or crosslinking agents. As a free-standing 3D Ag NP architecture, the polyvinyl alcohol (PVA) hydrogel encapsulating uniformly-distributed Ag NPs provided a transparent plasmonic network, which gave an easy paradigm to realize 3D SERS effective volume through slice observation as well as depth scanning. For the first time, we monitored a macroscale effective depth in the range of more than one hundred micrometres in the 3D network. Such a great depth may come from harvesting plasmonic effects between active Ag particles couplings in the x, y and z directions. This 3D substrate also demonstrated a good homogeneity in both xy and xz planes, making the hydrogel more reliable and versatile for practical sensing applications. Due to the macroscale effective depth, the substrate exhibited an outstanding ability to tolerate out-of-confocal plane detection and the self-standing bulk structure was very helpful to the real application with portable Raman instruments.
Experimental
Synthetic procedures
The synthesis of the PVA–Ag plasmonic hydrogel substrate began by dissolving PVA powders in distilled water at 90 °C with stirring, followed by quickly adding a specified amount of 0.1 M AgNO3 solution. After incubating for 1 h under stirring, the sol changed in color from colorless to brown. The sol was then transferred to a 96-well plate for shaping. After cooling to room temperature, the PVA–Ag gel was put into a refrigerator to freeze at −18 °C for 2 h. After being thawed at room temperature, the PVA–Ag gel was ready for its use as a SERS substrate. Typically, the mass concentration of PVA in the sol was 15% (wt), and the concentration of AgNO3 (n, mM) in the PVA sol was varied between 0 mM and 5 mM. According to the value of n, the obtained PVA–Ag hydrogel was referred to as PVA–nAg hydrogel. For example, PVA–1Ag was obtained when n = 1 mM.Citrate–Ag sol was prepared using sodium citrate as the reducing agent in accordance with established procedures.30 Silver nitrate (19 mg) was dissolved in deionised water (100 mL) and heated to boiling. Then, sodium citrate (2 mL of a 1% solution) was added dropwise, and heating was maintained for another 30 min; afterwards, the colloid was cooled to room temperature.
Characterization techniques
The morphology and surface chemical compositions of PVA–Ag were examined with an electron microscope (HRTEM, FEI Tecnai G2 20 U-Twin, USA; FE-SEM, HITACHI SU8000, Japan) and an energy-dispersive spectroscope (EDS, EDAX-FALCON60, USA).The section cutting of the gel to obtain slices with special thicknesses was performed on a Leica CM3050 S cryostat (Leica, Germany). The temperature was set at −24 °C.
SERS measurement
All conventional Raman spectra were measured with a DXR confocal Raman Microscope equipped with a CCD detector (Thermo Fisher Scientific, USA). The 532 nm and 780 nm lasers were used as excitation sources. For the 532 nm laser, the power was 3.0 mW and the exposure time for each SERS measurement was set at 3 s with 5 accumulations in this study. For the 780 nm laser, the power was 10.0 mW and the exposure time for each SERS measurement was set at 3 s with 10 accumulations.Raman mappings and depth-scanning were conducted on a DXRxi Raman Microscope (Thermo Fisher Scientific, USA). The 532 nm laser was used as an excitation source. The laser power was 5.0 mW and the exposure time was set at 3 ms.
The detection of environmental molecules was performed on an Ezrman-M potable Raman spectrometer (Enwave Optronics Inc., USA). A 785 nm laser was used as an excitation source. The laser power was 100 mW and the exposure time for each SERS measurement was set at 3 s with 10 accumulations.
Results and discussion
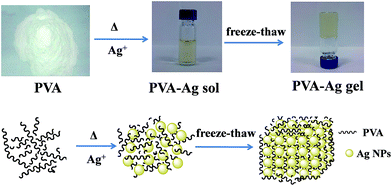
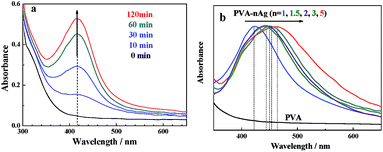
The preparation process of the PVA–Ag hydrogel is depicted in Scheme 1. PVA is a polymer that can dissolve in water by heating and stirring. A freeze–thaw operation may induce the formation of hydrogen bonds between the polymer chains, and hence a physical crosslinking hydrogel can be obtained without using other crosslinking agents.31 In the synthesis, there were two important steps in the preparation: the Ag+-reduction induced generation of Ag NPs, and the gelation of Ag NPs distributed in the PVA sol. The final product was named PVA–cAg, where c was the concentration of AgNO3 in units of mM. By monitoring the UV-visible absorption spectra of the sol, it was found that as the reduction time was prolonged, a strong symmetric absorption peak occurred at about 418 nm and increased in intensity (Fig. 1a), this was attributed to the SPR peak with Cs symmetry of spherical Ag particles.32 In addition, the maximum absorption wavelength of the Ag NPs in the sols was red shifted from 418 to 460 nm when the concentration of AgNO3 was increased from 1 to 5 mM, respectively (Fig. 1b). The red shift of the SPR peak represented an increase in the size of Ag NPs encapsulated in the hydrogel.33After the PVA and PVA–2Ag gels were freeze dried, their micromorphologies were observed by SEM as shown in Fig. 2a and b. It was easily found that the plasmonic hydrogel had a porous structure, which will contribute to the easy access and good absorptivity for probe molecules as discussed below. TEM images of the hydrogel slices were also obtained to confirm the distribution of the nanoscale particles. As shown in Fig. 2c–f, the particles with sizes of several tens nanometre were well-dispersed in the gels. The EDX spectra confirmed that these particles were Ag NPs (Fig. S1†). The size of the Ag NPs in the gels ranged from 30 to 100 nm, and there was a tendency that more and/or larger Ag NPs were formed when the concentration of AgNO3 for the preparation was higher, which was in accordance with the result observed by UV-vis spectra in Fig. 1b.
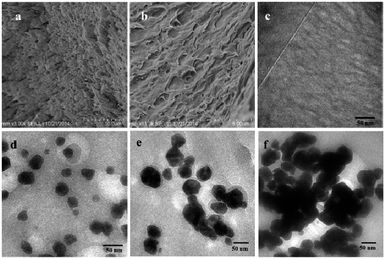 | ||
| Fig. 2 SEM images of (a) PVA, (b) PVA–2Ag gels, and TEM images of (c) PVA, (d) PVA–1Ag, (e) PVA–2Ag, and (f) PVA–5Ag gels. | ||
To evaluate the adsorption properties of PVA–Ag gels, crystal violet (CV) was used as a probe. For the measurement, a piece of weighted PVA–1Ag (150 mg) was immersed in 3.0 mL of 2.5 μM CV solution. After adsorption for a certain period of time, the gel was taken out and rinsed with water, and then subsequently subjected to Raman analysis and the rest of the solution was used for UV-vis detection. By monitoring the SERS intensity of CV (at 1619 cm−1) on the gel, it was observed that the Raman intensity was initially increased rapidly with prolonged adsorption time and then saturated beyond about 10 min (curve 1 in Fig. 3). This indicated that the adsorption of CV on the Ag NPs in the PVA–Ag gel substrate was very fast and that the saturated adsorption at 10 min was confirmed also by monitoring of the residual probe concentration through the UV-visible spectrophotometry (curve 2 in Fig. 3). The good absorptivity also comes from the excellent water absorption and swelling ability of PVA hydrogel and the porous structure by the freeze–thaw synthesis procedure.31 The fast (and strong) adsorption is a great merit of the substrate when it is used as a passive sampling sensor in practical analysis.
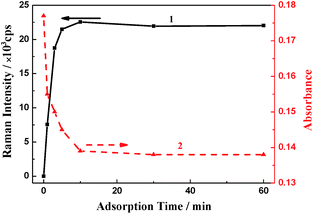 | ||
| Fig. 3 Time dependence of (1) the SERS intensity (at 1619 cm−1) of PVA–1Ag treated with 2.5 μM CV, and (2) the absorbance of the residual solution at 591 nm (the maximum absorption wavelength of CV). | ||
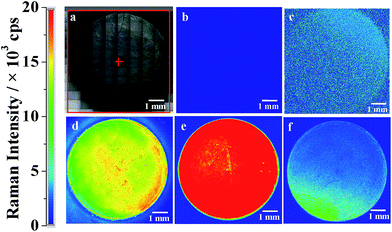
Raman mapping was carried out to study the homogeneity and spatial distribution of Ag NPs over the total cross-sectional area of the gel substrate with CV as the probe. Fig. 4 highlights the Raman intensity at 1620 cm−1 for different PVA–Ag gels. The mapping was carried out in the area of 8 × 8 mm2 with a total of 6.4 × 10⁵ measurement points (i.e., 10 × 10 μm2 resolution per measurement point) to obtain reliable statistics. The Raman maps demonstrated that the 3D substrates were SERS active across the entire substrate area, and the scattering extent of the intensity values was quite small across the entire substrate, showing excellent homogeneity.
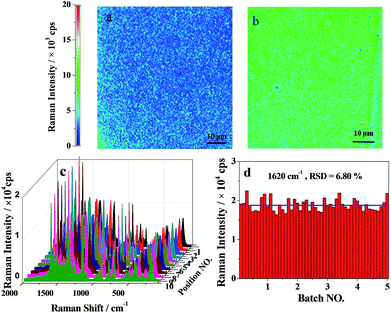
For the homogeneity in the internal part, we conducted mapping on the slices obtained from the internal part of the substrate, which also confirmed the excellent homogeneity (Fig. 5a and b). By preparing 5 batches of the gel, the point-to-point mapping was further carried out at 10 spots being randomly chosen on the gel (Fig. 5c and d). The 10 × 5 measurements (5 substrates, and 10 spots on each substrate) produced a relative standard deviation (RSD) of 6.8%. These results indicated that the preparation of the PVA–Ag gel substrate for different batches was quite reproducible, and each substrate sample had good homogeneity for the detection spots. These ensured the reliability of the SERS signal and the practicability of the substrate for real applications. The good homogeneity and reproducibility of our hydrogel substrates may be attributed to the uniform distribution of Ag NPs in the 3D space and the prevention of Ag NP aggregation by the polymer network. In contrast, in the case of Ag NP sol substrates, the uncontrollable aggregation and the coffee-ring effect during the SERS detection caused a very poor reproducibility with RSD values of 30–50% as discussed below.
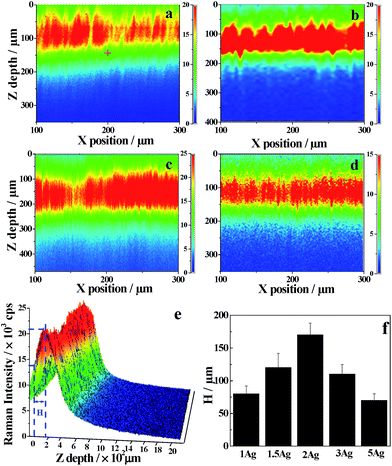
In order to investigate the effective depth of the 3D substrate, we performed depth scanning in the x–z plane. The depth from the surface plane to the depth exhibiting the highest SERS intensity was defined as the effective depth (H), which represented the depth of the 3D space that effectively contributed to the SERS signal collected at the confocal plane. It was interesting that H expanded to several hundred micrometers although traditional 3D substrates reach only several hundreds of nanometers. Fig. 6 clearly shows the distribution of Raman intensity across the x–z plane using CV (2.5 μM) as the probe. At the same z position, the intensity was indifferent to the x position, well consistent with the good homogeneity shown in Fig. 4. At the same x position, however, the intensity was increased initially, passing a maximum, and then decreased with increasing z depth. This clearly showed the contribution from 3D space. The H values were estimated as 80, 120, 170, 110 and 70 μm for PVA–1Ag, PVA–1.5Ag, PVA–2Ag, PVA–3Ag and PVA–5Ag, respectively. Similar results were obtained when 4-aminothiolphenol (4-ATP, 8 μM) was used instead of CV (Fig. S2†). The high H values also proved that the collected SERS signals were not limited to the confocal plane. In fact, the SERS signals near the confocal plane might come to the confocal plane by scattering of Ag NPs and also are possibly collected.18
As mentioned above, the effective depths of the substrates were different when different concentrations of Ag salt were used in the substrate preparation. This was because the different Ag salt concentrations led to different particle sizes and densities (as shown in Fig. 1 and 2). It was reported that larger sizes of Ag NPs (<100 nm) are favorable for electromagnetic enhancement.34 It is certain that higher particle density is favorable to the formation of more hot spots. However, a combination of large particle sizes and a high particle density may decrease the light transmittance, which will cause a decrease in the effective depth of the substrate. This makes the 3D substrate more like a 2D substrate to some extent. Consequently, the Ag salt concentration was optimal at 1–2 mM, with a higher concentration at 5 mM yielding poorer SERS responses.
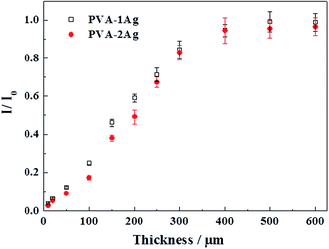
The macroscale effective space in our 3D network was further confirmed with a “top-down” strategy. Since the hydrogel substrate was a flexible, free-standing material, a series of slices with different thicknesses were obtained by employing a section cutting technique, which is commonly used in bio-tissue sections. The slices were pasted to microscope slides and then immersed in the CV solution (2.5 μM) for 30 min. After rinsing with water, the slices were subjected to Raman analysis. Fig. 7 shows the effects of substrate slice thickness on the SERS intensity (1620 cm−1 peak) of PVA–Ag captured with 2.5 μM CV. For both PVA–1Ag and PVA–2Ag, the Raman intensity linearly increased with increasing slice thickness from 10 to 350 μm, and tended to be saturated beyond 400 μm. The SERS intensity dependence on thickness was another proof for the 3D volume effect. Good linear relation between the SERS intensity and the thickness was also a proof for the homogeneity of the substrate. For the thickness being thinner than the effective depth, the SERS intensity was lower than the saturated intensity since there were not enough Ag NPs that contributed to the SERS signal. When the substrate was thick enough, the deeper space out of the effective volume would not contribute to the signal, leading to a saturation of the SERS intensity for thicknesses beyond 400 μm.
Both the depth scanning and slice observation experiments confirmed the macroscale effective depth in the proposed substrate, but the exact numerical values from the two experiments were different: ∼170 μm (Fig. 6) versus 350 μm (Fig. 7). This difference comes from the different signal acquisition modes (Fig. S3†). For depth scanning, the laser confocal plane was first at the surface, and then permeated into the hydrogel when the scanning depth (h) was increased. In the transparent architecture, both a circular truncated cone above the confocal plane and a circular truncated cone below the confocal plane contributed to the total SERS intensity collected at the confocal plane (Fig. S3a†). However, for the slice observation, the confocal plane was always set at the outermost surface of the substrate and only a circular truncated cone below the confocal plane contributed to the total SERS intensity (Fig. S3b†). If we neglect the influences of the refractive index and light attenuation in the substrate, the upper and lower circular truncated cones should be the same in volume when the maximum SERS intensity is obtained by the depth scanning mode. This suggests that the effective depth obtained from the depth scanning is about half of that obtained from the slice observation experiment, well consistent with the experimental results.
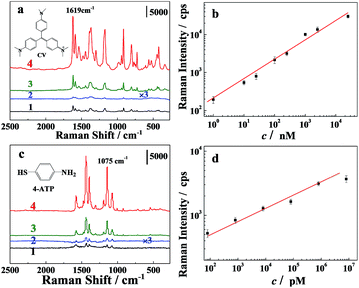
To evaluate the sensitivity of the hydrogel 3D substrate, the Raman responses of two probes, CV and 4-ATP, were acquired on a DXR confocal Raman microscope (Thermo Fisher Scientific, USA). For comparison, we also obtained the SERS spectrum with commonly used citrate–Ag sol substrate at the same conditions.30 The SERS spectrum of CV (2.5 μM) on the citrate–Ag and PVA–2Ag substrates are shown in Fig. 8a (spectra 1 and 3). A much better enhancement was obtained on PVA–2Ag. Similar detection of 8.0 μM 4–ATP instead of CV also confirmed the same (Fig. 8c). By analyzing the SERS spectra of PVA–1Ag captured with CV or 4-ATP at different concentrations, it was found that the spectral feature characteristics of CV and 4-ATP were clearly observable at trace concentrations of 1 nM and 0.8 pM, respectively. The observed detection limit was much lower than that reported in the literature (500 nM and 0.5 nM).35 Moreover, there were good linear correlations between the logarithm of Raman peak intensity of CV (at 1619 cm−1) and the logarithm of CV concentration in the range of 1–1 × 10⁴ nM, and between the logarithm of Raman peak intensity of 4-ATP (at 1075 cm−1) and the logarithm of 4-ATP concentration in the range of 102 to 1 × 10⁶ pM. These results demonstrate that the new macroscale 3D substrate provides excellent SERS performance in the quantitative analysis of organic small molecules with ultra-sensitivity.
Such a high sensitivity may be attributed to the volume effect of the macro-3D structure. It is known that the greatest absolute field enhancement at asperities, such as apexes of triangles or the corners of cubes or at the nanoscale gap (<10 nm) between dimers is most important for single molecule detection. A recent study showed that a stronger SERS response was observed from large (10–30 nm) gap distance defined by large (>150 nm) structures, which came from a large number of molecules contained in the large hot spot with a high average field enhancement.15 In our case, Ag NPs were uniformly distributed in the hydrogel network, the coupling of their electronic fields would occur in the x, y, and z directions, resulting in a high average field over the whole substrate region within the effective volume, which, together with good light transmittance, provided a great SERS enhancement.
The prominent characteristics of the novel 3D substrate will be strengthened when it is used for practical on-site applications on portable Raman spectrometers without a confocal system because more signal would be effectively collected in the transparent hydrogel by an optic fiber probe. The spectra of 4-ATP were obtained on the 3D hydrogel substrate in comparison with a commonly used citrate–Ag NPs sol substrate30 on the two different instruments. On both the confocal and non-confocal Raman instruments, the 3D substrate yielded much stronger SERS responses than the citrate–Ag sol substrate did by about 2 orders of magnitude (Fig. S4†). Moreover, when the measurements were conducted at 20 randomly-selected spots, the RSD was only about 7% on the hydrogel substrate, whereas the RSD increased to about 50% on the citrate–Ag sol substrate. During the measuring process, the gradual evaporation of water led to uncontrollable changes in intensity for the citrate–Ag sol substrate. Therefore, the hydrogel 3D substrate is a better candidate for both qualitative and quantitative detection of analytes.
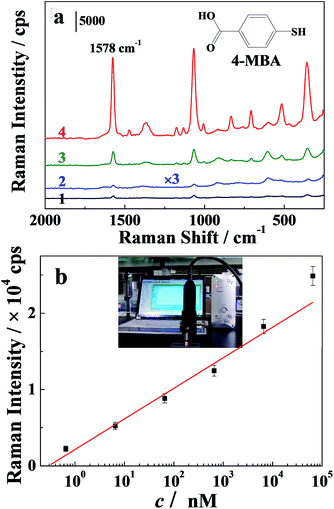
The on-site detection of environmental pollutants, 4-mercapto-benzoic acid (4-MBA) and 2,2-dipyridyl, was conducted on the portable Raman spectrometer using PVA–2Ag as the substrate. As shown in Fig. 9 (and Fig. S5†), the substrate showed excellent performance for detection, yielding a limit of detection of 65 pM and 6.4 nM for 4-MBA and 2,2-dipyridyl, respectively. A linear relation between the intensity at 1578 cm−1 of 4-MBA and the logarithm of the concentrations over the range of 10–104 nM was obtained. The self-standing substrate is very convenient for separation from the detection solution, which is preferable for on-site detection, due to its shortened detection time. Therefore, this provides a valuable tool for fast monitoring.
Conclusions
We demonstrated a green facile route for fabricating a novel macroscale 3D hydrogel substrate, which required minimal fabrication effort and offered full accessibility for practical SERS substrate synthesis. With the help of the PVA network, the in situ generated Ag NPs were uniformly dispersed in the entire substrate, which ensured excellent homogeneity and reproducibility. In particular, a macroscale effective depth was confirmed by depth scanning and slice observation, which may come from the compensate effect of Ag NPs being uniformly dispersed in the laser path, the coupling of their electronic fields would occur in the x, y, and z directions, resulting in a high average field in the entire substrate region. Such a huge effective depth made the substrate outstanding among the traditional low dimensional as well as nanoscale 3D structures, with high sensitivity and enhanced tolerance ability toward out-of-focus laser positions focused on the sample. The self-standing substrate has been successfully applied in detection of trace pollutants with both confocal and portable Raman instruments, exhibiting its potential as an effective substrate for cheap, rapid, sensitive, and reliable SERS detection and sensing. The insight into the macroscale effective space gives a promising direction for design of 3D SERS substrates for practical applications.Acknowledgements
This work was supported by the National High Technology Research and Development Program of China (863 Program) (Grant no. 2012AA06A304) and the National Science Foundation of China (Grant nos 21177044 and 21377169).Notes and references
- (a) E. C. Lin, J. Fang, S. C. Park, T. Stauden, J. Pezoldt and H. O. Jacobs, Adv. Mater., 2013, 25, 3554 CrossRef CAS PubMed; (b) M. Li, S. K. Cushing, J. Zhang, S. Suri, R. Evans, W. P. Petros, L. F. Gibson, D. Ma, Y. Liu and N. Wu, ACS Nano, 2013, 7, 4967 CrossRef CAS PubMed; (c) Y. W. Zhang, S. Liu, L. Wang, X. Y. Qin, J. Q. Tian, W. Lu, G. H. Chang and X. P. Sun, RSC Adv., 2012, 2, 538 RSC.
- (a) Y. Zhang, Y. Huang, F. Zhai, R. Du, Y. Liu and K. Lai, Food Chem., 2012, 135, 845 CrossRef CAS PubMed; (b) L. He, E. Lamont, B. Veeregowda, S. Sreevatsan, C. L. Haynes, F. Diez-Gonzalez and T. P. Labuza, Chem. Sci., 2011, 2, 1579 RSC.
- (a) E.-C. Lin, J. Fang, S.-C. Park, F. W. Johnson and H. O. Jacobs, Nat. Commun., 2013, 4, 1636 CrossRef PubMed; (b) R. Alvarez-Puebla and L. Liz-Marzan, Energy Environ. Sci., 2010, 3, 1011 RSC.
- (a) R. W. Taylor, R. J. Coulston, F. Biedermann, S. Mahajan, J. J. Baumberg and O. A. Scherman, Nano Lett., 2013, 13, 5985 CrossRef CAS PubMed; (b) W. Xie, C. Herrmann, K. Kömpe, M. Haase and S. Schlücker, J. Am. Chem. Soc., 2011, 133, 19302 CrossRef CAS PubMed.
- (a) S. Zong, Z. Wang, H. Chen, J. Yang and Y. Cui, Anal. Chem., 2013, 85, 2223 CrossRef CAS PubMed; (b) X. Qian, X.-H. Peng, D. O. Ansari, Q. Yin-Goen, G. Z. Chen, D. M. Shin, L. Yang, A. N. Young, M. D. Wang and S. Nie, Nat. Biotechnol., 2008, 26, 83 CrossRef CAS PubMed.
- (a) K. V. Kong, Z. Lam, W. K. O. Lau, W. K. Leong and M. Olivo, J. Am. Chem. Soc., 2013, 135, 18028 CrossRef CAS PubMed; (b) W. Ma, H. Yin, L. Xu, X. Wu, H. Kuang, L. Wang and C. Xu, Chem. Commun., 2014, 50, 9737 RSC.
- (a) X. Wang, M. Li, L. Meng, K. Lin, J. Feng, T. Huang, Z. Yang and B. Ren, ACS Nano, 2014, 8, 528 CrossRef CAS PubMed; (b) R. Jin, Angew. Chem., Int. Ed., 2010, 49, 2826 CrossRef CAS PubMed.
- (a) J. Ye, F. Wen, H. Sobhani, J. B. Lassiter, P. V. Dorpe, P. Nordlander and N. J. Halas, Nano Lett., 2012, 12, 1660 CrossRef CAS PubMed; (b) Y. Yao, Y. Zhou, J. Dai, S. Yue and M. Xue, Chem. Commun., 2014, 50, 869 RSC.
- (a) M. P. Cecchini, V. A. Turek, J. Paget, A. A. Kornyshev and J. B. Edel, Nat. Mater., 2012, 12, 165 CrossRef PubMed; (b) L. Su, W. Z. Jia, D. P. Manuzzi, L. C. Zhang, X. P. Li, Z. Y. Gu and Y. Lei, RSC Adv., 2012, 2, 1439 RSC.
- (a) T. K. Sau, A. L. Rogach, F. Jäckel, T. A. Klar and J. Feldmann, Adv. Mater., 2010, 22, 1805 CrossRef CAS PubMed; (b) H. Wang, C. S. Levin and N. J. Halas, J. Am. Chem. Soc., 2005, 127, 14992 CrossRef CAS PubMed.
- B. Wiley, Y. Sun, B. Mayers and Y. Xia, Chem.–Eur. J., 2005, 11, 454 CrossRef CAS PubMed.
- V. T. Cong, E. O. Ganbold, J. K. Saha, J. Jang, J. Min, J. Choo, S. Kim, N. W. Song, S. J. Son, S. B. Lee and S. W. Joo, J. Am. Chem. Soc., 2014, 136, 3833 CrossRef CAS PubMed.
- L. Polavarapu and L. M. Liz-Marzan, Phys. Chem. Chem. Phys., 2013, 15, 5288 RSC.
- (a) L. Ouyang, L. Zhu, J. Jiang and H. Tang, Anal. Chim. Acta, 2014, 816, 41 CrossRef CAS PubMed; (b) J. Jiang, L. Ouyang, L. Zhu, J. Zhou and H. Tang, Sci. Rep., 2014, 4, 3942 Search PubMed.
- K. A. Atoerzinger, J. Y. Lin and T. W. Odom, Chem. Sci., 2011, 2, 1435 RSC.
- H. Xu, J. Aizpurua, M. Kall and P. Apell, Phys. Rev. E: Stat. Phys., Plasmas, Fluids, Relat. Interdiscip. Top., 2000, 62, 4318 CrossRef CAS.
- (a) H. Tang, G. Meng, Q. Huang, Z. Zhang, Z. Huang and C. Zhu, Adv. Funct. Mater., 2012, 22, 218 CrossRef CAS; (b) R. Li, C. Han and Q. W. Chen, RSC Adv., 2013, 3, 11715 RSC; (c) A. Yang, J. L. Bi, S. C. Yang, J. Zhang, A. R. Chen and S. H. Liang, RSC Adv., 2014, 4, 45856 RSC.
- S. Lee, M. G. Hahm, R. Vajtai, D. P. Hashim, T. Thurakitseree, A. C. Chipara, P. M. Ajayan and J. H. Hafner, Adv. Mater., 2012, 24, 5261 CrossRef CAS PubMed.
- F. Shao, Z. Lu, C. Liu, H. Han, K. Chen, W. Li, Q. He, H. Peng and J. Chen, ACS Appl. Mater. Interfaces, 2014, 6, 6281 CAS.
- M. Chen, I. Y. Phang, M. R. Lee, J. K. W. Yang and X. Y. Ling, Langmuir, 2013, 29, 7061 CrossRef CAS PubMed.
- M. Chirumamilla, A. Toma, A. Gopalakrishnan, G. Das, R. P. Zaccaria, R. Krahne, E. Rondanina, M. Leoncini, C. Liberale and F. De Angelis, Adv. Mater., 2014, 26, 2353 CrossRef CAS PubMed.
- (a) V. Ntziachristos, Nat. Methods, 2010, 7, 603 CrossRef CAS PubMed; (b) S. Keren, C. Zavaleta, Z. Cheng, A. de la Zerda, O. Gheysens and S. S. Gambhir, Proc. Natl. Acad. Sci. U. S. A., 2008, 105, 5844 CrossRef CAS PubMed.
- L. Bao, P. Sheng, J. Li, S. Wu, Q. Cai and S. Yao, Analyst, 2012, 137, 4010 RSC.
- A. C. Manikas, G. Romeo, A. Papa and P. A. Netti, Langmuir, 2014, 30, 3869 CrossRef CAS PubMed.
- K. Shin, K. Ryu, H. Lee, K. Kim, H. Chung and D. Sohn, Analyst, 2013, 138, 932 RSC.
- M. Park, H. Chang, D. H. Jeong and J. Hyun, BioChip J., 2013, 7, 234 CrossRef CAS.
- S. Yao, C. Zhou and D. Chen, Chem. Commun., 2013, 49, 6409 RSC.
- S. Fateixa, A. L. Daniel-da-Sila, H. I. S. Nogueira and T. Trindade, J. Phys. Chem. C, 2014, 118, 10384 CAS.
- (a) C. Jiang, Y. Qian, Q. Gao, J. Dong and W. Qian, J. Mater. Chem., 2010, 20, 8711 RSC; (b) X. Y. Liu, C. Zhang, J. M. Yang, D. L. Lin, L. Zhang, X. Chen and L. S. Zha, RSC Adv., 2013, 3, 3384 RSC.
- P. C. Lee and D. Meise, J. Phys. Chem., 1982, 86, 3391 CrossRef CAS.
- E. Yokoyama, I. Masada, K. Shimamura, T. Ikawa and K. Monobe, Colloid Polym. Sci., 1986, 264, 595 Search PubMed.
- L. Guerrini and D. Graham, Chem. Soc. Rev., 2012, 41, 7085 RSC.
- M. Rycenga, M. R. Langille, M. L. Personick, T. Ozel and C. A. Mirkin, Nano Lett., 2012, 12, 6218 CrossRef CAS PubMed.
- Y. Zhou, X. Cheng, D. Du, J. Yang, N. Zhao, S. Ma, T. Zhong and Y. Lin, J. Mater. Chem. C, 2014, 2, 6850 RSC.
- (a) A. Kudelski, Chem. Phys. Lett., 2005, 414, 271 CrossRef CAS PubMed; (b) W. Zhai, D. Li, L. Qu, J. S. Fossey and Y. Long, Nanoscale, 2012, 4, 137 RSC.
Footnote |
| † Electronic supplementary information (ESI) available: Difference between “active depth” and “effective depth”, EDX spectrum, depth scanning for 4-ATP, Illustration of different detect modes, analyte detection. See DOI: 10.1039/c4ra13293a |
| This journal is © The Royal Society of Chemistry 2015 |

