DOI:
10.1039/C4RA13057J
(Paper)
RSC Adv., 2015,
5, 4795-4803
Anti-bacterial performances and biocompatibility of bacterial cellulose/graphene oxide composites
Received
24th October 2014
, Accepted 9th December 2014
First published on 9th December 2014
Abstract
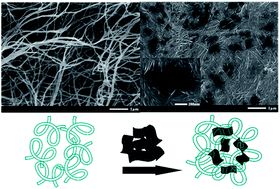
In the present work, a novel composite material formed by bacterial cellulose (BC) networks and graphene oxide (GO) nanosheets was synthesized by a sonochemical method. The BC and as-prepared BC/GO composites were characterized by several techniques including Scanning Electron Microscopy (SEM), Fourier-transform infrared (FTIR) spectra, ultraviolet-visible (UV-vis) absorption spectra, thermogravimetric analyses (TG) and X-ray diffraction (XRD). SEM images showed that the morphologies of composites became more compact than BC. FTIR, UV, TG and XRD confirmed the existence of GO in the composites. Moreover, HEK 293 cells were cultivated, and both the biocompatibility of the materials and the cell viability were demonstrated. Meanwhile, the anti-bacterial performances of BC/GO composites were evaluated with Escherichia coli (E. coli) and Staphylococcus aureus (S. aureus), which frequently cause medically associated infections. The experimental results showed that the BC/GO composites have excellent anti-bacterial activities, thus confirming its utility as a potential biomaterial in biomedical applications. Furthermore, the anti-bacterial behavior had been well explained by the extended DLVO theory.
1. Introduction
Bacterial cellulose (BC) is a polysaccharide produced by several microorganisms, particularly Acetobacter xylinus (A. xylinus). BC is becoming a promising biopolymer for several applications in the paper and food industries, sewage purification, acoustics and optics and medical fields due to its unique properties, such as high crystallinity, high mechanical strength, ultrafine fiber network structure, good water holding capacity and biocompatibility.1–3 Moreover, BC has recently been studied in biomaterials fields such as a cartilage scaffold, DNA separation medium, dental implants, nerve regeneration and vascular grafts, artificial skin and wound dressing for wounds and burns4–8 because its three-dimensional network structure enables it to incorporate antibiotics or other drugs and support their controlled release. The intrinsic properties of BC mentioned above make it an attractive novel biomaterial. However, lack of anti-bacterial activity of BC is the main issue to be tackled.9 Bacterial adhesion is the first step in the development of infections. Once bacteria attach to a surface, a multistep process starts leading to the formation of a complex, adhering microbial community that is termed a biofilm. Once a biofilm has formed, it is very difficult to treat clinically because the bacteria on the interior of the biofilm are protected from phagocytosis and antibiotics. Thereby, an alternative strategy is required to control infections. Since bacterial adhesion to biomaterial surfaces is the essential step in the process of infections, modifications to BC surfaces are considered.10,11 Different materials such as benzalkonium chloride, chitosan, sorbic acid, silver nanoparticles and ZnO nanoparticles which have been recently reported as excellent antimicrobial agents owing to their nanoscale structure and large surface area to volume ratio comparing to their bulk form9 have introduced into BC to prepare biomaterials with excellent bacteria resistance properties.12–16 However, most of them have cytotoxicity.17–19
In view of increasing bacterial resistance and good biocompatibility, graphene oxide (GO) as the anti-bacterial composite may be an effective strategy to prevent wound dressing-related infections due to its good antimicrobial activity and low toxicity. Graphene is a promising, novel, carbon-based nanomaterial with a two-dimensional structure consisting of sp2-bonded carbon atoms. It exhibits many noteworthy properties, such as large specific surface area, unique mechanical, electrical, and thermal properties, fast mobility of charge carriers, remarkable anti-bacterial properties and good biocompatibility.20,21 Due to these properties, graphene and its derivatives are considered as ideal materials for a broad range of applications, ranging from quantum physics, nanoelectronics, catalysis and engineering of nanocomposites and biomaterials.22–26 GO is an oxidized form of graphene which usually produced from natural graphite flakes by strong oxidation and subsequent exfoliation based on Hummers method.27 Compared to graphene, GO is heavily oxygenated, bearing hydroxyl, carbonyl, and epoxy groups on the basal planes and edges.28 Hence, GO is hydrophilic and yields stable dispersion in water and some polar solvents because of these abundant oxygen-containing groups, and exhibits excellent biocompatibility. There is great potential for GO in biomedical applications such as tissue engineering and drug delivery.28
In this paper, we report a sonochemical method using ultrasonication that embeds GO nanosheets into BC homogeneously without functionalizing GO. Ultrasonication is required to break up GO agglomeration in order to achieve good GO dispersion in the polymer matrix.29 The biocompatibilities were evaluated by HEK 293 cells. The anti-bacterial activities of the obtained BC/GO composites were investigated against Gram negative bacteria Escherichia coli (E. coli) and Gram positive bacteria Staphylococcus aureus (S. aureus). And the anti-bacterial behavior was explained using the extended DLVO theory.
2. Materials and methods
2.1. BC preparation
BC was prepared in a static culture medium by A. xylinum GIM1.327, which was purchased from BNBio Tech Co., Ltd, China. The method of preparing BC was well-established and described in literature.30 Briefly, in a static culture system enriched with polysaccharides, bacterial strain was incubated and was able to produce a thin layer of BC in the interface of liquid/air.31 This layer was washed by de-ionized water and then boiled in a 0.1 M NaOH solution at 80 °C for 60 min to eliminate impurities such as medium components and attached cells. BC films were further washed thoroughly with de-ionized water until pH became neutral.
2.2. Preparation of GO/BC composite films
25 mg obtained dry BC membranes were cut into small pieces and crushed by high speed homogenizer (XHF-D, Ningbo Xingzhi Biotechnology, China) in 50 mL de-ionized water at 15000 rpm for 30 min to achieve BC fiber slurry. A common Hummers method was used to synthesize a GO dispersion with a 2 mg mL−1 concentration using graphite powder provided by XFNANO Materials Tech Co., Ltd. (Nanjing, China). GO aqueous solution was added into the BC homogenate and treated by ultrasonication at supersonic power of 500 W (YQ-1003A, Ningbo Power Ultrasonic Equipment Co., Ltd., China) for 30 min under ice-water bath. The weight ratio of GO to BC was controlled to be 2 wt%, 4 wt%, 6 wt%, and 8 wt% (marked as BC/GO2, BC/GO4, BC/GO6 and BC/GO8, respectively). The homogeneous dispersions were filtered through cellulose acetate membrane filter (0.22 μm pore size, 47 mm in diameter) by filtration under negative pressure at −0.1 MPa. Finally, BC/GO composite films were freeze-dried under −40 °C for 10 h.
2.3. Characterization
A JSM-7600F Scanning Electron Microscope (SEM) operating at an accelerating voltage of 10–15 kV was used to investigate the surface morphologies of BC and BC/GO composites. The samples were coated with a thin layer of gold under high vacuum conditions (20 mA, 100 s).
Fourier-transform infrared (FTIR) spectra were recorded on a Spectrum Two Spectrometer (Perkin Elmer, USA) with the wavenumber range of 4000–400 cm−1 at a resolution of 4 cm−1. For the transmittance readings, the samples were grinded and mixed with KBr at a 1/50 ratio (w/w). This mixture (0.1 g) was then compressed into a thin KBr disc under a pressure of 0.4 bar for 3 min.
The UV-visible absorption spectra were recorded on a Lambda 950 spectrophotometer (Perkin Elmer, USA) equipped with an integrating sphere accessory for diffuse reflectance spectra over a range of 200–800 nm by using BaSO4 as the reference.
Thermogravimetric analysis (TG) was carried out by using a TA Instruments model Q5000 TGA. The samples were heated from 20 to 600 °C with a heating rate of 10°C min−1 under nitrogen atmosphere.
XRD patterns of the samples were recorded using a Rigaku Ultima III X-ray powder diffractometer, using a Cu Kα X-ray tube with a wavelength of 1.5406 Å, running at 40 kV and 30 mA, respectively. The diffraction angle ranged from 5° to 60° (2θ) with a step size of 0.02°.
2.4. Contact angles and surface free energy
Contact angles were measured using the sessile drop method with a JC2000D contact angle analyser (Powereach, China). Five contact angle measurements were made on each sample for all probe liquids including distilled water and ethylene glycol (Aladdin), and diiodomethane (Aladdin). The surface tension components of the test liquids are shown in Table 1.11
Table 1 Test liquids and their surface tension components
Surface tension (mN m−1) |
γL |
γLWL |
γABL |
γ+L |
γ−L |
H2O |
72.8 |
21.8 |
51.0 |
25.5 |
25.5 |
CH2I2 |
50.8 |
50.8 |
0 |
0 |
0 |
C2H6O2 |
48.0 |
29.0 |
19.0 |
1.92 |
47.0 |
All measurements were made at 25 °C. The contact angles of bacterial cells were measured by producing the bacteria lawns deposited on membrane filters with a pore diameter of 0.45 μm and applying negative pressure.11 Prior to contact angle measurement, the bacterial lawns were allowed to air-dry until a certain state, indicated by stable water contact angles.32 The surface energies of the prepared samples were calculated using van Oss acid–base approach.11 The surface energy is seen as the sum of a Lifshitz–van der Waals apolar component and a Lewis acid–base polar component γABi:
The acid–base polar component γABi can be further subdivided by using specific terms for an electron donor (γ−i) and an electron acceptor (γ+i) subcomponent:
|
| (2) |
The relation between the measured contact angle and the solid and liquid surface energy terms are described as:
|
| (3) |
In order to determine the surface energy components (γLWS) and parameters γ+S and γ−S of a solid, the contact angles of at least three liquids with known surface tension components (γLWL, γ+L, γ−L), two of which must be polar, have to be determined.33
2.5. Cytotoxicity tests
The HEK 293 cell line was cultured in RPMI medium supplemented with 10% FBS, 100 μg mL−1 penicillin and 100 μg mL−1 streptomycin. The cells were then incubated for 3 days in a humidified 5% CO2-containing balanced-air incubator at 37 °C.
The cytotoxicity was measured using the MTT assay method. 200 μL of HEK 293 cells, at a density of 1 × 10⁵, were placed in each well of a 48-well plate. Then the cells were incubated over night at 37 °C in a humidified 5% CO2-containing atmosphere. After that, media was discarded. BC/GO composites with same size (5 mm × 5 mm) were placed slightly on the top of cells and then fresh media was added. Wells containing only the cells were used as control. The cells were treated for another 24 h. Then the media containing sample was changed with fresh media and 20 μL of dimethyl thiazolyl diphenyl (MTT) was added and the incubation continued for 6 h. Medium was removed, and 200 μL DMSO was added to each well to dissolve the formazan. The absorbance was measured with a test wavelength of 570 nm and a reference wavelength of 630 nm. Empty wells (DMSO alone) were used as blanks. The relative cell viability was measured by comparison with the control well containing only the cells. On the other hand, one part of cells were fixed with 4% paraformaldehyde in PBS for 10 min and then incubated with 2% methanol for 10 min after treated by composites for 24 h. The cells were stained with 0.5% crystal violet in 20% methanol. Images were obtained using a microscope (Carl Zeiss, Oberkochen, Germany).
In order to further evaluate cell cytotoxicity, BC/GO composites were placed onto the bottom of the plate and then cells were seeded into the plate. The cells were treated for 24 h and followed by MTT assay to quantitate cell cytotoxicity, as described above.
2.6. Cell proliferation by real time cell analysis
For continuous monitoring the effect of BC/GO composites on cell proliferation, 1 × 10⁴ cells per well were seeded onto E-plates and incubated for 30 min to allow the cells attach to the bottom of the wells. Then the cells were treated with the BC/GO composites as described in Section 2.5. The E-plates were placed onto the Real-Time Cell Analyzer (RTCA) station (Roche, Germany). Measurements of cell impedances were performed every half an hour and continuously for 80 h.
2.7. Anti-bacterial activity
The anti-bacterial activities of the composites were investigated against Gram-negative bacteria E. coli ATCC 25922 and Gram-positive bacteria S. aureus ATCC 6538. The strains were cultured in Tryptone Soya Agar (TSA, Oxoid®, UK) plates in an incubator overnight at 37 °C, respectively. A single colony was inoculated in 20 mL Tryptone Soya Broth (TSB, Oxoid®, UK) and grown statically overnight at 37 °C. Then, 100 μL of this bacterial suspension was transferred into 100 mL TSB in a conical flask and grown in a shaker incubator at 150 rpm at 37 °C until the bacteria grew to mid-exponential phase. The required volume of bacterial suspension was centrifuged at 5000 rpm for 5 min at −4 °C, washed twice with sterile de-ionized water, and then re-suspended in the 60 mL 100 mM PBS (pre-warmed to 37 °C) into a glass tank to make a bacterial solution with a concentration of 4 × 10⁷ CFU mL−1.
In this investigation, BC/GO composites and BC (the control) were cut into disk shapes with 1 cm diameter and sterilized by ultraviolet lamp for 30 min. Then the sterilized samples were put into the tank and then the tank was put in a shaker incubator at 37 °C under a gentle stirring at 20 rpm. After a period of time (1–11 h), the samples were taken out and the bacteria adhered to each sample was removed to sterile glass beakers containing 10 mL sterile de-ionized water by ultrasonication for 5 min. 100 μL of the sonication suspension and 10−1, 10−2 and 10−3 dilutions were plated out on TSA plates and incubated overnight at 37 °C. The colonies were counted on the following day. The total number of bacteria in 100 μL of bacterial suspension was obtained for each concentration and hence the total number of bacteria as colony-forming units (CFU) cm−2 attached to the tested sample as CFU was obtained. The experiments were carried out in triplicate to confirm reproducibility.
2.8. Zeta potential and size analysis of bacteria
Zeta potentials of bacteria, assumed to be equal to the cell surface charge,34 were calculated from electrophoretic mobilities. Bacteria were re-suspended in 100 mM PBS solutions. Both zeta potentials and sizes of tested bacteria were measured five times (triplicate samples) using Malvern Zetasizer Nano-ZS.
3. Results
3.1. Surface morphology
Fig. 1 shows SEM micrographs of the surface and cross-section of BC and BC/GO composites. Fig. 1A shows the morphology of BC which exhibited a nanoporous three-dimensional network structure. There are randomly arranged fibrils and a variety of empty spaces in BC. For BC/GO composites, GO nanosheets were displayed as black sheets which can be easily found in the composites (Fig. 1B–E). The inset image in Fig. 1C is the BC/GO4 composites with higher magnification. With the increase of GO in the composites, the surface are becoming more and more compact. The morphologies of the composites with higher GO contents (BC/GO6 and BC/GO8) are shown in Fig. 1D and E. The overlapped GO nanosheets were observed because of the high concentration of GO. Fig. 1F is cross-section image of BC/GO4 composite (Fig. 1C) that exhibit a layered structure because of the vacuum application and self-ordering of high-aspect ratio GO sheets.35 The GO nanosheets can be clearly seen. Compared all these images, a random arrangement of ribbon-shaped microfibrils without any preferential orientation is displayed in BC and a denser network structure with no obvious pores for the composite is shown since GO nanosheets fill in the spaces between the fibrils.
|
| Fig. 1 SEM images of BC and BC/GO composites: BC (A), BC/GO2 composite (B), BC/GO4 composite (C), BC/GO6 composite (D), BC/GO8 composite (E), cross section of BC/GO4 composite (F). | |
3.2. FTIR spectroscopy
Fig. 2A displays the FTIR spectra of BC and BC-GO composites with different loadings of GO. In the case of BC (curve (a)), the FTIR spectrum was typical and the dominating signal is at 3200–3500 cm−1, corresponding to the intramolecular hydrogen bond for 3O⋯H–O5 and the hydroxyl groups.36,37 The peak at 1163 cm−1 corresponds to the C–O asymmetric bridge stretching, and the peak at 1061 cm−1 corresponds to the C–O–C pyranose ring skeletal vibration.38 The peak at 1651 cm−1 is attributed to the –CO–NH– stretching vibration, which may come from bacterial cells and proteins that left on BC after the NaOH treatment.39
|
| Fig. 2 FT-IR analysis of BC/GO composites (A), UV-vis absorption spectra of BC/GO composites (B), TG profiles of BC/GO composites (C), XRD patterns of BC/GO composites (D): (a) BC, (b) BC/GO2 composite, (c) BC/GO4 composite, (d) BC/GO6 composite, (e) BC/GO8 composite, (f) GO nanosheets. | |
In the case of GO (curve (f)), the broad and intense peak centered at 3416 cm−1, which is related to the OH groups, and the strong peak at 1728 cm−1 corresponds to the stretching vibrations of CO carboxylic moieties. The peak at 1621 cm−1 is associated with intramolecular hydrogen bonds.40 Other bands at 1410, 1230 and 1050 cm−1 correspond to C–O–H deformation, C–OH stretching (epoxy groups) and C–O stretching vibrations (alkoxy groups), respectively.41
For BC/GO composites (curves (b)–(e)), most of the characteristic vibrations in the spectra are the same as BC with small differences. The peak at 1726 cm−1 corresponding to the CO stretching vibration which belongs to GO becomes more evident with GO loadings increasing in the spectra of BC/GO composites, which verifies the existence of GO in the composite. It has been proved that a series of oxygen-containing groups such as hydroxyl, epoxy, and carboxyl groups exist on GO sheets (UV part) which can form effective interaction with the hydroxyl groups in BC. This result is in good agreement with the works previously reported by Feng Y. et al.35
3.3. Optical properties
Fig. 2B shows UV-vis absorption spectra of BC and BC/GO composites. As seen in curve (a), BC does not exhibit any feature absorption in the UV-visible range but a gentle slope between 250 and 280 nm, which may be attributed to the presence of cell residuals. GO yields a UV-visible spectrum containing absorption maximum at 223 nm corresponding to the π–π* transitions of aromatic C–C bonds in GO (curve (f)). There is also a shoulder at 300 nm can be assigned to the n–π* transitions of CO bonds.42 Presence of carboxyl groups was also verified by FTIR (curve (f) in Fig. 2A). In the case of BC/GO composites, significant absorptions at about 230.5 nm can be observed in all of BC/GO composites (curves (b)–(e)), which proved the existence of GO nanosheets in the composites.
3.4. Thermal properties
TG is a continuous process, involving the measurement of sample weight in accordance with increasing temperature in the form of programmed heating. Typical plots of weight loss versus temperature for BC and BC/GO composites are displayed in Fig. 2C. Two significant weight loss stages below 600 °C are observed in the thermal degradation curve of BC (curve (a) in Fig. 2C) and the total weight loss is 92.7%. The initial weight loss occurred around 110 °C, which is attributed to the evaporation of absorbed moisture.43 Physically adsorbed and hydrogen bond linked water molecules were lost at this first stage.44 The second weight loss occurred between 110 and 400 °C which can be assigned to the thermal degradation and decomposition of BC, which involves the formation of levoglucosan, transglycosylation and free radical reaction, followed by generation of C, CO, CO2, H2O and combustible volatiles.45,46 For BC/GO composites, two significant weight loss stages were also revealed (curves (b)–(e)). However, with the increase of GO concentration, the weight loss stages shifted to lower temperature. The residues increased with the introduction of GO, e.g. the residue of composites was increased from 6.3% for BC to 20.81% for BC/GO8 composites.
The temperature at maximum mass loss rate (Tmax) decreases from 367.2 °C for BC to 350.8, 346.8, 345.7 and 339.4 °C for BC/GO2, BC/GO4, BC/GO6 and BC/GO8 composites, respectively. This is due to the decomposition temperature of GO is around 310 °C, which is related to the decomposition of the oxygen functional groups in GO.47 Therefore, GO is demonstrated successfully to be incorporated into the three-dimensional network structure of BC.
3.5. XRD analysis
Fig. 2D is the X-ray diffraction patterns of BC and BC/GO composites with different GO loadings. The profile of BC (curve (a)) is a typical cellulose I XRD pattern and three characteristic peaks of BC are observed at 2θ values of 14.46°, 16.62°, 22.66° corresponding to (110), (10) and (200) crystal planes of cellulose, which is consistent with relative reports.9,48,49 For BC with different GO contents (curves (b)–(e)), the peaks of BC become weak but they are still evident, while the peaks of GO at 9.8° corresponding to (001) crystal planes of GO could be observed only in BC/GO8 composite. It is hard to find the characteristic peak of GO in the patterns of other composites. These findings can be explained in two possible reasons. First one is because of the low amount of GO loaded in the composites. Second one is the high dispersibility of the GO nanosheets in the BC matrix which leads the periodic interlayer spacing between the GO nanosheets to be disappeared.50 Taking together with SEM pictures, it further proved GO nanoplatelets were finely dispersed in the BC matrix.
3.6. Cytotoxicity of BC/GO composites
Cellular growth and proliferation on surfaces are a symbol of cytocompatibility for materials which can be used to assess the potential of materials for application in tissue engineering.51 Cytotoxicity studies were performed to investigate the effect of GO in the BC matrix on proliferation of HEK 293 cell line. It is important to determine the effective GO concentration in vitro. The effect of BC, without GO, was evaluated in vitro to ensure that GO did not have an independent toxicity effect. The cell viability of HEK 293 cells was evaluated by MTT assay.
In the first case, the cell cytotoxicity imparted by BC/GO composites being placed on the top of HEK 293 cells was studied. HEK 293 cells were placed in each well of a 48-well plate and after 24 h incubation, cells were fixed and the cell morphologies were observed by a microscope. Fig. 3A–F show the morphologies of the HEK293 cells after removing BC/GO composites with different GO concentrations after 24 h culture. There are no obvious differences in cell morphologies for the control, BC and BC/GO composites with different GO loadings. The cell density on the control is very similar to the BC/GO composites which display typical fibroblast-like morphology. The MTT results were illustrated in Fig. 3G as relative viability of the cells by comparison with the control well containing only the cells. All the materials showed negligible toxicity. No reduced cell viability following their incubation with BC/GO composites on top was shown. The results showed that GO do not inhibit the proliferation of HEK 293 cells, even at a high concentration because HEK 293 cells do not seem to be affected from their incubation with BC/GO composites.
|
| Fig. 3 Cell morphologies after 24 h culture with BC/GO composites: Control (A), BC (B), BC/GO2 composites (C), BC/GO4 composites (D), BC/GO6 composites (E), BC/GO8 composites (F), cell viability percentage treated with BC/GO composites upon cells (G), cell viability percentage treated with BC/GO composites under cells (H), cell proliferation treated with BC/GO composites upon cells for 80 h based on RTCA. | |
In the second case, in order to further evaluate cell cytotoxicity of BC/GO composites, HEK 293 cells were seeded on the surfaces of BC and BC/GO composites, and then incubated for 24 h. The relative cell viability (Fig. 3H) is slightly decreased with GO loading increasing in the BC matrix. However, it is still in the considerable range that no obvious cell cytotoxicity was detected.
3.7. Cell proliferation
To determine cell proliferation treated with BC/GO composites, RTCA system was applied. Respective impedance was determined and shown in Fig. 3I. There are similar values of the cell index between the control and BC/GO composites, which continued to be increased up to 72 h and then no obvious changes were found with increasing contact time. Thus, there are no effects of BC/GO composites on cell proliferation and the prepared BC/GO composites have good cell compatibility.
3.8. Effect of surface free energy on bacterial adhesion
The contact angles and surface energy components of BC/GO composites, E. coli ATCC 25922 and S. aureus ATCC 6538 are given in Table 2. Obviously the addition of GO had influence on surface energy, including Lifshitz–van der Waals component γLW, electron donor component γ− and total surface energy γTOT. The surface free energy of BC is quite high (53.27 mN m−1), and with GO loadings increasing, the surface free energy of BC matrix decreased. For BC/GO8 composite, the surface free energy decreased to 37.20 mN m−1.
Table 2 Contact angles and surface energy components of BC/GO composites, E. coli ATCC 25922 and S. aureus ATCC 6538
Materials |
Contact angle, θ (°) |
Surface energy (mN m−1) |
H2O |
CH2I2 |
C2H6O2 |
γLW |
γ+ |
γ− |
γTOT |
BC |
59.9 ± 0.3 |
19.3 ± 0.4 |
13.6 ± 0.5 |
47.99 |
0.51 |
13.73 |
53.27 |
BC/GO2 |
62.2 ± 0.7 |
29.2 ± 0.5 |
25.7 ± 0.9 |
44.55 |
0.43 |
14.01 |
49.46 |
BC/GO4 |
64.7 ± 0.8 |
36.7 ± 0.6 |
34.6 ± 0.7 |
41.23 |
0.33 |
14.26 |
45.57 |
BC/GO6 |
67.3 ± 0.9 |
42.4 ± 0.6 |
43.9 ± 0.8 |
38.38 |
0.13 |
15.14 |
41.26 |
BC/GO8 |
70.5 ± 0.5 |
45.1 ± 0.3 |
54.0 ± 0.8 |
36.96 |
0 |
16.19 |
37.20 |
E. coli ATCC 25922 |
20.0 ± 1.6 |
44.3 ± 0.9 |
36.1 ± 1.2 |
37.38 |
0.04 |
72.68 |
40.74 |
S. aureus ATCC 6538 |
40.6 ± 1.4 |
51.4 ± 1.2 |
65.3 ± 1.6 |
33.49 |
1.78 |
75.06 |
56.59 |
The results of the total adhered bacteria on BC/GO composites with different GO loadings and on BC for the contact time 1 h, 3 h, 5 h, 7 h, 9 h and 11 h are given in Fig. 4. The BC/GO composites performed much better than BC in reducing bacterial attachment, and it was found that bacterial adhesion decreased with increasing GO content in the films. The BC/GO8 composites reduced E. coli attachment by 95.61% and S. aureus attachment by 65.35% at 1 h compared with BC, respectively. The contact time has significant influence on bacterial adhesion. Fig. 4 indicates that the number of attached E. coli decreased with contact time increasing (Fig. 4A) and that of attached S. aureus increased with contact time increasing firstly and then decreased after 3 h (Fig. 4B). As no nutrient was added in the bacterial suspension, at contact time over 1–3 h some bacteria started dying, which lead to the reduction of bacterial attachment to the samples with increasing contact time. In general, these results indicate that BC/GO composites have excellent anti-bacterial activities against Gram negative E. coli and Gram positive S. aureus. Combining all beneficial qualities, make the prepared BC/GO composites good anti-bacterial biomaterials which can be used in various biomedical applications.
|
| Fig. 4 Effect of GO contents in BC as a function of contact time on the bacterial adhesion: E. coli ATCC 25922 (A), S. aureus ATCC 6538 (B). | |
Fig. 5A and B show that there was a strong correlation between total surface energy γTOT and bacterial adhesion. With the surface energies γTOT increasing, the number of adhered bacteria to BC matrix increased linearly. Table 2 indicated that there was a significant difference in the electron donor components γ− between BC based matrix. The γ− values of BC/GO composites were much higher than that of BC. Fig. 5C and D show the effect of the electron donor component γ− values on bacterial adhesion. The number of adhered bacteria declined with γ− values increasing. The number of adhered bacteria to BC with lower γ− value was the highest and the number of bacteria attached to BC/GO8 with higher γ− value was the lowest. Both E. coli ATCC 25922 and S. aureus ATCC 6538 have very high values of γ− component (72.68 and 75.06 mN m−1) and a low value of γ+ component (0.04 and 1.78 mN m−1) (Table 2), and were negatively charged with the zeta potential of −6.44 and −6.28 mV, respectively (Table 3). If a material is negatively charged, the material will be repellent to the bacteria. Chibowski et al.52 investigated the changes in zeta potential and surface energy components of calcium carbonate due to exposure to a radiofrequency electric field. They observed that the zeta potential decreased with an increase in the electron donor component γ− of the surface energy. The observed changes in zeta potential and surface free energy components were believed to result from changes in the surface charge of calcium carbonate.52 The larger the electron donor component γ− of a surface, the more negatively charged the surface and the more repellent to bacteria. This may explain why bacterial adhesion decreased with increasing electron donor γ− values of the coatings.
|
| Fig. 5 Effects of surface free energies γTOT on bacterial adhesion: E. coli ATCC 25922 (A) and S. aureus ATCC 6538 (B), effects of electron donor components γ− on bacterial adhesion: E. coli ATCC 25922 (C) and S. aureus ATCC 6538 (D), effects of the separation distance H on the total interaction energies ΔETOT between E. coli ATCC 25922 (E) and S. aureus ATCC 6538 (F) and investigated surfaces, effects of total interaction energies ΔETOT on E. coli ATCC 25922 (G) and S. aureus ATCC 6538 (H) adhesion. | |
Table 3 Zeta potentials and diameters of tested bacteria
Bacteria |
Diameters (μm) |
Zeta potential (mV) (100 mM) |
E. coli ATCC 25922 |
1.42 ± 0.06 |
−6.44 ± 0.23 |
S. aureus ATCC 6538 |
1.06 ± 0.05 |
−6.28 ± 0.35 |
4. Discussion
The theory used to explain bacterial adhesion was the extended DLVO theory.34 The total interaction energy between a bacterium and a solid surface immersed in an aqueous medium is the sum of the Lifshitz–van der Waals interactions ΔELW, the Lewis acid–base interactions ΔEAB, electrical double layer ΔEEL interactions and Brownian motion ΔEBr:11 |
ΔETOT = ΔELW + ΔEAB + ΔEEL + ΔEBr
| (4) |
4.1. Lifshitz–van der Waals interaction
The Lifshitz–van der Waals interaction energy is defined as: |
| (5) |
where R is radius of bacterium, A is Hamaker constant and H is the separation distance between the bacterium and the surface. van Oss53 presented a very simple method for the calculation of Hamaker constant based on the surface energy of the interaction materials:where γLWi is the Lifshitz–van der Waals apolar component of the surface energy and H0 is the minimum equilibrium distance between the two interacting bodies. The Hamaker constant for interaction between bacterium 1 and a solid surface 2 in water 3 is given by: |
| (7) |
Combining the above equations, the LW interaction energy can be expressed as:
|
| (8) |
In the equation, H0 is 0.157 nm.53 γLW1 used in this study was for E. coli ATCC 25922 and S. aureus ATCC 6538 and γLW2 is for BC matrix, which are given in Table 2, and γLW3 is for water, which is 21.8 mJ m−2 and given in Table 1. The radius of E. coli and S. aureus can be calculated based on the diameter data in Table 3.
4.2. Electrostatic double-layer interaction
The electrostatic double-layer interaction ΔEEL between bacterium 1 and a flat solid surface 2 can be described as:53,54 |
| (9) |
In this equation, ζ1 is zeta potential of E. coli ATCC 25922 and S. aureus ATCC 6538, which can be found in Table 3. ζ2 is zeta potential of solid materials, which was taken as −25 mV in this calculation. ε and ε0 are relative dielectric permittivity of water (78.55 for water at 25 °C) and the permittivity under vacuum (8.854 × 10⁻¹² C V−1 m−1) respectively, κ is Debye–Hǔckel length and also an estimation of the effective thickness of the electrical double layer (1/κ = 1.1 nm).53,54
4.3. Lewis acid–base interaction
The Lewis acid–base interaction ΔEAB between bacteria 1 and flat surface 2 in water 3 is given by:53,54 |
| (10) |
|
| (11) |
where λ is the characteristic wavelength of the interaction between 0.2 and 1.0 nm. For pure water, λ = 0.2 nm.11
4.4. Brownian movement forces
ΔEBr is given by: |
ΔEBr = 0.414 × 10⁻²⁰ J
| (12) |
The total interaction energy ΔETOT between E. coli ATCC 25922 or S. aureus ATCC 6538 and the different solid surfaces in water was calculated using the above equations.
4.5. Effect of H on bacterial adhesion
Fig. 5E shows the effect of the separation distance H on the total interaction energies ΔETOT between E. coli ATCC 25922 and investigated surfaces in 100 mM PBS. The top line is BC that has the highest interaction energy profiles, then followed by BC/GO2, BC/GO4 and BC/GO6. The bottom line is BC/GO8 which has the lowest interaction energy profiles. Clearly when H is equal to H0 = 0.157 nm, the total interaction energies ΔETOT between bacteria and the substrates are minimum. The similar results to Fig. 5F were obtained for the effect of the separation distance H on the total interaction energies ΔETOT between S. aureus ATCC 6538 and investigated surfaces in 100 mM PBS.
4.6. Effect of ΔETOT on bacterial adhesion
In order to investigate the effect of total interaction energies ΔETOT on bacterial adhesion, the minimal total interaction energies ΔETOT when H0 = 0.157 nm were adopted. Fig. 5G shows that there is very strong correlation between the total interaction energies ΔETOT and E. coli ATCC 25922 adhesion. The number of bacteria attached to the surfaces decreases linearly with total interaction energy ΔETOT increasing, which is consistent with the extended DLVO theory. The similar result in Fig. 5H was obtained with S. aureus ATCC 6538.
According to the extended DLVO theory, if the total interaction energy ΔETOT is negative, adhesion is favorable.53–55 If ΔETOT is positive, adhesion is unfavorable. Bacterial adhesion should decrease with ΔETOT increasing. The experimental results are in accordance with the theory.
Incorporation of GO nanosheets within BC is an active approach for improving anti-bacterial properties of BC. When GO were added into BC matrix, hydrogen bond occurs between the carbonyl groups of carboxylic acid in GO and hydroxyl groups of BC. Therefore, an interconnected structure is assumed to be formed in BC matrix strengthened by GO. Since that the special two-dimensional morphology of the GO as well as its functionalized surface provides well homogeneous dispersion, which leads to a high contact area in the BC matrix.56 Even with 8 wt% GO in BC, no obvious cell cytotoxicity was observed. Therefore, the excellent anti-bacterial and good biocompatibility properties make BC/GO composites promising candidates for biomedical applications.
5. Conclusion
The BC/GO composites are produced by a sonochemical method. The BC/GO composites possess good cytocompatibility. The composites show excellent anti-bacterial rates as high as 95.61% to E. coli and 65.35% to S. aureus, indicating effective antibacterial ability. The extended DLVO theory is used to explain the anti-bacterial behavior. This novel material reported here can be used for different applications in biomaterials.
Acknowledgements
The work was financially supported by the National Natural Science Foundation of China (51401109), the High-level Talent Project of Nanjing Forestry University (GXL201301), the Major Program of the Natural Science Foundation of Jiangsu Higher Education of China (14KJB430018) and the Project Funded by the Priority Academic Program Development of Jiangsu Higher Education Institutions (PAPD).
Notes and references
- N. Shah, M. Ul-Islam, W. A. Khattak and J. K. Park, Carbohydr. Polym., 2013, 98, 1585 CrossRef CAS PubMed.
- C. J. Grande, F. G. Torres, C. M. Gomez and M. C. Bañó, Acta Biomater., 2009, 5, 1605 CrossRef CAS PubMed.
- J. Yang, X. Liu, L. Huang and D. Sun, Chin. J. Chem. Eng., 2013, 21, 1419 CrossRef CAS.
- M. Ul-Islam, T. Khan and J. K. Park, Carbohydr. Polym., 2012, 89, 1189 CrossRef CAS PubMed.
- F. A. Müller, L. Müller, I. Hofmann, P. Greil, M. M. Wenzel and R. Staudenmaier, Biomaterials, 2006, 27, 3955 CrossRef PubMed.
- A. Svensson, E. Nicklasson, T. Harrah, B. Panilaitis, D. L. Kaplan, M. Brittberg and P. Gatenholm, Biomaterials, 2005, 26, 419 CrossRef CAS PubMed.
- J. Kim, Z. Cai and Y. Chen, J. Nanotechnol. Eng. Med., 2010, 1, 011001 CrossRef.
- A. Lloyd, Mater. Today, 2004, 7, 28 CrossRef.
- J. Wu, Y. Zheng, W. Song, J. Luan, X. Wen, Z. Wu, X. Chen and Q. Wang, Carbohydr. Polym., 2014, 102, 762 CrossRef CAS PubMed.
- M. G. Katsikogianni and Y. F. Missirlis, Acta Biomater., 2010, 6, 1107 CrossRef CAS PubMed.
- W. Shao and Q. Zhao, Colloids Surf., B, 2010, 76, 98 CrossRef CAS PubMed.
- B. Wei, G. Yang and F. Hong, Carbohydr. Polym., 2011, 84, 533 CrossRef CAS PubMed.
- W. C. Lin, C. C. Lien, H. J. Yeh, C. M. Yu and S. H. Hsu, Carbohydr. Polym., 2013, 94, 603 CrossRef CAS PubMed.
- I. M. Jipa, A. Stoica-Guzun and M. Stroescu, LWT–Food Sci. Technol., 2012, 47, 400 CrossRef CAS PubMed.
- G. Yang, J. Xie, F. Hong, Z. Cao and X. Yang, Carbohydr. Polym., 2012, 87, 839 CrossRef CAS PubMed.
- N. C. T. Martins, C. S. R. Freire, C. P. Neto, A. J. D. Silvestre, J. Causio, G. Baldi, P. Sadocco and T. Trindade, Colloids Surf., A, 2013, 417, 111 CrossRef CAS PubMed.
- T. Deutschle, U. Porkert, R. Reiter, T. Keck and H. Riechelmann, Toxicol. In Vitro, 2006, 20, 1472 CrossRef CAS PubMed.
- J. W. Loh, M. Saunders and L. Y. Lim, Toxicol. Appl. Pharmacol., 2012, 262, 273 CrossRef CAS PubMed.
- L. Li, J. Sun, X. Li, Y. Zhang, Z. Wang, C. Wang, J. Dai and Q. Wang, Biomaterials, 2012, 33, 1714 CrossRef CAS PubMed.
- J. Wang, M. Feng and H. Zhan, Opt. Laser Technol., 2014, 57, 84 CrossRef CAS PubMed.
- Y. Li, R. Umer, Y. A. Samad, L. Zheng and K. Liao, Carbon, 2013, 55, 321 CrossRef CAS PubMed.
- M. I. Katsnelson and K. S. Novoselov, Solid State Commun., 2007, 143, 3 CrossRef CAS PubMed.
- S. Gilje, S. Han, M. Wang, K. L. Wang and R. B. Kaner, Nano Lett., 2007, 7, 3394 CrossRef CAS PubMed.
- H. Zhang, X. Lv, Y. Li, Y. Wang and J. Li, ACS Nano, 2010, 4, 380 CrossRef CAS PubMed.
- A. M. Pinto, I. C. Gonçalves and F. D. Magalhães, Colloids Surf., B, 2013, 111, 188 CrossRef CAS PubMed.
- M. Gkikas, G. V. Theodosopoulos, B. P. Das, M. Tsianou, H. Iatrou and G. Sakellariou, Eur. Polym. J., 2014, 60, 106 CrossRef CAS PubMed.
- J. A. Nam, A. A. Nahain, S. M. Kim, I. In and S. Y. Park, Acta Biomater., 2013, 9, 7996 CrossRef CAS PubMed.
- Y. Liu, M. Park, H. K. Shin, B. Pant, J. Choi, Y. W. Park, J. Y. Lee, S. J. Park and H. Y. Kim, J. Ind. Eng. Chem., 2014, 20, 4415 CrossRef CAS PubMed.
- J. Liu, L. Cui and D. Losic, Acta Biomater., 2013, 9, 9243 CrossRef CAS PubMed.
- H. J. Ge, S. K. Du, D. H. Lin, J. N. Zhang, J. L. Xiang and Z. X. Li, Appl. Biochem. Biotechnol., 2011, 165, 1519 CrossRef CAS PubMed.
- Q. Shi, Y. Li, J. Sun, H. Zhang, L. Chen, B. Chen, H. Yang and Z. Wang, Biomaterials, 2012, 33, 6644 CrossRef CAS PubMed.
- P. K. Sharma and K. H. Rao, Adv. Colloid Interface Sci., 2002, 98, 341 CrossRef CAS.
- C. J. van Oss, Interfacial Forces in Aqueous Media, Marcel Dekker, New York, 1994 Search PubMed.
- B. Li and B. E. Logan, Colloids Surf., B, 2004, 36, 81 CrossRef CAS PubMed.
- Y. Feng, X. Zhang, Y. Shen, K. Yoshino and W. Feng, Carbohydr. Polym., 2012, 87, 644 CrossRef CAS PubMed.
- Y. Z. Wan, Y. Huang, C. D. Yuan, S. Raman, Y. Zhu, H. J. Jiang, F. He and C. Gao, Mater. Sci. Eng., C, 2007, 27, 855 CrossRef CAS PubMed.
- Y. Feng, X. Zhang, Y. Shen, K. Yoshino and W. Feng, Carbohydr. Polym., 2012, 87, 644 CrossRef CAS PubMed.
- M. Park, J. Cheng, J. Choi, J. Kim and J. Hyun, Colloids Surf., B, 2013, 102, 238 CrossRef CAS PubMed.
- O. Shezad, S. Khan, T. Khan and J. K. Park, Carbohydr. Polym., 2010, 82, 173 CrossRef CAS PubMed.
- L. Valentini, M. Cardinali, E. Fortunati, L. Torre and J. M. Kenny, Mater. Lett., 2013, 105, 4 CrossRef CAS PubMed.
- K. Satheesh and R. Jayavel, Mater. Lett., 2013, 113, 5 CrossRef CAS PubMed.
- D. Luo, G. Zhang, J. Liu and X. Sun, J. Phys. Chem. C, 2011, 115, 11327 CAS.
- S. Pavlidou, Prog. Polym. Sci., 2008, 33, 1119 CrossRef CAS PubMed.
- J. Wang, C. Gao, Y. Zhang and Y. Wan, Mater. Sci. Eng., C, 2010, 30, 214 CrossRef CAS PubMed.
- S. Lerdkanchanaporn, D. Dollimore and K. S. Alexander, Thermochim. Acta, 1998, 324, 25 CrossRef CAS.
- G. Jiang, J. Qiao and F. Hong, Int. J. Hydrogen Energy, 2012, 37, 9182 CrossRef CAS PubMed.
- Z. Yan, S. Chen, H. Wang, B. Wang and J. Jiang, Carbohydr. Polym., 2008, 74, 659 CrossRef CAS PubMed.
- Z. Qin, L. Ji, X. Yin, L. Zhu, Q. Lin and J. Qin, Carbohydr. Polym., 2014, 101, 947 CrossRef CAS PubMed.
- Z. Yan, S. Chen, H. Wang, B. Wang and J. Jiang, Carbohydr. Polym., 2008, 74, 659 CrossRef CAS PubMed.
- W. Ouyang, J. Sun, J. Memon, C. Wang, J. Geng and Y. Huang, Carbon, 2013, 62, 501 CrossRef CAS PubMed.
- Y. Cheng, J. Lu, S. Liu, P. Zhao, G. Lu and J. Chen, Carbohydr. Polym., 2014, 107, 57 CrossRef CAS PubMed.
- E. Chibowski, L. Holysz and W. Wójcik, Colloids Surf., A, 1994, 92, 79 CrossRef CAS.
- Q. Zhao, C. Wang, Y. Liu and S. Wang, Int. J. Adhes. Adhes., 2007, 27, 85 CrossRef CAS PubMed.
- P. McArdle, Am. J. Infect. Control, 2005, 33, e130 CrossRef PubMed.
- Q. Zhao, Y. Liu and C. Wang, Appl. Surf. Sci., 2005, 252, 1620 CrossRef CAS PubMed.
- M. E. Achaby, Y. Essamlali, N. E. Miri, A. Snik, K. Abdelouahdi, A. Fihri, M. Zahouily and A. Solhy, J. Appl. Polym. Sci., 2014, 131, 41042 CrossRef.
Footnote |
† Equal contributors. |
|
This journal is © The Royal Society of Chemistry 2015 |
Click here to see how this site uses Cookies. View our privacy policy here.