Spectrofluorimetric study of phenolic endocrine disruptors in cyclodextrin media

Rocío B. Pellegrino Vidal, Gabriela A. Ibañez* and Graciela M. Escandar*
Instituto de Química Rosario (CONICET-UNR), Facultad de Ciencias Bioquímicas y Farmacéuticas, Universidad Nacional de Rosario, Suipacha 531 (2000), Rosario, Argentina. E-mail: escandar@iquir-conicet.gov.ar

Received 23rd October 2014 , Accepted 12th February 2015

First published on 12th February 2015


Abstract

This study focuses on the spectrofluorimetric behavior of bisphenol A (BPA), 4-octylphenol (OP) and 4-nonylphenol (NP) in the presence of native and derivative cyclodextrins (CDs). The weak fluorescence emission bands of these endocrine disrupting compounds in aqueous media are significantly enhanced by β-CD and its hydroxyethyl-, hydropropyl, methyl-, and heptakis(2,6-di-o-methyl)-derivatives. A 1[thin space (1/6-em)]:[thin space (1/6-em)]1 guest[thin space (1/6-em)]:[thin space (1/6-em)]host stoichiometry for most complexes is established, although the additional presence of weak 1[thin space (1/6-em)]:[thin space (1/6-em)]2 complexes is suggested in both BPA–hydroxyethyl–β-CD and BPA–heptakis(2,6-di-o-methyl)–β-CD systems. The association constants are calculated by applying a non-linear regression method to the changes brought about by the presence of each CD in the corresponding fluorescence spectra, and these values are corroborated using a Benesi–Hildebrand type equation. The participation of the CD substituents in the inclusion phenomenon is indirectly demonstrated through the comparison of the acidity constant values in the absence and in the presence of β-CD derivatives. On the basis of 1H-NMR studies, possible structures of the formed complexes are suggested, and the structural information is supplemented by AM1 semiempirical calculations. The potential of the studied complexes in relation to their use for analytical purposes and/or for environmental remediation is discussed.
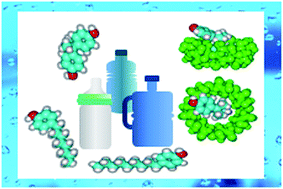

Endocrine disruptors (EDs) are compounds which mimic or inhibit the natural action of the endocrine system in mammals, representing a serious threat to human health and ecosystems.1 They are classified into several categories, such as hormones, pharmaceuticals, personal care products, industrial chemicals, pesticides, and combustion byproducts.1

In the present work, three phenol derivative EDs, representative of the industrial chemical group, were investigated: a widely used chemical in the production of polycarbonate plastics and epoxy resins, bisphenol A (BPA),2 and two non-ionic surfactants used in a variety of industrial processes, 4-octylphenol (OP) and 4-nonylphenol (NP)3 (Fig. 1). These compounds are emerging contaminants frequently found in the aquatic environment, denoting potentially concerning public health risks.4,5


image file: c4ra13023e-f1.tif
Fig. 1 Structure and numbering of the studied compounds.

BPA, OP and NP have aromatic rings and alkyl carbons in their structures that confer them hydrophobic properties. Therefore, they are capable of interacting, in case of geometric compatibility, with the hydrophobic cavity of some cyclodextrins (CDs) to form inclusion complexes. Despite the important role of CD complexes in environmental depollution processes and soil remediation, and their use as solubility enhancers and fluorescent signal boosters for pollutant determination, studies of inclusion complexes in aqueous solution with these relevant analytes are rather incomplete. Del Olmo et al. studied the complex formation between BPA and β-CD, and developed a spectrofluorimetric method for the determination of the pollutant in water samples.6 Kitano et al. determined the association constants in 10% (v/v) methanol of complexes of BPA with β-CD and some of its derivatives, examining the effect of both guest and host structures on the complex formation.7 Recently, the BPA–β-CD complex was employed for the development of a flow-injection fluorescence method for the determination of BPA in tap waters.8 In a work devoted to NP soil remediation, Kawasaki et al. measured the solubility of this compound in five different hydroxypropyl–CD solutions,9 and for assessing the potentiality of β-CD complexes as an effective tool to remove NP and NP ethoxylate from wastewaters, Bonenfant et al. analysed their inclusion complexes by UV-Vis and FTIR spectroscopies.10

In the present paper, a complete analysis of the spectrofluorimetric behavior of BPA, OP and NP in the presence of β-CD, 2-hydroxyethyl–β-CD (HE–β-CD), 2-hydroxypropyl–β-CD (HP–β-CD), methyl–β-CD (M–β-CD), and heptakis(2,6-di-o-methyl)–β-CD (DM–β-CD) is performed. The rationale for employing derivative CDs was to determine the effect of substituents at the CD rims on analyte complexation. The objective is to know the appropriate conditions for the delineation of strategies mediated by organized media with analytical purposes, such as the development of advantageous methods for preconcentration, quantitation, and/or remotion of the studied micropollutants.

Experimental

Reagents and solutions

All reagents were of high-purity grade and used as received. BPA, OP, M–β-CD, and DM–β-CD were purchased from Sigma-Aldrich (Milwaukee, WI, USA). NP and HE–β-CD were provided by Fluka (Buchs, Switzerland). Sodium hydroxide (NaOH) and methanol (MeOH) were obtained from Merck (Darmstadt, Germany). α, β and γ-CDs and HP–β-CD were acquired from Cyclolab (Budapest, Hungary). Hydrogen chloride was provided by Cicarelli (Bs. As., Argentina).

MeOH stock solutions of BPA, NP and OP of about 1.00 mg mL−1 were prepared and stored in dark flasks at 4 °C. From these solutions, more diluted methanol solutions (ranging from 0.050 to 0.250 mg mL−1) were obtained. Working aqueous solutions were prepared immediately before their use by taking appropriate aliquots of methanol solutions, evaporating the organic solvent by use of dry nitrogen and diluting with ultrapurified water from a Millipore system (Massachusetts, USA) to the desired concentrations. Stock solutions of CDs were prepared in ultrapurified water.

Apparatus

Fluorescence measurements were done on a PerkinElmer LS 55 luminescence spectrometer equipped with a xenon discharge lamp (equivalent to 20 kW for 8 μs duration) and connected to a PC microcomputer, using 1.00 cm quartz cells. Instrumental parameters were: excitation and emission slits of 5 or 10 nm, photomultiplier voltage 700 V, scan rate 1500 nm min−1. The excitation wavelengths were 220 and 278 nm for NP and OP, and 225 and 278 nm for BPA. The emission wavelength was 307 nm in all cases. The temperature of the cell holder was regulated using a Lauda (Frankfurt, Germany) Alpha RA8 thermostatic bath. The pH of solutions was measured with an Orion (Thermo Scientific) 420 pH meter equipped with glass and Ag/AgCl reference electrodes.

Influence of cyclodextrin concentrations

The effect of the concentration of CDs on the fluorescence spectra of the BPA, NP and OP was studied by preparing aqueous solutions containing a fixed concentration (500 ng mL−1) of each analyte and CD concentrations ranging from 0 to 1 × 10⁻² mol L−1. With the purpose of obtaining the blank signals, a similar procedure was also performed in the absence of analyte. Finally, blank signals were subtracted from the corresponding spectra and the plot of the corrected fluorescence intensity at a maximum as a function of CD concentration was obtained.

Influence of the pH

The changes in the fluorescence intensity of BPA, NP and OP, and their β- and modified β-CD complexes as a function of pH were studied by the following procedure: to 50 mL of stirred hydrochloric acid solution (CHCl ca. 1 × 10⁻⁴ mol L−1) of the analytes or their CD complexes, NaOH solution (0.1–1 mol L−1) was added in small increments (0.01–0.5 mL). For each pH point, a known aliquot of solution was extracted and the fluorescence spectrum was read. In all experiments, the CD concentration was kept at 2 × 10⁻³ mol L−1, and the initial concentrations of the analytes were 500 ng mL−1, except for the assay of BPA in the absence of CDs. Due to the low fluorescence signal exhibited by BPA in aqueous solution, in the latter experiment the BPA initial concentration was 1000 ng mL−1.

The temperature was maintained at 20 °C. The measurements were performed in duplicate. The profiles of fluorescence at λexc = 278 nm vs. pH were used to calculate the deprotonation constant values of the studied compounds in the excited state, both in the presence and in the absence of the selected CDs. These calculations were performed with the aid of the PKFIT program,11 which is based on a least-squares procedure and can be obtained from the authors on request.

1H NMR spectra

Proton NMR spectra were recorded on a Bruker Avance (Karlsruhe, Germany) AC-300 NMR spectrometer operating at nominal frequency of 300.13 MHz. All spectra were run in d6-DMSO solution. The chemical shifts (expressed in the ppm scale) were referenced against TMS using the solvent signal as a secondary reference (δDMSO = 2.5 ppm). The higher solubility of BPA, NP, OP and β-CD in DMSO with respect to water allowed us to work with higher concentrations (i.e., CBPA = 8.76 × 10⁻³ mol L−1, COP = 9.69 × 10⁻³ mol L−1, CNP = 9.08 × 10⁻³ mol L−1 and CCD = 0.07 mol L−1).

AM1 calculations

Ground-state geometry optimization of the proposed structures for the inclusion complexes was performed with the AM1 program contained in the HyperChem package (Hypercube, Inc.) version 7.02.

Results and discussion

Fluorescence spectra

Fig. 2 shows the fluorescence spectra for the studied EDs, with excitation maxima at about 220 and 275 nm, and emission maximum at about 307 nm, resembling those of estrogens in aqueous solution.12 As can be appreciated, the studied compounds display low native fluorescence intensity, especially that corresponding to BPA, and Raman bands from water are clearly visualized. However, the addition of selected organized media to these solutions leads to an increase in fluorescence intensity of different magnitude, depending on the evaluated system (Fig. 2). This fact is rationalized as indicative of a complex formation, and from the changes in the fluorescence intensity, the formation constant value for the inclusion complex can be determined.
image file: c4ra13023e-f2.tif
Fig. 2 Excitation and emission fluorescence spectra for BPA (green), OP (pink), and NP (blue) in aqueous solution and in the presence of different organized media as indicated. The dashed lines in all plots are the corresponding blanks. CBPA = COP = CNP = 500 ng mL−1; Cβ-CD = CHE–β-CD = CHP–β-CD = CM–β-CD = CDM–β-CD = 2 × 10⁻³ mol L−1; λexc = 278 nm.

Effect of cyclodextrins

It was corroborated (see below) that the fluorescence intensities of three studied EDs are maxima when they remain in their neutral structures (pH < 9) which, in turn, are optimal for inclusion complex formation with CDs.13 Therefore, the subsequent experiments were conducted at neutral pH.

Among the three major CDs, namely α-, β-, and γ-CDs (constituted by six, seven, and eight glucose units, respectively), only β-CD produced significant enhancements of the signals, suggesting that this CD has the appropriate size for complex formation in solution. Therefore, the evaluated CDs were β-CD derivatives such as HE–, HP–, M–, and DM–β-CDs.

Fig. 3 shows the fluorescence emission at 307 nm of OP, NP, and BPA at increasing concentrations of selected CDs. In most systems, upon addition of either β-CD or their derivatives to EDs solutions, a sharp enhancement of the fluorescence intensities is detected and, after the highest signals are achieved, they remain almost constant. This type of profiles can be ascribed to the formation of a 1[thin space (1/6-em)]:[thin space (1/6-em)]1 analyte–CD complex according to the following reaction:

 
image file: c4ra13023e-t1.tif(1)


image file: c4ra13023e-f3.tif
Fig. 3 Effect of cyclodextrins, as indicated, on the fluorescence emission of BPA (green triangle), OP (pink square), and NP (blue circle). CBPA = COP = CNP = 500 ng mL−1; λexc = 278 nm. Each point was background-corrected. Solid lines are the non-linear fit to the data.

Usual assumptions in estimating K11 are the following: (1) the CD is in a large excess with respect to the analyte, and therefore its free and analytical concentrations (CCD) are similar, (2) the variations in the fluorescence are proportional to the complex concentration, (3) at high CD concentration, essentially all of the analyte molecules are complexed and, (4) extinction coefficients of the free and complexed analyte at the evaluated excitation wavelength are equal. The K11 value can then be calculated through the following expression:14

 
image file: c4ra13023e-t2.tif(2)
where F and F0 are the observed fluorescence intensity in the presence and absence of CD, ϕ and ϕC are the fluorescence quantum yields of the free and complexed analyte, respectively, and K11 is the corresponding association constant. The experimental data for OP and NP systems, and those for BPA in the presence of β-, HP-β, and M–β-CDs were successfully fitted to eqn 2 by a non-linear least-squares procedure, and the corresponding K11 values for the inclusion complexes were obtained (Table 1). The good fit of each plot (Fig. 3) supports the existence of complexes with 1[thin space (1/6-em)]:[thin space (1/6-em)]1 stoichiometric ratio for these systems.

Table 1 Equilibrium constant values for ED–cyclodextrin complexesa
  BPA   OP NP
log[thin space (1/6-em)]K11 log[thin space (1/6-em)]Kst log[thin space (1/6-em)]K11 log[thin space (1/6-em)]K11
NLR B–H NLR B–H NLR B–H
a Standard deviations are given between parentheses. NLR refers to non-linear regression analysis, B–H refers to Benesi–Hildebrand fit, and Kst is the stepwise constant for the 1[thin space (1/6-em)]:[thin space (1/6-em)]2 complex formation (see text).b Calculated from a double-reciprocal fluorescence approach (ref. 6).c Calculated from a double-reciprocal fluorescence approach (ref. 20).d Calculated in 10% v/v MeOH–phosphate buffer from the competitive inhibitory effect of BPA on the inclusion of 2-anilinonaphthalene-6-sulfonic acid by the CD (ref. 7).
β-CD 4.85 (0.04) 4.86 (0.04)   4.17 (0.04) 4.19 (0.02) 3.87 (0.04) 3.88 (0.06)
5.1b
4.9c
4.54d
HE–β-CD 4.75 (0.01)   2.17 (0.03) 4.24 (0.06) 4.21 (0.03) 4.05 (0.05) 4.06 (0.02)
4.56d
HP–β-CD 4.87 (0.02) 4.87 (0.01)   4.46 (0.06) 4.42 (0.07) 4.20 (0.06) 4.23 (0.03)
M–β-CD 5.03 (0.02) 5.01 (0.02)   4.69 (0.02) 4.67 (0.04) 4.42 (0.04) 4.40 (0.09)
DM–β-CD 5.33 (0.03)   1.52 (0.05) 4.77 (0.03) 4.73 (0.04) 4.76 (0.05) 4.74 (0.05)
5.0d


For comparison, Table 1 also includes the obtained K11 values estimated by the Benesi–Hildebrand equation:15

 
image file: c4ra13023e-t3.tif(3)
where ΔF is the difference between the fluorescence intensity in the presence and in the absence of CD, and εC and ε are the molar absorptivities with and without CD. The constant values attained by this procedure are very similar to that obtained by non-linear regression, and the good fit obtained (Fig. 4) also suggests the existence of 1[thin space (1/6-em)]:[thin space (1/6-em)]1 complexes.


image file: c4ra13023e-f4.tif
Fig. 4 Selected examples for Benesi–Hildebrand type plots for BPA, OP and NP–β-CD derivative complexes as indicated. Solid lines are the linear fit to the data.

A rapid inspection of the K11 values in Table 1 allows us to conclude that the interaction between the three EDs and the studied CDs is very strong. This fact could be explained on the basis of the significant hydrophobicity of the studied guest molecules which find in the CD cavity a favorable non-polar environment, favoring the inclusion complex formation. As a consequence, the analytes are protected from non-radiative decay processes occurring in the bulk solution, and thus the fluorescence emission is favored. This fluorescence enhancement produced through complex formation is very significant in the BPA systems. In fact, the fluorescence intensity of BPA increases about 60 times in the presence of derivative β-CDs (e.g. M–β-CD).

From an analytical point of view, these results may be highly useful and auspicious, considering potential applications of CDs for ED extraction in natural matrices, and for the development of sensitive fluorescent methods for ED determination.

The constant value obtained for the BPA–β-CD complex (log[thin space (1/6-em)]K = 4.85) is similar to those reported by different authors in aqueous solution (Table 1). On the other hand, it is not surprising that the constants for complexes formed by BPA and HE–, DM–, and β-CDs in a 10% v/v MeOH–phosphate buffer medium are slightly lower than those here obtained in aqueous solution. In these cases, MeOH would compete with the analyte for the inclusion phenomena. To the best of our knowledge, with the exception of the latter papers, CD inclusion constant values for BPA, OP, and NP were not previously reported in the literature.

In comparing the stabilities of the 1[thin space (1/6-em)]:[thin space (1/6-em)]1 BPA–CD complexes, while insignificant differences are observed between the native β-CD and their hydroxyethyl and hydropropyl derivatives, the complexes formed with o-methyl derivatives seem to be more stable. This fact could be explained on the basis of a possible inductive effect of methyl groups in the o-methyl derivatives on the oxygen lone electron pairs, with the concomitant formation of stronger hydrogen bonds with the free phenol group. A similar conclusion was given by Kitano et al. which ascribed the larger stability of the BPA–DM–β-CD complex to the extension of the non-polar cavity by the substituents at the rim of the CD molecule.7 The dissociation constant values for the phenol group of BPA in the presence of o-methyl derivatives would corroborates this hypothesis (see below).

The complexes formed by BPA are slightly more stable than those formed by OP, which are in turn slightly more stable than those formed by NP. In the OP and NP systems, the presence of hydroxyethyl and hydroxypropyl substituents in the β-CD molecule does not significantly modify the complex stabilities. However, larger inclusion constant values are verified in the OP and NP systems formed by o-methyl derivatives, suggesting participation of these substituents in the complex formation.

As can be observed in Fig. 3, the plots corresponding to BPA–HE–β-CD and BPA–DM–β-CD systems show a different behavior from the previous analysed ones: after the largest fluorescence signal is achieved, a further addition of either HE– or DM–β-CD leads to a fluorescence decrease (more marked in the case of HE–β-CD). In principle, this fact could be ascribed to the formation of a 1[thin space (1/6-em)]:[thin space (1/6-em)]2 BPA–CD complex with a lower intrinsic fluorescence:

 
image file: c4ra13023e-t4.tif(4)
where K12 is the cumulative constant for the 1[thin space (1/6-em)]:[thin space (1/6-em)]2 complex. In these particular systems, the simultaneous presence of both 1[thin space (1/6-em)]:[thin space (1/6-em)]1 and 1[thin space (1/6-em)]:[thin space (1/6-em)]2 complexes can be considered, assuming that the fluorescence quantum yields of the 1[thin space (1/6-em)]:[thin space (1/6-em)]2 complexes are negligible (see below). Thus, the following equation is used for fitting the experimental data:16
 
image file: c4ra13023e-t5.tif(5)

The good fitting results reached for BPA–HE–β-CD and BPA–DM–β-CD systems (Fig. 3) suggest that the above considerations are appropriate. The stepwise constant, Kst, for the formation of the 1[thin space (1/6-em)]:[thin space (1/6-em)]2 complex from BPA–CD and CD is given by:

 
image file: c4ra13023e-t6.tif(6)
and can be calculated from the global K11 and K12 constants. The small values obtained for these stepwise constants (Table 1) indicate a low tendency for 1[thin space (1/6-em)]:[thin space (1/6-em)]2 complex formation. This fact is justified considering the steric restrictions resulting of the inclusion of a second CD molecule. It is conceivable that the latter restrictions cause the BPA molecule to move away from the CD cavities, leading to lower protection by the host and resulting in a decrease of the fluorescence intensity.

Influence of pH in the fluorescence signal

The acid–base spectrofluorimetric titration curves of the studied systems showed that the fluorescence intensity is largest and remains almost constant below pH 9, and decreases at more alkaline values. As an example, Fig. 5 shows the results corresponding to BPA alone and in the presence of M–β-CD.
image file: c4ra13023e-f5.tif
Fig. 5 Experimental and refined three-dimensional plots for fluorescence emission as a function of pH and emission wavelength of BPA in the absence (A) and in the presence of M–β-CD (B), and the corresponding distribution of species as a function of pH. In (A) LH2, LH, and L2− refer to the diprotonated, monoprotonated, and deprotonated forms of BPA, respectively, while XH2 and XH represent the protonated and deprotonated forms of the BPA–M–β-CD complex, respectively. In (A) CBPA = 1000 ng mL−1 and in (B) CBPA = 500 ng mL−1 and CM–β-CD = 2 × 10⁻³ M.

The emission profile of each analyte as a function of pH is related to the fluorescence properties of its protonated and deprotonated species. Thus, the above experiments allowed us to calculate the deprotonation values of the phenol groups of the studied molecules (Fig. 1). Strictly speaking, dissociation constants in the excited-state are obtained through these titrations. However, the fact that the obtained pKa values (Table 2) are similar to those reported in the literature for the ground state3,17–19 suggest that the presently obtained results also correspond to the deprotonation in the ground state. In other words, the fluorescence decay processes are faster than the corresponding deprotonations in the excited state. In addition, the comparison of these latter values with those obtained in the presence of the evaluated CDs is a convenient means of gaining information about the location of the corresponding acid groups, either inside or outside the CD cavity.

Table 2 Deprotonation constant values for the studied EDs at 20 °Ca
Medium BPA OP NP
pKa1 pKa2 pKa pKa
a Standard deviation between parenthesis.b Ref. 17.c Ref. 18.d Ref. 3.e Ref. 19.
Water 9.43 (0.03) 10.18 (0.01) 10.36 (0.03) 10.45 (0.01)
9.6b 10.2b 10.15d 10.15d
9.9c 11.3c   10.7e
β-CD 9.9 (0.1)   10.41 (0.01) 10.41 (0.06)
HE–β-CD 10.16 (0.03)   10.41 (0.03) 10.37 (0.02)
HP–β-CD 10.01 (0.01)   10.40 (0.08) 10.35 (0.01)
M–β-CD 10.39 (0.05)   10.57 (0.09) 10.53 (0.02)
DM–β-CD 10.66 (0.02)   10.65 (0.05) 10.65 (0.04)


It should be noticed that these experiments were made at CD concentrations that guarantee a high percentage of complexed analyte, ensuring that the measured pKa values correspond to the complexed analyte rather than to the free one. In fact, using the association constants given in Table 1, and considering the employed concentrations of CD and analyte, the percentages of formed complex ranged between 94 and 99%. Thus, the measured acidity constants involved a very significant contribution from these complexes, and safer conclusions from the acid–base behavior can be elaborated.

While two deprotonation constants are clearly identified in free BPA, after inclusion into the CD cavity, only a single phenol group is able to deprotonated. In the BPA–β-CD system, the calculated pKa value is similar to pKa1 of free BPA, suggesting that this part of the molecule remains outside the cavity. The pKa values of BPA in the presence of β-CD derivatives are slightly larger than those obtained in their absence, and the difference is more marked with the DM–β-CD. Consequently, an interaction between a phenol group of BPA molecule and the substituent groups of β-CD is verified. These results demonstrate the contribution of the external phenol group of BPA to the outstanding stability of the inclusion β-CD derivative complexes. It is necessary to mention that the low percentage of 1[thin space (1/6-em)]:[thin space (1/6-em)]2 complexes present in both HE– and DM–β-CD systems does not significantly influence the deprotonation constant values obtained.

From the comparison of the deprotonation constants of the single phenol groups of both OP and NP in the analysed media, we can conclude that the pKa values are not significantly modified in the presence of CDs. This fact may be explained considering that the aromatic rings of these compounds are not included in the CD cavity.

Structural analysis

Possible structures of the inclusion complexes were suggested through selective chemical shifts displacements of 1H NMR signals when the analyte is included in the CD cavity. Studies of 1H NMR were performed on the analytes in the absence and in the presence of β-CD, HE–β-CD and M–β-CD, in the latter two cases as representative of two different β-CD derivatives. The addition of CDs selectively influences the chemical shifts of analyte resonances, while the coupling constants (not shown) remain unchanged.

The 1H NMR chemical shifts of free and complexed analytes are shown in Table 3. Separate 1H NMR signals for free and complexed CDs are not observed, as a consequence of the fast exchange between the free and included forms. However, in the presence of CDs, all the BPA protons were slightly shifted upfield. The fact that all (aromatic and aliphatic) protons of BPA are shifted suggests that in the 1[thin space (1/6-em)]:[thin space (1/6-em)]1 complex one of the phenol rings is deeply included in the CD cavity and the bridge holding methyl substituents may also be involved in the complex formation. Different authors examined the geometry of the complexation between BPA and β-CD and concluded, as in the present case, that the BPA molecule is deeply included into the hydrophobic β-CD cavity in different modes, which are in equilibrium, involving the methyl protons and the phenyl ring protons of BPA.7,20,21

Table 3 1H NMR chemical shifts δH (ppm) of BPA, OP, and NP and in the presence of β-CD in DMSO
  BPA OP NP
H3′,5′ H2′,6′ H1,3 H3,5 H2,6 H1′ H2′–7′ H8′ H3,5 H2,6 H1′ H2′–8′ H9′
δguest 6.971 6.625 1.523 6.642 6.948 2.433 1.243 1.485 6.641 6.947 2.433 1.232 1.482
δguest/β-CD 6.965 6.620 1.516 6.636 6.942 2.424 1.229 1.476 6.636 6.942 2.425 1.224 1.475
δguest/HE–β-CD 6.961 6.615 1.514 6.626 6.931 2.423 1.234 1.475 6.622 6.929 2.422 1.224 1.473
δguest/M–β-CD 6.966 6.627 1.520 6.643 6.940 2.427 1.237 1.478 6.643 6.939 2.428 1.232 1.477


On the other hand, in both OP and NP systems, two main inclusions modes of the guest in the cavity can be considered: (1) inclusion of the alkyl chain (tail-mode), and (2) inclusion of the phenolic ring (head-mode). Since slight but sensitive shifts in the resonances for the aliphatic chains of both OP and NP are observed when they are complexed (tail-mode), evidence of van der Waals interactions of these molecular moieties with the studied CD cavities is provided. A similar conclusion was attained by Bonenfant et al. for the NP–β-CD complex through FTIR spectroscopic analyses.10 The obtained 1H NMR results are in agreement with the acidity constant data obtained in aqueous solution, despite the fact that the NMR study was performed in DMSO.

Semiempirical MO calculations using the AM1 Hamiltonian (or AM1 method) in the frame of the Hyperchem program are frequently used to study geometrical and thermodynamic properties of organic molecules, particularly when hydrogen bonding occurs. Isolated CDs and the three analytes were first optimized. Then, each analyte was included into the evaluated CD cavity and the geometry was refined again. These calculations were performed by placing the complexes in a box containing 830 water molecules. Several initial modes of inclusion were probed and optimized by energy minimization. The structures of the BPA–CD complexes leading to minimum heats of formation (Fig. 6) render negative values in all cases and they agree with the above 1H-NMR results. Geometry optimization for both OP and NP–CD complexes shows that these analytes prefer one of the two possible axial modes (tail and head) of inclusion: the form where the host molecule enters the CD cavity from the alkyl chain, according to the conclusion obtained above (Fig. 6). For comparison, Table 4 shows the heat of formation for OP and NP–CD complexes considering the two different insertion modes.


image file: c4ra13023e-f6.tif
Fig. 6 Optimized structures (AM1 calculations) for M–β-CD inclusion complexes.
Table 4 AM1 calculated heats of formation (kcal mol−1) for different inclusion modes for 1[thin space (1/6-em)]:[thin space (1/6-em)]1 OP and NP–CD complexes
  OP NP
β-CD
Head-mode −21.2 −29.6
Tail-mode −84.5 −57.6
[thin space (1/6-em)]
HE–β-CD
Head-mode −25.9 −27.8
Tail-mode −66.0 −88.4
[thin space (1/6-em)]
HP–β-CD
Head-mode −22.9 −20.8
Tail-mode −83.0 −109.9
[thin space (1/6-em)]
M–β-CD
Head-mode −35.0 −107.4
Tail-mode −78.5 −136.8
[thin space (1/6-em)]
DM–β-CD
Head-mode −49.2 −57.5
Tail-mode −84.6 −77.5


Analytical parameters

The significant enhancement of the fluorescence intensities of the studied compounds in the presence of selected CDs can be used for quantitative purposes. According to the above results, M–β-CD at a concentration that ensures the largest fluorescence signal was selected for building calibration curves. For comparison, the construction of curves in the absence of this CD was also carried out and, in order to evaluate the effect of the selected excitation wavelength on the calibration parameters, different maxima were tested. Because the goal is to detect low concentrations of EDs, no attempts were made to establish the upper concentrations of the linear ranges, and restricted concentration ranges were evaluated. Table 5 summarizes the obtained results.
Table 5 Calibration results for BPA, OP and NP in the absence and in the presence of M–β-CDa
  BPA OP NP
λexc λexc λexc
225 nm 278 nm 220 nm 278 nm 220 nm 278 nm
a The number of data for each calibration curve corresponds to seven different concentration levels, with three replicates for each level (n = 21). CM–β-CD = 1.5 × 10⁻³ mol L−1.b Calibration range.c Correlation coefficient.d Intercept (standard deviation in the last figure within parentheses).e Slope (standard deviation in the last figure within parentheses).f Analytical sensitivity: γ = b/sy/x, where sy/x is the standard deviation of the regression residuals.g Limit of detection calculated according to eqn (7).h Limit of quantification calculated according to eqn (8).i Relative standard deviation. In all cases five replicates were measured (COP = CNP = 111 ng mL−1; CBPA = 413 ng mL−1).j Idem item i (CBPA = COP = CNP = 111 ng mL−1; CM–β-CD = 1.5 × 10⁻³ mol L−1).
Without M–β-CD
CRb (ng mL−1) 0–1000 0–1000 0–200 0–200 0–200 0–200
Rc 0.9892 0.9911 0.9962 0.9969 0.9890 0.9934
ad 1.2 (2) 8.7 (1) 1.7 (3) 8.8 (2) 0.9 (1) 8.43 (8)
be 0.0092 (3) 0.0066 (2) 0.126 (3) 0.088 (7) 0.034 (1) 0.0299 (6)
γf (ng−1 mL) 0.02 0.02 0.16 0.17 0.09 0.12
LODg (ng mL−1) 128 115 15 13 25 20
LOQh (ng mL−1) 370 334 43 39 73 56
RSDi (%) 11 10 6 3 9 11
[thin space (1/6-em)]
With M–β-CD
CR (ng mL−1) 0–200 0–200 0–200 0–200 0–200 0–200
R 0.9997 0.9990 0.9993 0.9990 0.9987 0.9982
a 18.0 (4) 17.3 (3) 19.9 (3) 15.9 (2) 12.8 (2) 14.1 (1)
b 0.588 (3) 0.308 (3) 0.339 (3) 0.201 (2) 0.145 (2) 0.064 (1)
γ (ng−1 mL) 0.55 0.30 0.37 0.30 0.14 0.23
LOD (ng mL−1) 4 8 6 8 9 10
LOQ (ng mL−1) 12 22 18 22 27 29
RSDj (%) 2 2 4 3 3 5


Limits of detection and quantitation have been calculated using the expressions recommended by IUPAC:22

 
image file: c4ra13023e-t7.tif(7)
 
image file: c4ra13023e-t8.tif(8)
where sy/x is the standard deviation of the regression residuals, b is the slope of the calibration curve, and h is the sample leverage at zero analyte concentration. The factor 2t0.05,19 in eqn (7) is the sum of t-coefficients accounting for type I and II errors (false detects and false non-detects, respectively) at 95% confidence level and n − 2 degrees of freedom (n is the number of calibration samples). Eqn (7) takes into account the error propagation from both the slope and the intercept of the calibration curve. The factor 10 in eqn (8) ensures a maximum relative error of 10%.

As expected, calibrations in the presence of CD render excellent results, with detection limits in the range 4–10 ng mL−1 for the three EDs, with relative standard deviations (n = 5) of 2–4%. The advantage of using M–β-CD in the determinations is especially noteworthy in the BPA system.

In comparing the results using different maximum excitation wavelengths, one may note that the difference is significant in the systems containing the organized medium. This result can be justified considering the relative intensities of the two excitation maxima in the latter systems.

Although there are numerous papers devoted to the determination of BPA and other EDs in different matrices, here only a few were selected for discussion. In a recent review, more than forty references related to the analysis of BPA in environmental, food and beverage samples using sensors and biosensors of different nature have been cited.23 In these works, a wide range of limits of detection are exposed, including values from about 1 × 10⁻⁵ to 50 ng mL−1. A selective but not very sensitive method (LOD = 120 ng mL−1) for BPA detection based on surface-imprinted core–shell Au nanoparticles and surface-enhanced Raman scattering has been reported.24 Following an ionic liquid dispersive liquid-phase microextraction and a subsequent chromatographic analysis, BPA, OP and NP were determined in water samples at spiked concentrations between 7.5 and 180 ng mL−1, with limits of detection in the range 0.23–0.48 ng mL−1.25 Three-phase hollow fiber-based liquid phase microextraction coupled to high-performance liquid chromatography allowed the determination of both OP and NP in environmental waters, with LODs of about 0.5 ng mL−1.3 After a pre-concentration procedure with C18 solid-phase extraction cartridges and using ultra-fast liquid chromatography, limits of detection at parts-per trillion levels were achieved for BPA, OP and NP in seawater samples.26

Considering that the proposed methodology involves direct measurements in an aqueous solvent and employing very simple equipment, the attained limits of detection in the presence of M–β-CD are very suitable. In addition, it is necessary to remark that most of the above mentioned detection limits were based on a signal-to-noise ratio (S/N = 3), while in the present case a more rigorous calculation was performed (see above).

Conclusions

The fluorescence intensity of BPA, OP and NP in water is significantly enhanced by β-cyclodextrin and its hydroxyethyl, hydroxypropyl and o-methyl derivatives. The changes in the fluorescence intensity in aqueous solutions with increasing concentrations of cyclodextrin were used to evaluate both the stability and stoichiometry of the formed complexes, without interferences of organic solvent molecules, usually employed for dissolving the analytes. The high constant association values for the 1[thin space (1/6-em)]:[thin space (1/6-em)]1 complexes, in the range of about 8 × 10³ to 2 × 10⁵ mol−1 L, demonstrate that the interaction of these hydrophobic molecules with the cyclodextrin nanocavity is very strong. This result, in addition to the non-toxic character of CDs to humans and the environment, is very advantageous and positions the selected cyclodextrins as excellent candidates for extraction, pre-concentration and depollution processes of the studied EDs. Moreover, as was demonstrated, the use of methyl–β-cyclodextrin could be a suitable strategy to determine BPA, OP and NP at parts-per-billion levels, without using either derivatization reactions or toxic organic solvents. The acidity constants of the studied EDs, their 1H NMR spectra and semiempirical calculations in both the presence and absence of cyclodextrins allow us to conclude about structural issues of the formed complexes.

Acknowledgements

The authors are grateful to the Universidad Nacional de Rosario, Consejo Nacional de Investigaciones Científicas y Técnicas (CONICET, Project PIP 0163), and Agencia Nacional de Promoción Científica y Tecnológica (PICT 2013-0136) for financially supporting this work.

References

  1. H. S. Chang, K. H. Choo, B. Lee and S. J. Choi, J. Hazard. Mater., 2009, 172, 1–12 CrossRef CAS PubMed.
  2. L. Zhang, J. C. Er, W. Xu, X. Qin, A. Samanta, S. Jana, C. L. K. Lee and Y. T. Chang, Anal. Chim. Acta, 2014, 815, 51–56 CrossRef CAS PubMed.
  3. M. Villar-Navarro, M. Ramos-Payán, R. Fernández-Torres, M. Callejón-Mochón and M. A. Bello-López, Sci. Total Environ., 2013, 443, 1–6 CrossRef CAS PubMed.
  4. A. Pal, Y. He, M. Jekel, M. Reinhard and K. Y. H. Gin, Environ. Int., 2014, 71, 46–62 CrossRef CAS PubMed.
  5. V. K. Sharma, G. A. Anquandah, R. A. Yngard, H. Kim, J. Fekete, K. Bouzek, A. K. Ray and D. Golovko, J. Environ. Sci. Health, Part A: Toxic/Hazard. Subst. Environ. Eng., 2009, 44, 423–442 CrossRef CAS PubMed.
  6. M. Del Olmo, A. Zafra, A. González Casado and J. L. Vilchez, Int. J. Environ. Anal. Chem., 1998, 69, 99–110 CrossRef CAS.
  7. H. Kitano, H. Endo, M. Gemmei-Ide and M. Kyogoku, J. Inclusion Phenom. Macrocyclic Chem., 2003, 47, 83–90 CrossRef CAS.
  8. A. D. Batista and F. R. P. Rocha, Int. J. Environ. Anal. Chem., 2013, 93, 1402–1412 CrossRef CAS.
  9. N. Kawasaki, M. Araki, T. Nakamura and S. Tanada, J. Colloid Interface Sci., 2001, 238, 215–218 CrossRef CAS PubMed.
  10. D. Bonenfant, P. Niquette, M. Mimeault, A. Furtos Matei and R. Hausler, Water Res., 2009, 43, 3575–3581 CrossRef CAS PubMed.
  11. G. A. Ibañez, G. M. Escandar and A. C. Olivieri, Chem. Educ., 2007, 12, 22–28 Search PubMed.
  12. R. L. Pérez and G. M. Escandar, Analyst, 2013, 138, 1239–1248 RSC.
  13. J. Szejtli, Pure Appl. Chem., 2004, 76, 1825–1845 CrossRef CAS.
  14. C. N. Sanramé, R. H. de Rossi and G. A. Argüello, J. Phys. Chem., 1996, 100, 8151–8156 CrossRef.
  15. N. Sadlej-Sosnowska, J. Fluoresc., 1997, 7, 195–200 CrossRef CAS.
  16. C. Tablet, I. Matei and M. Hillebrand, The Determination of the Stoichiometry of Cyclodextrin Inclusion Complexes by Spectral Methods: Possibilities and Limitations, in Stoichiometry and Research, The importance of Quantity in Biomedicine, ed. A. Innocenti, Intech, Rijeka, Croacia, 2012, ch. 3 Search PubMed.
  17. C. A. Staples, P. B. Dorn, G. M. Klečka, S. T. O'Block and L. R. Harris, Chemosphere, 1998, 36, 2149–2173 CrossRef CAS.
  18. I. Rykowska and W. Wasiak, Acta Chromatogr., 2006, 16, 7–27 CAS.
  19. Z. Mao, X. F. Zheng, Y. Q. Zhang, X. X. Tao, Y. Li and W. Wang, Int. J. Mol. Sci., 2012, 13, 491–505 CrossRef CAS PubMed.
  20. S. Chelli, M. Majdoub, M. Jouini, S. Aeiyach, F. Maurel, K. I. Chane-Ching and P. C. Lacaze, J. Phys. Org. Chem., 2007, 20, 30–43 CrossRef CAS.
  21. Z. X. Yang, Y. Chen and Y. Liu, Carbohydr. Res., 2008, 343, 2439–2442 CrossRef CAS PubMed.
  22. L. A. Currie, Anal. Chim. Acta, 1999, 391, 127–134 CrossRef CAS.
  23. K. V. Ragavan, N. K. Rastogi and M. S. Thakur, Trends Anal. Chem., 2013, 52, 248–260 CrossRef CAS PubMed.
  24. J. Q. Xue, D. W. Li, L. L. Qu and Y. T. Long, Anal. Chim. Acta, 2013, 777, 57–62 CrossRef CAS PubMed.
  25. Q. Zhou, Y. Gao and G. Xie, Talanta, 2011, 85, 1598–1602 CrossRef CAS PubMed.
  26. N. S. Lisboa, C. S. Fahning, G. Cotrim, J. P. dos Anjos, J. B. de Andrade, V. Hatje and G. O. da Rocha, Talanta, 2013, 117, 168–175 CrossRef CAS PubMed.

This journal is © The Royal Society of Chemistry 2015
Click here to see how this site uses Cookies. View our privacy policy here.