Functionalizable red emitting calcium sensor bearing a 1,4-triazole chelating moiety†
Mayeul Collot*a,
Christian Wilmsb and
Jean-Maurice Malletcde
aLaboratoire de Biophotonique et Pharmacologie, UMR 7213 CNRS, Université de Strasbourg, Faculté de Pharmacie, 74, Route du Rhin, 67401, Illkirch, France. E-mail: mayeul.collot@unistra.fr
bWolfson Institute for Biomedical Research and Department of Neuroscience, Physiology and Pharmacology, University College London, Gower Street, London WC1E 6BT, UK
cLaboratory of Biomolecules (LBM), UPMC Université Paris 06, Paris F-75005, France
dEcole Normale Supérieure (ENS), Paris F-75005, France
eCNRS, UMR 7203, Paris F-75005, France
First published on 19th December 2014
Abstract
Herein we developed a functionalizable OFF–ON red emitting fluorescent calcium probe based on a new chelating system formed by CuAAC click chemistry (Huisgen cycloaddition). The pro-sensor 7 which is not sensitive to Ca2+, contains an alkyne moiety that, upon the click reaction, forms a chelating group involving the 1,4-triazole. Probe 10 exhibited good sensitivity towards calcium (Kd = 5.8 μM) and zinc (5.6 μM) with a high dynamic range (65 fold fluorescence increase), high quantum yield (0.59) and showed very low fluorescence enhancement in the presence of a high concentration of Mg2+. We extended this method and generated two dextran conjugates in order to compare their sensing properties with those of the molecular form of 10.
1 Introduction
Ca2+ is a ubiquitous second messenger involved in numerous intracellular signalling cascades. Therefore fluorescent Ca2+ indicators are indispensable tools for studying spatiotemporal fluctuations of intracellular free Ca2+ concentration ([Ca2+]i).1,2 The first fluorescent Ca2+ probes were introduced by Tsien and colleagues in the mid-eighties involving the BAPTA (1,2-bis(o-aminophenoxy)ethane-N,N,N′,N′-tetraacetic acid) chelating moiety.3 Consequently, most Ca2+ indicators, and certainly those that work best, combined BAPTA with fluorescein derivatives and hence emit yellow/green fluorescence.4,5 However, the increasing use of cells transfected with fluorescent proteins (FPs), of FP expressing transgenic mice for targeting identified subpopulations of cells, together with the advent of optical techniques for purposes other than imaging require the development of new red Ca2+ probes.6,7 We recently reviewed the red-fluorescent calcium indicators allowing photoactivation and multi-color imaging8 and contributed in this field by developing a new family of functionalizable red emitting calcium sensors based on BAPTA, the Ca-Rubies, with various dissociation constants (Kd).9 Cellular Ca2+ signals cover concentrations from near 100 nM for the basal free [Ca2+]i of most mammalian cells to >100 μM at the peak of Ca2+ microdomains. A Ca2+ probe works best if its dissociation constant is close to the intracellular Ca2+ concentration. However, if the Kd is too large, Ca2+ measurement will be insensitive; on the other hand, if the calcium concentration is higher or is involved in fast transients, the probe with small Kd could saturate quickly and results in inaccurate measurement. Therefore, it is of great importance to develop fluorescent sensors with micromolar range Kd for the measurement of accurate intracellular Ca2+ fast transients. To our knowledge, only few alternatives to BAPTA systems have been reported as new calcium sensors. APTRA (aminophenol triacetic acid) developed by Levy et al.10 has a poor selectivity for Ca2+ over other divalent ions. Other systems like MOBHA (2-(2′-morpholino-2′-oxoethoxy)-N,N-bis(hydroxycarbonyl methyl)aniline)11 or sensors based on PEGylated moieties either display low affinities or aggregate under biological conditions.12 Most of fluorescent metal sensors tend to compartmentalize in cells du to their hydrophobicity, therefore the capability of functionalization can lead to much higher hydrophilicity or specificity and thus extend the scope as the probe can be linked for instance to polymer, particles, peptide or dextran.In this work, we describe an unprecedented system where the pro-sensor 7 becomes a calcium sensor upon functionalisation via Huisgen cycloaddition by completing the coordination sphere of calcium involving the N-3 of the newly formed 1,4-triazole moiety (abstract scheme). These sensors (molecular form and dextran conjugates) based on the PET (Photoinduced Electron Transfer) quenching phenomena display a bright red fluorescence upon binding to Ca2+ with low micromolar range Kds combined to a strong fluorescence enhancement and a very low sensitivity towards Mg2+.
2 Results and discussion
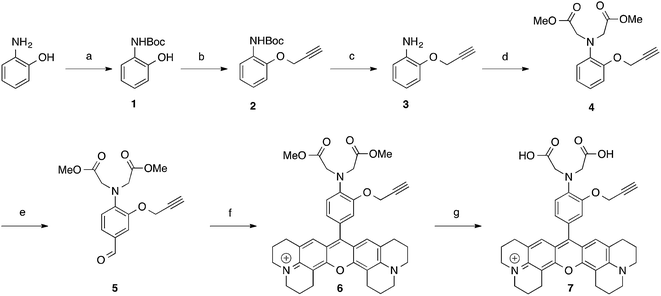
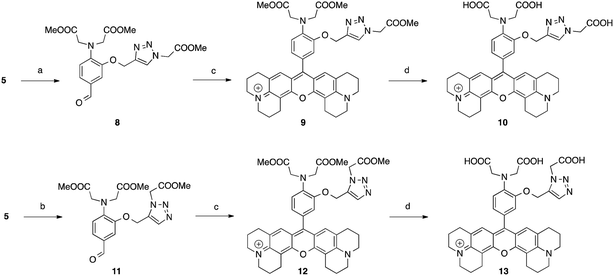
Huisgen 1,3-dipolar azide–alkyne cycloaddition has become the most popular “click chemistry” type reaction due to its efficiency and the availability of the reactants.13 1,4-Triazole moieties formed after this ligation have already successfully been used to form complexes with metals14,15 and also served for the development of fluorogenic sensors.16–19 To this regard, 7 was designed to provide a functionalisable fluorophore with a new chelating pattern involving the N,N-diacetic acid aminophenoxy moiety taken from BAPTA as well as the nitrogen-3 of the newly formed 1,4-triazole moiety making this system a “2 in 1” approach. The synthesis starts with 2-aminophenol to obtain aldehyde 5 in 5 steps with an overall yield of 43%. 5 was then converted into the corresponding X-rhodamine 6 to give, after saponification, the clickable pro-sensor 7 (Scheme 1).5 was then involved in a Huisgen cycloaddition catalysed by CuI in order to afford the 1,4-triazole compound 8, the latter was converted into the X-rhodamine 9 and finally saponified to yield the probe 10 (Scheme 2). In order to study the involvement of the N-3 of the triazole moiety, a 1,5-triazole isomer 13 of the sensor 10 was synthesised. 5 was reacted with methyl 2-azidoacetate in presence of a small amount (0.04 equivalent) of [RuClCp*(PPh3)2] as a catalyst20 to furnish 11 which was transformed in two steps in 13 (Scheme 2). Isomers 10 and 13 only differ from the availability of a nitrogen atom of the triazole groups. Whereas 10 is able to form a chelate with the N-3 of its 1,4-triazole, the steric conformation of 13 does not allow the participation of any nitrogen atom to complete the chelation ability of the molecule.
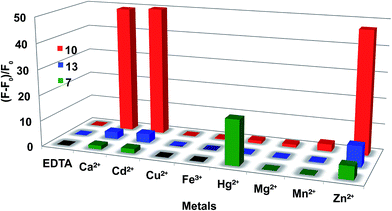
The chelating properties of fluorescent sensors 7, 10 and 13 were then investigated by fluorescence spectroscopy. First, the fluorescence enhancement (ΔF/F0) of the sensors in the presence of 3 equivalents of various metals (Ca2+, Cd2+, Cu2+, Fe3+, Hg2+, Mg2+, Mn2+ and Zn2+) was evaluated (Fig. 1).
In the case of the pro-sensor 7, the majority of tested metals did not trigger the fluorescence or only small enhancements were observed (Zn, 5 fold). Interestingly, 7 displayed a quite significant fluorescence enhancement in presence of Hg2+ with a ΔF/F0 of 17 fold. This could be explained by an oxymercuration21,22 reaction of the alkyne moiety of 7 leading to a stabilised organomercury complex (Scheme 3).
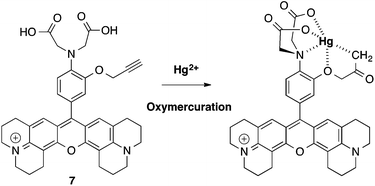 | ||
| Scheme 3 Proposed formation of stabilised mercury chelate via an oxymercuration reaction involving 7. | ||
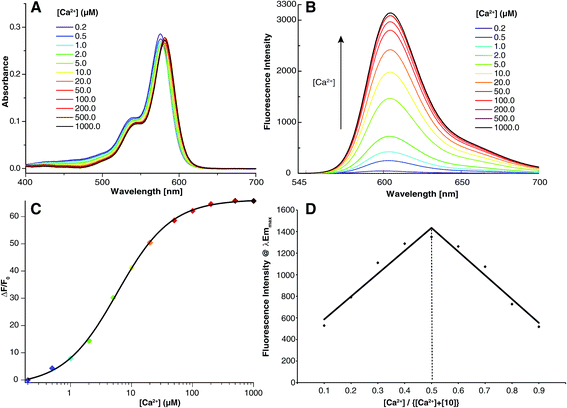
Whereas 10 exhibits strong responses with Ca2+, Cd2+ and Zn2+ up to 52 folds for Cd2+ and 49 for Ca2+, 13 gave only weak fluorescence enhancements with Ca2+ and Cd2+ and a ΔF/F0 of 7.9 fold with Zn2+ (Fig. 1). These results suggest that the N-3 of the 1,4-triazole is involved in the stabilisation of a calcium complex. This hypothesis was confirmed by the dissociation constants measurements. 10 exhibited substantially the same high affinity for Ca2+ and Zn2+ (Kd Ca2+ = 5.84 ± 0.21 μM, Kd Zn2+ = 5.68 ± 0.14) whereas 7 and 13 have low affinity towards these metals (Table 1). Job's plot evidenced that 10 formed a 1![[thin space (1/6-em)]](https://www.rsc.org/images/entities/char_2009.gif) :
:![[thin space (1/6-em)]](https://www.rsc.org/images/entities/char_2009.gif) 1 complex with Ca2+ which displays a bright red fluorescence at 604 nm with an increase of quantum yield of 78 fold and a fluorescence enhancement of 65 fold (Fig. 2). In view to these results, 10, which has a KdCa close to our previously published CaRuby-F, can be considered as an efficient Ca2+ sensor as the concentration of Zn2+ in cells is nanomolar, far below its KdZn.23
1 complex with Ca2+ which displays a bright red fluorescence at 604 nm with an increase of quantum yield of 78 fold and a fluorescence enhancement of 65 fold (Fig. 2). In view to these results, 10, which has a KdCa close to our previously published CaRuby-F, can be considered as an efficient Ca2+ sensor as the concentration of Zn2+ in cells is nanomolar, far below its KdZn.23
| Compound | λAbsa (nm) | ε (M−1 cm−1) | λEma (nm) | ΦEGTAb | ΦCa | ΦCa/ΦEGTA | KdZnc (μM) | KdCac (μM) |
|---|---|---|---|---|---|---|---|---|
| a Calcium free [EGTA] = 1 mM and [Ca2+] = 1 mM.b Calcium free [EGTA] = 1 mM.c Obtained by fitting the data with Hill's equation.d Fitting the data with Hill's equation provided no result. | ||||||||
| 7 | 577–582 | 48![[thin space (1/6-em)]](https://www.rsc.org/images/entities/char_2009.gif) 000 000 |
606–608 | 0.004 | 0.06 | 6 | 205 ± 40 | N/Ad |
| 10 | 576–581 | 54![[thin space (1/6-em)]](https://www.rsc.org/images/entities/char_2009.gif) 000 000 |
599–604 | 0.007 | 0.59 | 78 | 5.6 ± 0.1 | 5.8 ± 0.2 |
| 13 | 576–580 | 80![[thin space (1/6-em)]](https://www.rsc.org/images/entities/char_2009.gif) 000 000 |
601–605 | 0.005 | 0.29 | 54 | 118.91 ± 3.9 | 448 ± 10 |
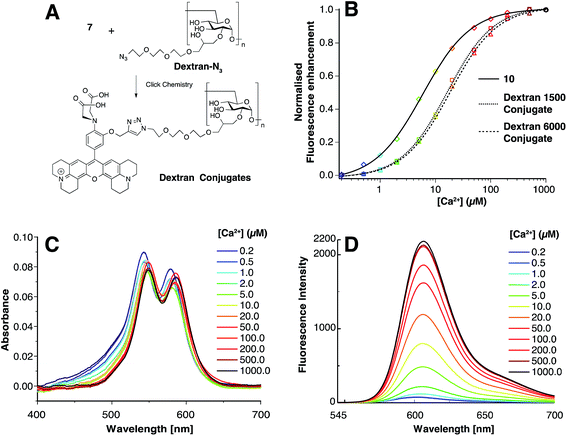
A fluorescent calcium probe intended for use in cellular assays should fulfil several criteria. First the sensitivity to pH variations met in cells should not interfere with the signal obtained in response to Ca2+. pH sensitivity of 10 was evaluated and whereas the pKa value was found to be in the physiological range (5.93 ± 0.07), the fluorescence enhancement from pH 7.5 to pH 4.5 is only 1.9 fold (Fig. S2†) which is negligible in regard of the much higher fluorescence increase (65 fold) provoked by Ca2+. A major drawback in molecular Ca2+ probes is that their hydrophobicity often leads to compartmentalization in organelles such as plasma membrane, ER (Endoplasmic Reticulum), mitochondria, etc. To avoid this issue, probes can be linked to non toxic and inert dextrans which are effective water-soluble carriers for dyes and indicators.24 Dextran conjugates have enhanced hydrophilicity and hence, facilitate the distribution of the probe in the cytosol through microinjection.25 Therefore, pro-sensor 7 was linked via click chemistry to two prepared azido-dextrans (obtained from dextran of 1500 MW and dextran 6000 MW, see ESI†) (Fig. 3A) in order to study the influence of the dextran carrier on the Ca2+ sensing properties. Despite dextran conjugates 1500 and 6000 displayed slightly higher KdCa of 16.3 ± 0.6 μM and 18.3 ± 0.8 μM respectively (Fig. 3B), their fluorescence enhancement, respectively 41 and 36 fold, make them efficient calcium sensors. The slight drop of sensitivity (fluorescence enhancement) could be attributed to the formation of dark H-aggregates due to the proximity of the sensors within the dextran polymer as the absorbance spectra exhibited a second band at 545 nm (Fig. 3C). This phenomenon could be reduced by decreasing the number of sensors per dextran molecules (14 sensors per 100 glucose units). The shift of the KdCa values could be attributed to an effect that we recently described as a remote control.26 Even though the coordination sphere is not affected by what the probe is linked to, the close environment of the complex can influence the dissociation constant. While, in the case of 10, a close negative charge (COO−) seems to increase the affinity of the sensor towards Ca2+, a side PEG chain, in the case of the dextran conjugates, slightly lower this affinity, these results are in accordance to what we already observed.
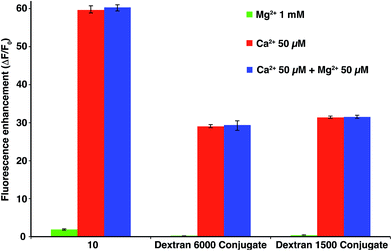
Finally, since Mg2+ is buffered in the cytoplasm at concentration in the sub-millimolar range, it is of extreme importance that the sensor remains insensitive to Mg2+ at high concentrations to avoid background fluorescence. Fig. 4 shows that 10 and its dextran conjugates were virtually non sensitive to high concentration of Mg2+ (1 mM), moreover the presence of an equimolar concentration of Mg2+ an Ca2+ does not influence the fluorescence enhancement of the sensors.
The properties of these dextran conjugates are attractive for potential cell biology applications. In the case of measurement of intracellular calcium ion ([Ca2+]i) transients in myocytes, it was shown that low affinity indicators, like Furaptra (KdCa ∼ 50 μM), yielded greater peak amplitude of stimulated [Ca2+]i transients than those obtained with high affinity indicators (Fura-2 KdCa = 240 nM). This is partially due to the detrimental buffering effect of high affinity indicators.27 Therefore, the dextran conjugates we present, could offer an interesting alternative to Furaptra with no sensitivity towards Mg2+, an enhance brightness, red-shifted absorption and emission spectra, lower Kds and a better hydrophilicity brought by the dextran molecules.
3 Conclusion
We developed a new Ca2+ sensor system where the newly formed 1,4-triazole moiety is involved in the chelation pattern. The pro-sensor 7 is insensitive to Ca2+ and thus can be used to functionalise any azide decorated (bio)molecule, polymers or chips without need to separating the precursor from the product. This system is readily accessible and represents a good alternative to micromolar range BAPTA based sensors. Moreover, its sensitivity and brightness combined to its functionalisable capability makes this system a valuable tool for potential monitoring of Ca2+ transients. These new indicators (molecular sensor 10 and dextran conjugates) feature very good properties and we believe that as red, Mg2+ insensitive, low affinity fluorescent Ca2+ probes, they will strengthen the arsenal of fluorescent Ca2+ sensors.4 Experimental
4.1 Materials and general methods
All the solvents were of analytical grade. Chemicals were purchased from commercial sources. The salts used in stock solutions of metal ions were CaCl2·2H2O, CdCl2, CuCl2·2H2O, FeCl3·6H2O, HgCl2, KCl, MgCl2·6H2O, MnCl2·4H2O, NaCl, Zn(NO3)2. 1H-NMR and 13C-NMR were measured on a Bruker avance III-300 MHz spectrometer with chemical shifts reported in ppm (TMS as internal standard). Mass spectra were measured on a Focus GC/DSQ II spectrometer (ThermoScientific) for IC and an API 3000 spectrometer (Applied Biosystems, PE Sciex) for ES. All pH measurements were made with a Mettler Toledo pH-Meter. Fluorescence spectra were recorded on a JASCO FP-8300 spectrofluorometer. Absorption spectra were measured on a VARIAN CARY 300 Bio UV-Visible spectrophotometer. All measurements were done at a set temperature of 25 °C. The purity of the dyes were checked by RP-HPLC C-18, eluant: ACN 0.1% TFA/water 0.1% TFA, method: 20/80 to 100/0 within 20 min then 100/0 for 10 min. detection at λAbs = 254 nm.4.2 Synthesis
1 was synthesized according to a published protocol.28![[triple bond, length as m-dash]](https://www.rsc.org/images/entities/char_e002.gif) CH), 76.07 (C
CH), 76.07 (C![[triple bond, length as m-dash]](https://www.rsc.org/images/entities/char_e002.gif) CH), 56.47 (CH2), 28.40 (tBu). MS (CI), calcd for C14H17NO3 [M]+ 247.1, found 247.1, HRMS (CI), C14H17NO3 [M]+ 247.1208, found 247.1195.
CH), 56.47 (CH2), 28.40 (tBu). MS (CI), calcd for C14H17NO3 [M]+ 247.1, found 247.1, HRMS (CI), C14H17NO3 [M]+ 247.1208, found 247.1195.![[triple bond, length as m-dash]](https://www.rsc.org/images/entities/char_e002.gif) CH), 75.37 (C
CH), 75.37 (C![[triple bond, length as m-dash]](https://www.rsc.org/images/entities/char_e002.gif) CH), 56.81 (OCH2), 53.77 (NCH2), 51.82 (OMe). MS (ES+), calcd for C15H17NO5Na [M + Na]+ 314.1, found 314.4. HRMS (ES+), calcd for C15H18NO5 [M + H]+ 292.1179, found 292.1197.
CH), 56.81 (OCH2), 53.77 (NCH2), 51.82 (OMe). MS (ES+), calcd for C15H17NO5Na [M + Na]+ 314.1, found 314.4. HRMS (ES+), calcd for C15H18NO5 [M + H]+ 292.1179, found 292.1197.![[triple bond, length as m-dash]](https://www.rsc.org/images/entities/char_e002.gif) CH), 76.10 (C
CH), 76.10 (C![[triple bond, length as m-dash]](https://www.rsc.org/images/entities/char_e002.gif) CH), 56.71 (OCH2), 54.08 (NCH2), 52.16 (OMe). MS (CI), calcd for C16H18NO6 [M + H]+ 320.1, found 320.1, HRMS (CI), C16H18NO3 [M + H]+ 320.1129, found 320.1191.
CH), 56.71 (OCH2), 54.08 (NCH2), 52.16 (OMe). MS (CI), calcd for C16H18NO6 [M + H]+ 320.1, found 320.1, HRMS (CI), C16H18NO3 [M + H]+ 320.1129, found 320.1191.4.3 Synthesis of X-rhodamine: typical procedure
![[triple bond, length as m-dash]](https://www.rsc.org/images/entities/char_e002.gif) CH), 2.27 (s, 3H, Me PTSA counter ion), 2.12–1.98 (m, 8H, H5, H2). 13C-NMR (75 MHz, CDCl3): δ 171.73 (CO esters), 154.11 (C Ar), 152.22 (C Ar), 151.04 (C Ar), 148.20 (C Ar), 144.65 (C Ar), 141.08 (C Ar), 138.14 (C Ar), 128.15 (CH PTSA), 126.77 (C7), 126.29 (CH PTSA), 125.35, 124.10 (CH Ar), 123.56, 118.09 (CH Ar), 116.10 (CH Ar), 112.75, 105.43, 78.00 (C
CH), 2.27 (s, 3H, Me PTSA counter ion), 2.12–1.98 (m, 8H, H5, H2). 13C-NMR (75 MHz, CDCl3): δ 171.73 (CO esters), 154.11 (C Ar), 152.22 (C Ar), 151.04 (C Ar), 148.20 (C Ar), 144.65 (C Ar), 141.08 (C Ar), 138.14 (C Ar), 128.15 (CH PTSA), 126.77 (C7), 126.29 (CH PTSA), 125.35, 124.10 (CH Ar), 123.56, 118.09 (CH Ar), 116.10 (CH Ar), 112.75, 105.43, 78.00 (C![[triple bond, length as m-dash]](https://www.rsc.org/images/entities/char_e002.gif) CH), 76.28 (C
CH), 76.28 (C![[triple bond, length as m-dash]](https://www.rsc.org/images/entities/char_e002.gif) CH), 56.78 (CH2O), 53.87 (NCH2), 52.15 (2 OMe), 50.95 (C1 or C4), 50.48 (C1 or C4), 27.73 (C3), 21.29 (Me PTSA), 20.73 (C2), 19.96 (C6), 19.77 (C5). MS (ES+), calcd for C40H42N3O6 [M]+ 660.3, found 660.7. HRMS (ES+), calcd for C40H42N3O6 [M]+ 660.3068, found 660.3079.
CH), 56.78 (CH2O), 53.87 (NCH2), 52.15 (2 OMe), 50.95 (C1 or C4), 50.48 (C1 or C4), 27.73 (C3), 21.29 (Me PTSA), 20.73 (C2), 19.96 (C6), 19.77 (C5). MS (ES+), calcd for C40H42N3O6 [M]+ 660.3, found 660.7. HRMS (ES+), calcd for C40H42N3O6 [M]+ 660.3068, found 660.3079.9 was obtained as a purple solid after lyophilisation with ∼20% yield. 1H-NMR (300 MHz, CDCl3): δ 8.11 (s, 1H, H triazol), 7.71 (d, J = 8.1 Hz, 2H, 2CH PTSA), 6.95 (dd, J = 4.8, 3.0 Hz, 3H, CH PTSA, 1CH Ar), 6.86–6.73 (m, 4H, CH Ar), 5.22 (s, 2H, CH2COOMe), 5.11 (s, 2H, OCH2), 4.16 (s, 4H, NCH2), 3.68 (s, 3H, OMe), 3.65 (s, 6H, 2 OMe), 3.44 (m, 8H, H1, H4), 2.94 (t, J = 6.1 Hz, 4H, H6), 2.69–2.64 (m, 4H, H3), 2.18 (s, 3H, Me PTSA), 2.02 (t, J = 5.1 Hz, 4H, H5), 1.93–1.91 (m, 4H, H2). 13C-NMR (75 MHz, CDCl3): δ 171.82 (CO esters), 166.99 (CO ester), 154.70 (C Ar), 152.26 (C Ar), 151.02 (C Ar), 149.12 (C Ar), 144.59 (C Ar), 142.88 (C Ar), 141.13 (C Ar), 138.21 (C Ar), 128.18 (CH PTSA), 127.03 (C7), 126.23 (CH PTSA), 126.09 (CH triazol), 125.36 (C Ar), 123.63 (C Ar), 123.48 (CH Ar), 117.91 (CH Ar), 115.93 (CH Ar), 112.88 (C Ar), 105.24 (C Ar), 62.56 (OCH2), 53.82 (NCH2), 52.92 (OMe), 52.03 (2 OMe), 50.96 (C1 or C4), 50.79 (CH2COOMe), 50.44 (C1 or C4), 27.64 (C3), 21.28 (Me PTSA), 20.74 (C2), 19.97 (C6), 19.81 (C5). MS (ES+), calcd for C43H47N6O8 [M]+ 775.3, found 776.0. HRMS (ES+), calcd for C43H47N6O8 [M]+ 775.3450, found 775.3473.
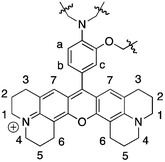
12 was obtained as a purple solid after lyophilisation with ∼16% yield. 1H-NMR (300 MHz, CDCl3): δ 7.73 (d, J = 7.9 Hz, 2H, CH PTSA), 7.71 (H triazol) 7.02–6.83 (m, 7H, 2CH PTSA, Ha, Hb, Hc, 2H7), 5.45 (s, 2H, CH2COOMe), 5.33 (s, 2H, OCH2), 4.21 (s, 4H, NCH2), 3.72 (s, 3H, OMe), 3.70 (s, 6H, 2 OMe), 3.57–3.51 (m, 8H, H1, H4), 3.02 (t, J = 6.1 Hz, 4H, H6), 2.77–2.71 (m, 4H, H3), 2.26 (s, 3H, Me PTSA), 2.13–2.08 (m, 4H, H5), 2.02–2.00 (m, 4H, H2). 13C-NMR (75 MHz, CDCl3): δ 171.55 (CO esters), 167.27 (CO ester), 154.00 (C Ar), 152.21 (C Ar), 151.07 (C Ar), 148.62 (C Ar), 144.52 (C Ar), 141.05 (C Ar), 138.23 (C Ar), 134.55 (CH triazol), 133.20 (C Ar), 128.16 (CH PTSA), 126.73 (C7), 126.16 (CH PTSA), 126.05 (C Ar), 124.12 (CH Ar), 123.77 (C Ar), 118.76 (CH Ar), 116.13 (CH Ar), 112.84 (C Ar), 105.30 (C Ar), 59.91 (OCH2), 53.51 (NCH2), 52.94 (OMe), 52.04 (2 OMe), 50.99 (C1 or C4), 50.47 (C1 or C4), 49.72 (CH2COOMe), 27.64 (C3), 21.29 (Me PTSA), 20.71 (C2), 19.96 (C6), 19.79 (C2). MS (ES+), calcd for C43H47N6O8 [M]+ 775.3450, found 775.7. HRMS (ES+), calcd for C43H47N6O8 [M]+ 775.3450, found 775.3495.
4.4 Saponification: typical procedure
7 was obtained as a purple solid after lyophilisation with ∼74% yield. HRMS (ES+), calcd for C38H38N3O6 [M]+ 632.2755, found 632.2761.
10 was obtained as a purple solid after lyophilisation with ∼81% yield. HRMS (ES+), calcd for C40H41N6O8 [M]+ 733.2980, found 733.3002.
4.5 Dextran conjugates
Dextran 6000 MW (Sigma-Aldrich, ref: 31388) and dextran 1500 MW (Sigma-Aldrich, ref: 31394) were functionalised with 14 (ref. 29) (see ESI†) using a method described by Nielsen et al.30 The 1H-NMR showed that the functionalised dextrans were alkylated once per glucose unit.Final MW dextran 6000–14![[thin space (1/6-em)]](https://www.rsc.org/images/entities/char_2009.gif) 500 g mol−1.
500 g mol−1.
Final MW dextran 1500–3600 g mol−1.
Acknowledgements
This work was supported by the French Agence National de la Recherche (ANR P3N, nanoFRET2 grant, to J.M.M.)Notes and references
- R. M. Paredes, J. C. Etzler, L. T. Watts, W. Zheng and J. D. Lechleiter, Methods, 2008, 46, 143 CrossRef CAS PubMed.
- A. E. Palmer, ACS Chem. Biol., 2009, 4, 157 CrossRef CAS PubMed.
- G. Grynkiewicz, M. Poenie and R. Y. Tsien, J. Biol. Chem., 1985, 260, 3440 CAS.
- J. P. Kao, A. T. Harootunian and R. Y. Tsien, J. Biol. Chem., 1989, 264, 8179 CAS.
- D. Thomas, S. C. Tovey, T. J. Collins, M. D. Bootman, M. J. Berridge and P. Lipp, Cell Calcium, 2000, 28, 213 CrossRef CAS PubMed.
- M. Bannwarth, I. R. Corrêa, M. Sztretye, S. Pouvreau, C. Feally, A. Aebischer, L. Royer, E. Rios and K. Johnsson, ACS Chem. Biol., 2009, 4, 179 CrossRef CAS PubMed.
- T. Egawa, K. Hanaoka, Y. Koide, S. Ujita, N. Takahashi, Y. Ikegaya, N. Matsuki, T. Terai, T. Ueno, T. Komatsu and T. Nagano, J. Am. Chem. Soc., 2011, 133, 14157 CrossRef CAS PubMed.
- M. Oheim, M. van 't Hoff, A. Feltz, A. Zamaleeva, J.-M. Mallet and M. Collot, Biochim. Biophys. Acta, Mol. Cell Res., 2014, 843, 2284 CrossRef PubMed.
- M. Collot, C. Loukou, A. V. Yakovlev, C. D. Wilms, D. Li, A. Evrard, A. Zamaleeva, L. Bourdieu, J.-F. Leger, N. Ropert, J. Eilers, M. Oheim, A. Feltz and J.-M. Mallet, J. Am. Chem. Soc., 2012, 134, 14923 CrossRef CAS PubMed.
- L. A. Levy, E. Murphy, B. Raju and R. E. London, Biochemistry, 1988, 27, 4041 CrossRef CAS.
- H. J. Kim, J. H. Han, M. K. Kim, C. S. Lim, H. M. Kim and B. R. Cho, Angew. Chem., Int. Ed., 2010, 49, 6786 CrossRef CAS PubMed.
- (a) E. Arunkumar, A. Ajayaghosh and J. Daub, J. Am. Chem. Soc., 2005, 127, 3156–3164 CrossRef CAS PubMed; (b) P. Ashokkumar, V. T. Ramakrishnan and P. Ramamurthy, Eur. J. Org. Chem., 2009, 34, 5941 CrossRef.
- E. Lallana, R. Riguera and E. Fernandez-Megia, Angew. Chem., Int. Ed., 2011, 50, 8794 CrossRef CAS PubMed.
- J. P. Byrne, J. A. Kitchen and T. Gunnlaugsson, Chem. Soc. Rev., 2014, 43, 5302 RSC.
- M. Juríček, P. H. J. Kouwer and A. E. Rowan, Chem. Commun., 2011, 47, 8740 RSC.
- D. Kushwaha, R. S. Singh and V. K. Tiwari, Tetrahedron Lett., 2014, 55, 4532 CrossRef CAS PubMed.
- J. A. Christensen and J. T. Fletcher, Tetrahedron Lett., 2014, 55, 4612 CrossRef CAS PubMed.
- M. Vedamalai and S.-P. Wu, Eur. J. Org. Chem., 2012, 6, 1158 CrossRef.
- W.-J. Shi, J.-Y. Liu and D. K. P. Ng, Chem.–Asian J., 2012, 7, 196 CrossRef CAS PubMed.
- B. C. Boren, S. Narayan, L. K. Rasmussen, L. Zhang, H. Zhao, Z. Lin, G. Jia and V. V. Fokin, J. Am. Chem. Soc., 2008, 130, 8923 CrossRef CAS PubMed.
- F. Song, S. Watanabe, P. E. Floreancig and K. Koide, J. Am. Chem. Soc., 2008, 130, 16460 CrossRef CAS PubMed.
- S. Zhang, J. Geng, W. Yang and X. Zhang, RSC Adv., 2014, 4, 12596 RSC.
- P. Jiang and Z. Guo, Coord. Chem. Rev., 2004, 248, 205 CrossRef CAS PubMed.
- See section
![[left double angle bracket]](https://www.rsc.org/images/entities/char_27ea.gif) Dextran conjugates
Dextran conjugates ![[right double angle bracket]](https://www.rsc.org/images/entities/char_27eb.gif) at http://www.lifetechnologies.com.
at http://www.lifetechnologies.com. - (a) W. Ansorge and R. Pepperkok, J. Biochem. Biophys. Methods, 1988, 16, 283 CrossRef CAS; (b) R. Pepperkok, M. Zanetti, R. King, D. Delia, W. Ansorge, L. Philipson and C. Schneider, Proc. Natl. Acad. Sci. U. S. A., 1988, 85, 6748 CrossRef CAS; (c) D. J. Fishkind, L. G. Cao and Y. L. Wang, J. Cell Biol., 1991, 114, 967 CrossRef CAS.
- M. Collot, A. Lasoroski, A. I. Zamaleeva, A. Feltz, R. Vuilleumier and J.-M. Mallet, Tetrahedron, 2013, 69, 10482 CrossRef CAS PubMed.
- J. Berlin and M. Konishi, Biophys. J., 1993, 65, 1632 CrossRef CAS.
- C. Buon, L. Chacun-Lefèvre, R. Rabot, P. Bouyssou and G. Coudert, Tetrahedron, 2000, 56, 605 CrossRef CAS.
- D. C. Knapp, J. D'Onofrio and J. W. Engels, Bioconjugate Chem., 2010, 21, 1043 CrossRef CAS PubMed.
- T. T. Nielsen, V. Wintgens, C. Amiel, R. Wimmer and K. L. Larsen, Biomacromolecules, 2010, 11, 1710 CrossRef CAS PubMed.
Footnote |
| † Electronic supplementary information (ESI) available: Experimental data: details of the organic synthesis of probes (HPLC, NMR, mass spectra) and measurements of their photophysical properties are available. See DOI: 10.1039/c4ra12858c |
| This journal is © The Royal Society of Chemistry 2015 |

