Modulating the photo-exciting process of photosensitizer to improve in vitro phototoxicity by preparing its self-assembly nanostructures†
Lin Zhou,
Xuefeng Ge,
Jiahong Zhou*,
Shaohua Wei* and
Jian Shen
College of Chemistry and Materials Science, Analysis and Testing Centre, Jiangsu Key Laboratory of Biofunctional Materials, Jiangsu Collaborative Innovation Centre of Biomedical Functional Materials, Key Laboratory of Applied Photochemistry, Nanjing Normal University, Wenyuan Road No. 1, 210023, Nanjing, China. E-mail: zhoujiahong@njnu.edu.cn; shwei@njnu.edu.cn; Fax: +86-25-85898170; Tel: +86-25-85898170
First published on 4th December 2014
Abstract
A series of hypocrellin A (HA) self-assembled nanostructures were prepared by controlling the charge properties of drugs and the ion strength of the environment. Comparative studies with nanostructures and HA have demonstrated that the self-assembled effect on the HA molecule significantly enhances its water dispersion ability, 1O2 generation efficiency and, thereby, the in vitro phototoxicity to human cervical carcinoma (HeLa) cells.
Introduction
Photodynamic therapy (PDT) is a light-activated treatment for cancer and other diseases.1 PDT utilizes photosensitizers (PSs) that can be preferentially localized in malignant tissues. Its therapeutic effect is activated by photo-excitation of the localized PSs to generate cytotoxic reactive oxygen species (ROSs), e.g., 1O2, free radicals, or peroxides, which leads to irreversible destruction of diseased tissues.2The major drawback for commonly used PSs are hydrophobic, which makes their stable formulation for systemic administration highly challenging. To overcome this difficulty, different strategies have evolved to enable a stable dispersion of these drugs into aqueous systems, often using nano-scale surfactants micelle or delivery vehicles.3 Upon systemic administration, such drug-doped carriers are preferentially taken up by tumor tissues by virtue of the “enhanced permeability and retention effect” for nano-sized drug formulation.4
As an alternative method to deliver the hydrophobic drugs, they can be nanolized by irregular precipitation or regular self-assembly ways, without the addition of any external agents, such as surfactants micelle or carrier vehicles, which can reduce the risk of systemic toxicity or side-effect, such as opsonization and acute hypersensibility (anaphylactic) reactions from carriers or surfactants themselves.5 Furthermore, self-assembly organic drugs into well-defined nanostructures depending on various noncovalent interactions, including π–π interaction, van der Waals, hydrogen bonding, hydrophilic/hydrophobic, electrostatic, metal ligand coordination, ion-pair effect and et al.,6 may affect their physical and chemical property and,7 therefore, improving or changing their activity comparing with their corresponding monomers.6f So, there is increasing interest in the research of novel drugs regular self-assembly method to prepare nano-sized formulation to improve their dispersion ability in aqueous system and the efficacy of the medicine.5,8
As we known that ionic strength can affect the solubility of some molecules because when the salt concentration is changed, some of the water molecules are attracted or repulsed by salt ions. Such interaction decreased or increased the number of water molecules available to interact with the charged part of the molecules. Because of the increased or decreased demand for solvent molecules, the balance of molecule–molecule interaction and the solvent–solute interaction would break, which induce molecules aggregation or disperse.9 Therefore, we proposed that by appropriate regulating the environment ionic strength and the charge of organic drugs, hydrophobic drugs can be nanolized by regular self-assembly ways. Though the ionic strength induced self-assemble or precipitation has been well studied in the field of biomacromolecules, including protein or DNA, there is little report of using this technique for organic drugs, especially for PSs, delivery. Furthermore, we speculated that well-defined PSs nanostructures depending on various noncovalent interaction modes and mechanisms might affect their photo-exciting process and modulate their photophysical and photochemical property by such certain intermolecular interaction to increase the 1O2 generation efficacy and, therefore, improve anti-cancer activity comparing with the PSs monomer.
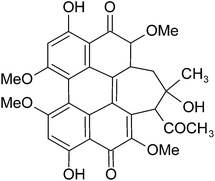
To demonstrate this concept, we prepared HA self-assembly nanostructures by regulating its charge property and the ionic strength of environment. HA (Scheme 1), isolated from the fungus of Hypocrella bambusae, is recognized as a promising non-porphyrin PSs for PDT applications, because of its high singlet oxygen 1O2 quantum yields, rapid metabolism in vivo and high photodynamic killing activity toward many kinds of tumor cell lines, viruses, and bacteria.1b,10 HA can be negative charged at alkaline pH because it transferred to deprotonated species and the charging degree was varied due to its different deprotonating level. Furthermore, HA has the π conjugated structure, which can form π–π stacking interaction with each other. In addition, there are hydroxyl and carbonyl groups on the edge of HA molecule; such groups can form hydrogen bond between the adjacent molecules. Our researches indicated that the result HA self-assembly nanostructures can stable disperse in aqueous system for a long time. Moreover, the self-assembly mechanism, shape and size of these HA self-assembly nanostructures are obviously affected by their charge property and ion strength of environment during their self-assembly process. Most importantly, such regular self-assembly process can affect photo-exciting process of HA by modulate its intersystem crossing (ISC) efficiency to enhance the 1O2 generation ability and, therefore improve in vitro phototoxicity to HeLa cells.
Experimental section
Materials
9,10-Anthracenedipropionic acid was from Sigma. Hoechst 33342 and thiazolyl blue (MTT) were from AMOSCO. Dulbecco's modified eagle media (DMEM) and fetal bovine serum (FBS) were from GIBCO. All other chemicals were of analytical grade. 2′,7′-Dichlorofluorescin diacetate (DCFH-DA) kit and trypan blue staining kit were purchased from Beyotime.Preparation of self-assembly HA molecules
In a typical experiment, 25 μL 0.5 M of aqueous solution of NaCl was dissolved in 10 mL double distilled water by continuous stirring to form solution A1, A2, A3 and A4, and their pH values of A1, A2 and A3 were adjusted to 7.5, 8.0 and 8.5 using ammonium hydroxide (25–28%), separately. In 40 mL water, 200 μL HA (15 mM in dimethyl sulfoxide, DMSO) were dissolved by continuous stirring. Then, the solution was divided into 4 groups to form solution B1, B2, B3 and B4, and their pH values of B1, B2, and B3 were adjusted to 7.5, 8.0 and 8.5 using ammonium hydroxide, separately. The pH value of A4 and B4 remained at 7.0. Then, solution A (A1, A2, A3 or A4) was slowly added to solution B (B1, B2, B3 or B4) at the rate of 2 mL min−1 with continuous stirring at room temperature, accordingly. The result samples were then dialyzed against water in a 12–14 kDa cut-off cellulose membrane overnight to remove NaCl and DMSO to get pure HA-nano-1, HA-nano-2, HA-nano-3 and HA-nano-4 for further experimentation. The control experiment used HA aqueous solution, which has been prepared by dissolving same amount of HA (15 mM) in water using trace DMSO as latent solvent.Characteristics
Ultra violet-visible (UV-vis) absorbance spectra were recorded with a VARIAN CARY 50 spectrophotometer. Fluorescence spectra were recorded on a Cary Eclipse fluorometer. Fluorescence lifetime was obtained using a Horiba Jobin Yvon FM-4P-TCSPC system. Fluorescence inside cells was monitored by a Nikon Ti Fluorescence microscope. Circular dichroism (CD) measurements were taken with an Applied Photophysics Chriascan circular dichroism spectrometer in a 1 cm quartz cell at 20 °C. The surface charge of samples was measured with Malvern Zetasizer Nano 90 measurements in aqueous system. Transmission electron microscope (TEM) images were investigated on HITACH H-7650 with 120 kV accelerating voltage.Photo-bleaching assay
The light stability of HA and HA self-assembly nanostructures by measuring their photo-bleaching properties was studied in aqueous solution by irradiating using a 470 nm light emitting diode (LED). In addition, absorbance of the solutions after irradiation was recorded after irradiating for 15 min.1O2 detection by ADPA
1O2 was detected using 9,10-anthracenedipropionic acid disodium salt (ADPA) as sensor.4 ADPA can be oxidized by 1O2 to its corresponding endoperoxide (ADPAO2). The reaction was monitored spectrophotometrically by measuring the decrease in absorbance intensity of ADPA at 378 nm (λmax of ADPA). Typically, 150 μL ADPA (5.5 mM) was mixed with 3 mL of HA or HA–HA self-assembly nanostructures and the solutions were irradiated by 470 nm LED, and the absorbance of the solutions after irradiation were recorded at 378 nm every 2 min, separately.HA self-assembly nanostructures uptake in vitro
HeLa cells were trypsinized and resuspended in a DMEM medium with 10% FBS at the concentration of 1 × 10⁵ cells per mL and seeded in a 6-well culture plate (1 mL in each well), following the established protocol.4,11 Then, cells were placed in an incubator (37 °C, 5% CO2) until 50% cells were confluent. Then, cells were rinsed with phosphate-buffered saline (PBS), and 1 mL of fresh serum-free medium, containing HA or HA self-assembly nanostructures, was replaced on the each plate and mixed gently; the final drug concentration were all 5 μM. The treated cells were re-incubated in incubator for another 4 h and then, the cells were rinsed with sterile PBS for 3 times and directly imaged using a Nikon Ti fluorescence microscope.Intracellular ROSs detection by DCFH-DA
Intracellular generation of reactive oxygen species was measured by using an oxidation-sensitive fluorescent probe, DCFH-DA, whose oxidized form (2′,7′-dichlofluorescein, DCF) is highly fluorescent.12 HeLa cells, with the density of 1 × 10⁵ cells per mL, were seeded in 6-well plates. After incubation with HA or HA self-assembly nanostructures (5 μM) for 4 h, cells were treated with 10 μM DCFH-DA for 30 min. The control experiment used cells incubated in serum free DMEM and DCFH-DA without drugs. Then, cells were washed three times with sterile PBS and then exposed to 470 nm light for 120 s. Immediately after light exposure, cell images were acquired using an inverted fluorescence microscope. The fluorescence intensity inside cells were measured by fluorometer (Ex = 480 nm, Em = 525 nm).Cytotoxicity study
For studying the in vitro photodynamic activity of HA and HA self-assembly nanostructures, HeLa cells at the initial concentration of 5 × 10⁵ cells per mL were cultured on 96-cell culture plates in incubator for 24 h. Then, the old medium was replaced by fresh medium (without FBS) with HA self-assembly nanostructures or HA, separately. Following 4 h incubation, the culture medium was replaced by FBS free fresh medium after being rinsed three times by PBS to remove adhered drugs. The cells were immediately exposed to light and incubated in incubator for 24 h. Dead/live cell staining assay was conducted using trypan blue excluding experiment. For detecting the PDT induced chromatin condensation change, after treatment with drugs overnight and irradiated by light, cells were washed with PBS three times and treated with 25 μg mL−1 of Hoechst 33342 at 37 °C in incubator for 30 min. Morphology change of nuclear was observed under a fluorescence microscope. For detecting the different irradiation doses and drug concentrations on cell toxicity, cells viability was estimated using the MTT assay.13Statistical analysis
Student's t test was used to analyze the differences in photo-toxicity and mitochondrial membrane potential assay following treatment with free or HA nano-cluster. Experimental results are given as means ± S of the indicated number of experiments. P < 0.05 was considered necessary for statistical significance.Results and discussion
Shape, size and zeta potential
The solubility of HA in water at neutral pH is very poor; however, the solubility of HA can be greatly improved in aqueous solution at alkaline condition because in this case, most of the HA molecules are present as deprotonated species with increased negative charge.14 In our experiment alkaline pH condition (pH = 7.5, 8.0 and 8.5), HA molecules were partly deprotonated and negative charged. Zeta potential of HA was gradually decreased from −3.20 to −45.25, −53.95 and −60.26 mV when pH values of aqueous solution were adjusted from 7.0 to 7.5, 8.0 and 8.5 using ammonium hydroxide. When NaCl was added, some of the water molecules are attracted by the salt ions, which decreases the number of water molecules available to interact with the charged part of HA molecules. As a result of the increased demand for solvent molecules, the HA–HA interactions are stronger than the solvent–solute interactions; HA molecules assembled driving by the intermolecular interactions, such as π–π stacking, hydrogen bond or hydrophobic interaction,6i with each other and forming HA self-assembly nanostructures (Scheme 2).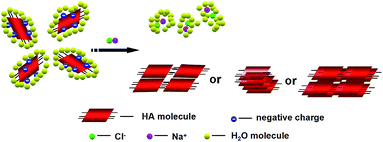 | ||
| Scheme 2 Schematic representation of the HA nanostructures formation by controlling the charge of drug and ion strength of environment. | ||
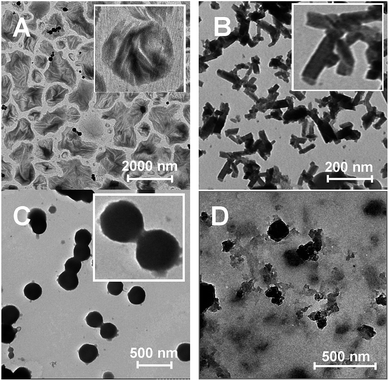
Fig. 1 indicated that the shape and size of HA self-assemble nanostructures were very different at same ion strength (I = 1.25 × 10⁻⁶) but different assemble pH condition. When reaction pH value was 7.5, HA molecules were self-assembly to cabbage leaves-like sheet structure. When pH value was increased to 8.0, HA molecules were self-assembly to rectangle sheet. When pH value was increased to 8.5, HA molecules were self-assembly to nanosphere. In contrast, if the reaction pH value was 7.0, HA molecules cannot effetely deprotonate and, therefore, cannot effectively assemble to the nanostructure with regular shape and size. Above results indicated that both ion strength of environment and charge of drug are all key factors during the self-assemble process of HA molecules. And such factors would affect the HA–HA intermolecular interaction mode and intensity during the self-assemble process. The shape and size of these self-assembly structures are quite different, which indicated that HA possibly have different self-assembly mechanisms in different experiment conditions.
Self-assembly mechanism analysis
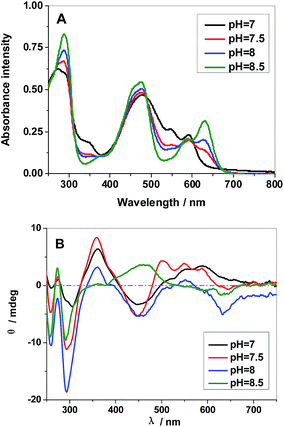
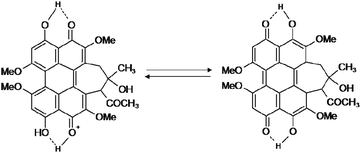
It's well know that molecule space structure and the charge property are very important for self-assembly process.15 The shape and size of HA nanostructures, prepared at same ion strength but different pH condition, are quite different, which indicate that the molecule space structure or charge property of HA would be different at these pH condition. There are phenolic hydroxyl groups in the structure of HA. Previous reports indicated that the phenolic hydroxyl groups participate in the formation of intramolecular H-bonding and that intramolecular proton transfer was responsible for the coexistence and equilibrium of two tautomeric structures in solution (Fig. S1†). Therefore, pH will influence molecule space structure because it inducing the dissociations of these phenolic hydroxyl groups and equilibrium of two tautomeric structures. The differences of the UV-vis absorption and CD spectra of HA in aqueous solution are shown in Fig. 2 with the pH value from 7.0 to 8.5. The absorption spectra (Fig. 2A) of HA (pH = 7) shows four main bands centered at 212 (peak I), 480 (peak II), 546 (peak III) and 591 nm (peak IV). When the pH increases from 7.0 to 8.5, the spectra pattern was drastically changed. Peak II was diminished and a new peak at 629 nm appears, with five isobestic points at 265, 308, 416, 489 and 598 nm, which possibly because that the HA (YH2) was partly transferred to monoanionic form (YH−).16 More convenience evidence for structure changes at different pH value was from CD spectra. The CD property is mainly due to the inherently dissymmetrical chromophore of the perylenequinone ring. As showed in Fig. 2B, there are six cotton of HA in aqueous solution at pH 7. With the pH value decreasing, the position and intensity of these peaks was greatly changed. Furthermore, some cottons, including cotton II, IV and VI, diminish and a new one, cotton VII, appears. More interestingly, the negative cotton V transfer to a positive cotton when pH was increased to 8.5 (Table 1).| pH | Cotton peak position (nm) | ||||||
|---|---|---|---|---|---|---|---|
| I | II | III | IV | V | VI | VII | |
| 7.0 | −259 | +275 | −308 | +361 | −447 | +552, +559 | — |
| 7.5 | −258 | +272 | −296 | +358 | −446 | +502, +549, +587 | −644 |
| 8.0 | −258 | — | −293 | +360 | −449 | +551 | −633 |
| 8.5 | −255 | +274 | −290 | — | +464 | — | −629 |
These changes are possibly due to the fact that the dissociations of henolic hydroxyls prevent tautomerization of HA and destroy the tautomeric equilibrium (Scheme 3). Above results indicated that the molecule space structure of HA are obviously changed at different pH condition. The self-organization process is accompanied by drastic changes in the absorption spectra arising from intermolecular interactions between neighboring units within the supramolecular species. This is illustrated in Fig. S1† by means of UV/vis absorption and CD spectra during self-assembly process.
Zeta potential of HA was persistently decreased when pH values of aqueous solution were decreased from 7.0 to 8.5. However, zeta potential of self-assembly HA-nano-3 was increased comparing with HA-nano-2 (Fig. 3). So, based on UV-vis, CD spectra and zeta potential results, we speculated that these nanostructures possibly have different self-assembly modes and mechanisms.
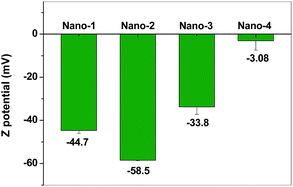 | ||
| Fig. 3 Zeta potential of HA and HA self-assemble nanostructures in aqueous solution at there reaction pH ([Drug] = 5 μM). | ||
Based on TEM, UV-vis, CD and zeta potential results, we proposed that when the ion strength was 1.25 × 10⁻⁶ and pH value was 8.5, HA molecules possibly were mainly assembled through the face to face mode mainly driving by π–π stacking interaction between their perylene nucleus. So the shape of HA-nano-3 was nanosphere. On the contrary, when the ion strength was 1.25 × 10⁻⁶ and pH value was 7.5, HA molecules were mainly assembled through the head to tail mode mainly through the intermolecular hydrogen bond between their phenolic hydroxyl and quinone carbonyl group to form sheet structure. And there are π–π stacking interaction between the two adjacent sheets. So, the shape of HA-nano-1 and HA-nano-2 was nanosheet (Scheme 4).
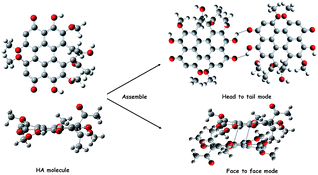 | ||
| Scheme 4 Schematic representation of different process of HA-nano-1, HA-nano-2 and HA-nano-3 from HA molecules. | ||
Direct comparisons of the photochemical stability of free HA and HA self-assembly nanostructures were studied by exposing the samples continuously for a span of time using 470 nm LED.3b,17 Fig. 4 showed the HA photobleaching percent as a function of the irradiation time. Under the same experimental conditions, photobleaching efficiencies of HA-nano-1, HA-nano-2, HA-nano-3, HA-nano-4 and free HA are 3.59%, 4.54%, 6.81%, 6.57% and 8.69%, respectively, which illustrate that HA self-assembly nanostructures have stronger photo-stability than free HA due to the protection effect by the cluster structure, suggesting HA nanoclusters are more suitable to be studied in PDT than HA. It is interesting that the light stability of HA-nano-1 and HA-nano-2 was superior to that of HA-nano-3. It is common knowledge that the film-like structure (HA-nano-1 and HA-nano-2) was thin, and light can penetrate it much easier than the nutty structure (HA-nano-3), but contrary results were obtained. Many reports indicated that the light stability of HA would improve when there are structure modification or intermolecular interaction at the position of its phenolic hydroxyl group or quinone carbonyl.18 Such results further improved that they have different self-assembly mechanism and such assembly mode affect the photobleaching degree of HA molecules.
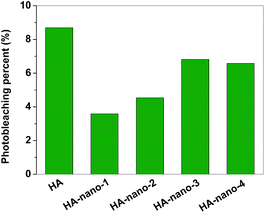 | ||
| Fig. 4 Photobleaching percents comparison of HA, HA-nano-1, HA-nano-2, HA-nano-3 and HA-nano-4 ([Drug] = 5 μM). | ||
Storage stability
The storage stability of intravenous drug in aqueous solution is a very important index because such well-dispersed drug would not caused problems including sedimentation, aggregation and flocculation during the storage or delivery process in blood.3a So, the differences of storage stability between HA and HA self-assembly nanostructures were studied. As shown in Fig. 5, after preserving them for three days, ∼70% of HA was sediment but only ∼10% of self-assembly nanostructures were detected, which indicated that HA self-assembly nanostructures have excellent stability in the aqueous solution (details in ESI, Fig. S3†).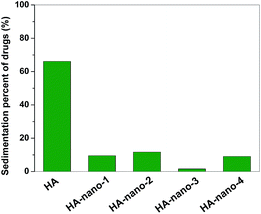 | ||
| Fig. 5 Storage stability comparing of HA and HA self-assembly nanostructures in aqueous solution by determine their sedimentation percents ([Drug] = 5 μM). | ||
1O2 generation
1O2 is generally considered to play the important role in PDT process because it is extremely electrophilic and can oxidize directly electron-rich double bonds in biomolecules and macromolecules; and it is believed to be the main cytotoxic agent related with PDT.19 Irradiation with light elevates the electrons of ground state of PS (0PS) to a higher energy level (S1, 1PS*). 1PS* can translate to the long-lived triplet state of PS (T1, 3PS*) through the ISC, and also can relax back to the ground state via the emission of fluorescence. 1O2 (S1) produced through the reaction between 3PS* and surrounding molecular oxygen (T0). Population of the 3PS* occurs as a result of ISC from the photo-excited 1PS*, so the efficiency of generated 1O2 is depended on the population of 3PS* to some degree.20,21We confirmed the 1O2 generation using ADPA as a detector. ADPA reacts irreversibly with 1O2 to form its endoperoxide ADPAO2, which causes a decrease in the intensity at ∼378 nm (λmax of ADPA).4 Such decrease can response to the generation of 1O2 because of the following processes, eqn (1)–(4), were hypothetically taken place:
| HA + Hv → HA*, Iabs | (1) |
| HA* + 3O2 → HA + 1O2, k | (2) |
| ADPA + 1O2 → ADPAO2, kc | (3) |
| 1O2 → 3O2, kd | (4) |
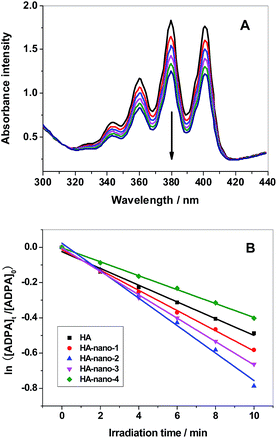
Fig. 6A showed the decrease in absorption intensity at ∼378 nm, of HA (the detection results of HA-nano-1, HA-nano-2 HA-nano-3 and HA-nano-4 were showed in Fig. S2†), as a function of the exposure time under 470 nm LED irradiation. In the case of water containing only ADPA, there was also no change in the absorption value at ∼378 nm under the same irradiation conditions, indicating the decrease in absorption in the presence of PSs was caused by the generated singlet oxygen and not by the irradiation itself. According to eqn (1)–(4), a rough estimation of the rate constant for the chemical quenching of ADPA by 1O2 can be obtained using a simplification in which [1O2] is independent of [ADPA]. The loss of ADPA in reaction with 1O2 is given by eqn (5)–(7)20,22
| −d[ADPA]/dt = kc[ADPA][1O2] = k[ADPA] | (5) |
| k = kc[1O2] |
Thus, the decay of [ADPA] follows first order kinetics.
[ADPA]t = [ADPA]0![[thin space (1/6-em)]](https://www.rsc.org/images/entities/char_2009.gif) exp(−kt) exp(−kt)
| (6) |
| ln([ADPA]t/[ADPA]0) = −kt | (7) |
The value of ln([ADPA]t/[ADPA]0) show linear relationships with the irradiation time (t) in the mixed aqueous solvent of PSs and ADPA (Fig. 6B). The exact reaction rate constants (k) with ADPA for HA, HA-nano-1, HA-nano-2 HA-nano-3 and HA-nano-4 in our experiment are listed in Table 2. The 1O2 generation ability of free HA was obviously weaker than HA-nano-1, HA-nano-2 HA-nano-3 but higher than that HA-nano-4, which indicated that regular assembly is essential for 1O2 generation ability improving. Furthermore, the 1O2 generation ability of HA-nano-2 was higher than that of HA-nano-1 and HA-nano-3, which is possibly because that their different self-assembly mode and mechanisms can affect the HA–HA interaction, then affect the photophysical property and, correspondingly, affect the 1O2 generation ability. To prove above hypothesis, the exciting process of HA and HA self-assembly nanostructures was analyzed by fluorescence spectra and time-resolved fluorescence measurements.
| k | Standard error | Adj. R-square | |
|---|---|---|---|
| HA | 4.752 × 10⁻² | 0.213 × 10⁻² | 0.990 |
| HA-nano-1 | 5.741 × 10⁻² | 0.141 × 10⁻² | 0.997 |
| HA-nano-2 | 7.795 × 10⁻² | 0.291 × 10⁻² | 0.993 |
| HA-nano-3 | 6.637 × 10⁻² | 0.120 × 10⁻² | 0.998 |
| HA-nano-4 | 3.949 × 10⁻² | 0.072 × 10⁻² | 0.998 |
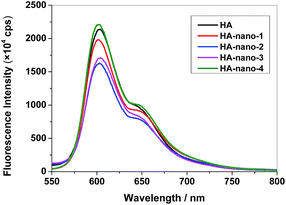
In PDT process, 1O2 formation and fluorescence are competing processes, the loss of fluorescence at low pH may indicate more 1O2 formation in many cases. To study the exciting process, the fluorescence spectra and time-resolved fluorescence measurements of HA, HA-nano-1, HA-nano-2, HA-nano-3 and HA-nano-4 were carried out in aqueous solution. The fluorescence property of PSs solution can be affected by many reasons, including PSs solvent interaction, self-aggregation of PSs, microenvironment around PSs and photo-exciting process of PSs. In HA solutions, the fluorescence of HA will be quenched and this absence of fluorescence of HA can be due to either HA–water interaction promoting nonradiative decay or concentration quenching derived from self-aggregation of HA molecules. But in the case of HA self-assembly nanostructures, the inner HA molecules can be envisaged as discretely embedded in the hydrophobic nanostructures matrix, and therefore partly protected from exposure to the aqueous environment, possibly increasing the fluorescence intensity. As showed in Fig. 7, the fluorescence spectra of HA, HA-nano-1, HA-nano-2, HA-nano-3 and HA-nano-4, with the same amount of HA, exhibited typical HA fluorescence peaking at about 600 nm. The fluorescence intensity of HA was lower than that of HA-nano-4 but obviously higher than that of HA-nano-1, HA-nano-2 and HA-nano-3. And HA-nano-2 have the lowest fluorescence intensity among all of the self-assembly nanostructures. HA molecules are all self-aggregate in above self-assembly nanostructures and all dispersed in water. They have similar PSs solvent interaction and microenvironment around PSs. So, the different effects on the fluorescence changing are possibly because of their different photo-exciting process of HA molecules due to their different self-assembly modes and mechanisms.
To further confirm this hypothesis, time-resolved fluorescence experiments were conducted. Time-resolved fluorescence measurements examine fluorescence decay profiles and can provide evidence of interrelated processes such as electron transition, energy transfer and ISC process of PSs. A 450 nm nano-LED was used to excite HA. The data were fitted using a reconvolution method of the instrument response function producing X2 fitting values of 1–1.40. Time-resolved fluorescence lifetime decay curve of HA and HA self-assembly nanostructures are showed in Fig. S4† and lifetime and analytic data are summarized in Table 3. HA gives a bi-exponential decay in aqueous solution using trace of DMSO as latent solvent. The formula mentioned to relate the total steady state fluorescence intensity and the fluorescence decay lifetime as followed eqn (8) and (9); the average lifetimes of these drugs in the global analysis fittings are calculated, according to Neves–Petersen as eqn (10):
 | (8) |
 | (9) |
 | (10) |
| τ1 (ns) | f1 (%) | τ2 (ns) | f2 (%) | τaverage (ns) | |
|---|---|---|---|---|---|
| HA | 0.873 | 44.09 | 1.877 | 55.91 | 1.245 |
| HA-nano-1 | 0.656 | 29.27 | 1.665 | 70.25 | 1.142 |
| HA-nano-2 | 0.359 | 20.04 | 1.551 | 79.96 | 0.966 |
| HA-nano-3 | 0.555 | 26.86 | 1.641 | 73.14 | 1.076 |
| HA-nano-4 | 0.855 | 41.98 | 1.779 | 58.02 | 1.224 |
As shown in Table 3, the fluorescence evolution of pure HA can be fitted by a biexponential function, which indicates two decay components. The fast lifetime was 1.877 ns (55.91%) and the slow one was 0.873 ns (44.09%). the τ1, τ2, and average lifetime of HA-nano-4 (irregular assemble) was similar with HA. So, according to the Jablonski diagram for the PDT process and fluorescence intensity affection reasons, we can conclude that the increased fluorescence intensity of HA-nano-4 comparing with HA was possibly because of the protection effect from the exterior HA molecules to the inner one. In contrast, the values of τ1, τ2, and average lifetime of HA-nano-1, HA-nano-2 and HA-nano-3 were all decreased comparing with HA. Moreover, HA-nano-2 have the shortest lifetime among all of the self-assembly nanostructures. According to the Jablonski diagram for the PDT process, after form these nanostructures through the regular self-assembly, the fluorescence intensity of HA was not increased when the lifetime was decreased, which indicated that such regular self-assembly can affect the photophysical and photochemical property and, correspondingly, increase in the probability of the ISC. In this case, with an increase in population of the 3HA*, an increase in 1O2 sensitization may also occur, which can well explain the reason of their increased 1O2 ability.
Above researches indicated that HA-nano-2 has the lowest fluorescence intensity and shortest lifetime, which indicated that HA-nano-2 have the most efficient ISC efficacy comparing with other nanostructures.24 So, HA-nano-2 has the highest 1O2 generation ability, and therefore, the best photodynamic activity. There are severe reasons for this superior activity. Firstly, head to tail assemble (HA-nano-1) is based on intermolecular hydrogen bond. Face to face assemble (HA-nano-3) is based on the π–π stacking interaction, which is more stable than intermolecular hydrogen bond. Secondly, many reports indicated that aggregate mode would affect the photophysical effect and photodynamic effect of photosensitizers. Comparing with face to face aggregation formulation, the head to tail aggregation would increase photodynamic effect ability because head to tail aggregation can increase dipole moment, which is helpful to improve their photodynamic activity.25 HA-nano-2 has two assemble modes, combing with head to tail and face to face modes. Applying both modes can not only make the two modes complement each other, but also obtain more efficient photodynamic activity. Thirdly, the size of photosensitizer-based nanoparticles is important for their PDT efficacy because the lifetime of 1O2 in aqueous media is in the μs regime, during which interval it can diffuse over a mean radial distances of at least 100 nm, using
In vitro studies with tumor cells: drug uptake, ROSs generation, and in vitro phototoxicity to HeLa cells assay
The cellular uptake of the HA-nano-1, HA-nano-2, HA-nano-3, HA-nano-4 and free HA was determined using fluorescent microscopy. As seen in Fig. 8, HA-nano-1 (A1), HA-nano-2 (B1), HA-nano-3 (C1), HA-nano-4 (D1) and free HA (E1) were all taken up by tumor cells. Besides, the similarity of the distribution patterns obtained for fluorescence from these drugs.Intracellular ROSs generation was further evaluated in vitro within cells using DCFH-DA assay.12 The HeLa cells treated with HA-nano-1 (Fig. 8A2), HA-nano-2 (Fig. 8B2), HA-nano-3 (Fig. 8C2), HA-nano-4 (Fig. 8D2) and free HA (Fig. 8E2) all exhibited stronger fluorescence signal inside the cells. Furthermore, microscope fluorescence images overlay results (Fig. 8A3, B3, C3, D3 and E3) and in situ fluorescence intensity analysis (Fig. 8A4, B4, C4, D4 and E4) indicating that the effect ROSs generation place is exactly the position of drug location, which indicated that the effective ROSs generation inside the cells triggered by these drugs and irradiation. The strong ROSs generation capabilities indicated that they are promising candidate with high light toxicity to cancer cells in vitro.
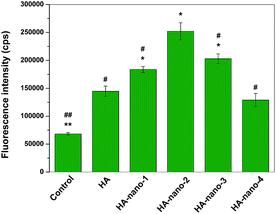
Further, the amount of in vitro ROSs generation of HA, HA-nano-1, HA-nano-2, HA-nano-3 and HA-nano-4 were quantified by determining the fluorescence intensity of DCF green fluorescence from light irradiated drugs treated cells and the control cells (cells were exposed to light without drugs) for fluorescence intensity.3b ROSs signal can be detected in the control cells because of their intracellular oxygen metabolites. As shown in Fig. 9, after irradiated by 470 nm LED, the fluorescence intensity at about 520 nm (λmax of DCF) of HA-nano-1, HA-nano-2 or HA-nano-3 treated cell was obvious stronger than that in free HA and HA-nano-4 treated cells and HA-nano-2 have the highest DCF signal intensity. Above results indicated that the in vitro ROSs generation ability of regular self-assembly nanostructure of HA was obviously stronger than free HA and the irregular assembly one and similar as 1O2 detection results, HA-nano-2 have the highest in vitro ROSs generation ability among the entire regular self-assembly nanostructures. On the contrary, there was no obvious difference for in vitro ROSs generation ability between HA-nano-4 and free HA, which prove that the regular self-assembly of HA is a key factor to improve its ROSs generation ability and such ability can also be affected by assembly modes and mechanisms.
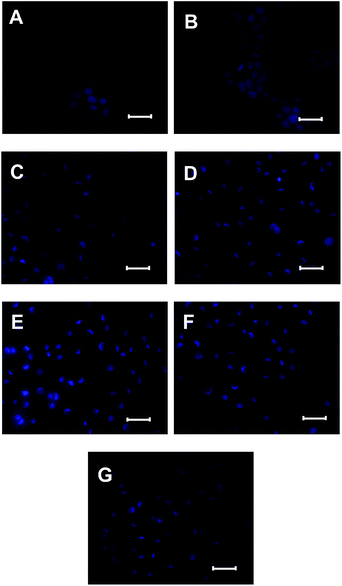
First of all, cells were stained with Hoechst 33342 to identify the photo-induced chromatin damage.20,26 The chromatin fluorescence of the normal cells and the cells treated with light but without drugs stained dimly and occupied the majority nucleus of the cell. In contrast, the cells treated with HA or HA nanostructures (5 μM) and irradiation (120 s) showed obvious morphology changes, including chromatin condensation, shrinkage, and fragmentation (Fig. 10).
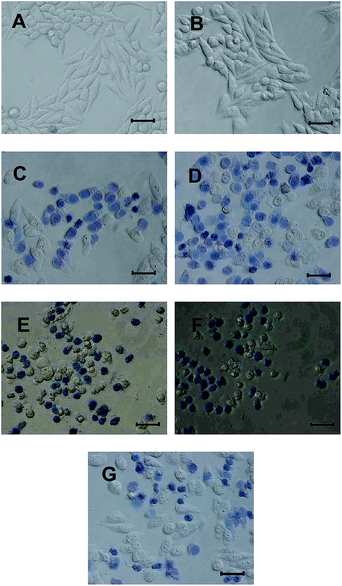
The viability of HA nanostructures and free HA treated cells was verified by their morphology. And the dead/live cell staining assay was conducted using trypan blue excluding experiment, which allows for a direct identification of live (unstained) and dead (blue) cells because trypan blue molecule is cell membrane impermeable and therefore only enters cells with compromised membranes.27 Fig. 11 showed that there were almost no cells morphology changing after irradiation by 470 nm LED for 120 s but without drugs. On the contrary, drug and light co-treated cells showed drastic changes in the morphology. The cells shrunk and the surface roughen. In addition, cells were stained with trypan blue to identify the dead and live cells. The results showed that the control cells were not stained, which indicated that they are in good condition. Many drug and light co-treated cells showed obvious trypan blue stained, which indicated that these cells were dead. The ROSs generated by these drugs apparently induced these changes.
Cytotoxicity assay indicated that, before irradiation, HA self-assembly nanostructures and free HA all showed low dark toxicity (Fig. 12A); however, after irradiation, significant cell death can be observed for all samples. The in vitro results indicated a direct relationship between the drug concentration or light dose and the light induced cell toxicity. The results showed that after irradiation, HA and HA nanostructures can cause significant cell death, and such photodynamic activity is dependent on both drug dose (Fig. 12B) and light dose (Fig. 12C). Except from increasing drug concentration, prolonging light irradiation time also can improve their photodynamic anti-cancer activity, which can reduce dosage to decrease side effect. The anti-cancer activity of free HA was obviously weaker than HA-nano-1, HA-nano-2, HA-nano-3 but higher than that HA-nano-4. In addition, HA-nano-2 have superior activity to other regular self-assembly nanostructures (Fig. 12D), which was similar as 1O2 generation and in vitro ROSs detection results. Above data indicated that HA-nano-1, HA-nano-2 and HA-nano-3 have superior photodynamic anti-cancer activity to free HA and can be exploited as its effective drug-delivery formation.
Conclusion
In this manuscript, a group of HA regular self-assembled nanostructures was prepare by a feasible method through controlling the charge property of drug and ion strength of environment. The self-assembled mechanism and mode can be easily regulated because the charge and structure of HA are very different at vary pH value but same ion strength. The self-assembled structures can stable dispersed in aqueous solution for a long time. Interestingly, the self-assembly process can modulate the photophysical and photochemical property of HA by increasing the efficiency of ISC, and finally, obviously increase the 1O2 generation efficacy. The PDT process of HA-nano-1, HA-nano-2 and HA-nano-3 can induce 65.5%, 79.02% and 71.59% cell death, separately, which were obviously higher than that of free HA (4 h incubation, 2.5 μM and 120 s irradiation). These results have illustrated the potential of using regular self-assembled nanostructures for PDT. This approach eliminates the need of any external agents such as surfactants or other carriers for drug delivery. Potentially this method of drug formulation can be applied not only for PDT drugs but also for delivery of other therapeutic drugs, such as chemotherapeutics and imaging agents. However, we only studied the photochemical property and in vitro phototoxicity ability of our HA nanostructures. Animal experiments need be carried out in the future because in vivo activity demonstration, such as distribution and tumor accumulation, is very important to evaluate their application potential.Acknowledgements
This research was supported by the National Natural Science Foundation of China (21201102). The Natural Science Foundation of Jiangsu Higher Education Institutions of China (no. 13KJA150003 and 12KJB150015). The project BK20131394 and BZ201210 supported by NSF of Jiangsu Province of China. The Priority Academic Program Development of Jiangsu Higher Education Institutions (PAPD). The Scientific Research Foundation of Nanjing Normal University (no. 2011103XG0249). The Open Project Program of State Key Laboratory of school of physics and technology.Notes and references
- (a) P. Huang, J. Lin, X. S. Wang, Z. Wang, C. L. Zhang, M. He, K. Wang, F. Chen, Z. M. Li, G. X. Shen, D. X. Cui and X. Y. Chen, Adv. Mater., 2012, 24, 5104 CrossRef CAS PubMed; (b) Y. Sun, Y. J. Hou, Q. X. Zhou, J. R. Chen, B. W. Zhang and X. S. Wang, J. Inorg. Biochem., 2011, 105, 978 CrossRef CAS PubMed; (c) X. H. Dai, Z. M. Wang, Y. F. Huang, J. M. Pan, Y. S. Yan, D. M. Liu and L. Sun, RSC Adv., 2014, 4, 42486 RSC.
- (a) S. Kim, T. Y. Ohulchanskyy, H. E. Pudavar, R. K. Pandey and P. N. Prasad, J. Am. Chem. Soc., 2007, 129, 2669 CrossRef CAS PubMed; (b) C. L. Du, J. Zhao, J. B. Fei, L. Gao, W. Cui, Y. Yang and J. B. Li, Chem.–Asian J., 2013, 8, 736 CrossRef CAS PubMed.
- (a) L. Zhou, W. Wang, J. Tang, J. H. Zhou, H. J. Jiang and J. Shen, Chem.–Eur. J., 2011, 17, 12084 CrossRef CAS PubMed; (b) L. Zhou, J. H. Liu, J. Zhang, S. H. Wei, Y. Y. Feng, J. H. Zhou, B. Y. Yu and J. Shen, Int. J. Pharm., 2010, 386, 131 CrossRef CAS PubMed; (c) H. J. Yoon and W. D. Jang, J. Mater. Chem., 2010, 20, 211 RSC; (d) D. Bechet, P. Couleaud, C. Frochot, M. L. Viriot, F. Guillemin and M. Barberi-Heyob, Trends Biotechnol., 2008, 26, 612 CrossRef CAS PubMed; (e) M. P. Romero, N. R. S. Gobo, K. T. de Oliveira, Y. Iamamoto, O. A. Serra and S. R. W. Louro, J. Photochem. Photobiol., C, 2013, 253, 22 CrossRef CAS PubMed.
- I. Roy, T. Y. Ohulchanskyy, H. E. Pudavar, E. J. Bergey, A. R. Oseroff, J. Morgan, T. J. Dougherty and P. N. Prasad, J. Am. Chem. Soc., 2003, 125, 7860 CrossRef CAS PubMed.
- K. Baba, H. E. Pudavar, I. Roy, T. Y. Ohulchanskyy, Y. H. Chen, R. K. Pandey and P. N. Prasad, Mol. Pharmaceutics, 2007, 4, 289 CrossRef CAS PubMed.
- (a) M. L. Bushey, T. Q. Nguyen, W. Zhang, D. Horoszewski and C. Nuckolls, Angew. Chem., Int. Ed., 2004, 43, 5446 CrossRef CAS PubMed; (b) G. Charron, T. Stuchinskaya, D. R. Edwards, D. A. Russell and T. Nann, J. Phys. Chem. C, 2012, 116, 9334 CrossRef CAS; (c) T. H. Rehm and C. Schmuck, Chem. Soc. Rev., 2010, 39, 3597 RSC; (d) S. Y. Vasilchenko, A. I. Volkova, A. V. Ryabova, V. B. Loschenov, V. I. Konov, A. A. Mamedov, S. G. Kuzmin and E. A. Lukyanets, J. Biophotonics, 2010, 3, 336 CrossRef CAS PubMed; (e) J. Della Rocca, D. M. Liu and W. B. Lin, Acc. Chem. Res., 2011, 44, 957 CrossRef CAS PubMed; (f) Y. N. Gao, X. M. Zhang, C. Q. Ma, X. Y. Li and J. Z. Jiang, J. Am. Chem. Soc., 2008, 130, 17044 CrossRef CAS PubMed; (g) M. M. Pires and J. Chmielewski, J. Am. Chem. Soc., 2009, 131, 2706 CrossRef CAS PubMed; (h) P. L. Zhu, X. H. Yan, Y. Su, Y. Yang and J. B. Li, Chem.–Eur. J., 2010, 16, 3176 CrossRef CAS PubMed; (i) G. F. Lu, Y. L. Chen, Y. X. Zhang, M. Bao, Y. Z. Bian, X. Y. Li and J. Z. Jiang, J. Am. Chem. Soc., 2008, 130, 11623 CrossRef CAS PubMed.
- (a) S. S. Babu, S. Prasanthkumar and A. Ajayaghosh, Angew. Chem., Int. Ed., 2012, 51, 1766 CrossRef CAS PubMed; (b) E. C. Wu, S. G. Zhang and C. A. E. Hauser, Adv. Funct. Mater., 2012, 22, 456 CrossRef CAS.
- (a) P. Chithra, R. Varghese, K. P. Divya and A. Ajayaghosh, Chem.–Asian J., 2008, 3, 1365 CrossRef CAS PubMed; (b) X. Y. Gao and H. Matsui, Adv. Mater., 2005, 17, 2037 CrossRef CAS; (c) S. J. George and A. Ajayaghosh, Chem.–Eur. J., 2005, 11, 3217 CrossRef CAS PubMed; (d) H. B. Liu, J. L. Xu, Y. J. Li and Y. L. Li, Acc. Chem. Res., 2010, 43, 1496 CrossRef CAS PubMed; (e) S. Toksoz, H. Acar and M. O. Guler, Soft Matter, 2010, 6, 5839 RSC.
- D. T. Bowron and J. L. Finney, J. Chem. Phys., 2003, 118, 8357 CrossRef CAS PubMed.
- (a) L. Gao, J. B. Fei, J. Zhao, H. Li, Y. Cui and J. B. Li, ACS Nano, 2012, 6, 8030 CrossRef CAS PubMed; (b) L. Zhou, H. J. Jiang, S. H. Wei, X. F. Ge, J. H. Zhou and J. Shen, Carbon, 2012, 50, 5594 CrossRef CAS PubMed; (c) S. S. Qi, X. Lin, M. M. Zhang, S. Z. Yan, S. Q. Yu and S. L. Chen, RSC Adv., 2014, 4, 40085 RSC.
- H. Y. Zhang, X. L. Ma, C. B. Cao, M. N. Wang and Y. Q. Zhu, RSC Adv., 2014, 4, 41572 RSC.
- J. Cao, Y. Liu, L. Jia, H. M. Zhou, Y. Kong, G. Yang, L. P. Jiang, Q. J. Li and L. F. Zhong, Free Radical Biol. Med., 2007, 43, 968 CrossRef CAS PubMed.
- M. Mehrali, E. Moghaddam, S. F. S. Shirazi, S. Baradaran, S. T. Latibari, H. S. C. Metselaar, N. A. Kadri, K. Zandi and N. A. Abu Osman, ACS Appl. Mater. Interfaces, 2014, 6, 3947 CAS.
- P. K. Chowdhury, K. Das, A. Datta, W. Z. Liu, H. Y. Zhang and J. W. Petrich, J. Photochem. Photobiol., C, 2002, 154, 107 CrossRef CAS.
- T. S. Balaban, A. D. Bhise, M. Fischer, M. Linke-Schaetzel, C. Roussel and N. Vanthuyne, Angew. Chem., Int. Ed., 2003, 42, 2140 CrossRef CAS PubMed.
- Y. Y. He, J. Y. An and L. J. Jiang, pH Effect on the spectroscopic behavior and photoinduced generation of semiquinone anion radical of hypocrellin B, Dyes Pigm., 1999, 41, 79–87 CrossRef CAS.
- L. Zhou, J. H. Liu, F. Ma, S. H. Wei, Y. Y. Feng, J. H. Zhou, B. Y. Yu and J. A. Shen, Biomed. Microdevices, 2010, 12, 655 CrossRef CAS PubMed.
- (a) C. Yang, F. Ma, J. Tang, L. N. Han, S. H. Wei, L. Zhou, J. H. Zhou, J. Shen and F. Wang, Bioorg. Med. Chem. Lett., 2012, 22, 5003 CrossRef CAS PubMed; (b) F. Ma, H. Y. Huang, X. F. Ge, X. D. Yang, C. Yang, L. N. Han, J. H. Zhou and L. Zhou, Bioorg. Med. Chem. Lett., 2013, 23, 1689 CrossRef CAS PubMed.
- J. P. Tardivo, A. Del Giglio, C. S. de Oliveira, D. S. Gabrielli, H. C. Junqueira, D. B. Tada, D. Severino, R. D. F. Turchiello and M. S. Baptista, Photodiagn. Photodyn. Ther., 2005, 2, 175 CrossRef CAS.
- L. Zhou, S. H. Wei, X. F. Ge, J. H. Zhou, B. Y. Yu and J. Shen, J. Phys. Chem. B, 2012, 116, 12744 CrossRef CAS PubMed.
- L. Yan, Y. N. Chang, W. Y. Yin, G. Tian, L. J. Zhou, X. D. Liu, G. M. Xing, L. Zhao, Z. J. Gu and Y. L. Zhao, Biomater. Sci., 2014, 2, 1412–1418 RSC.
- (a) W. Tang, H. Xu, R. Kopelman and M. A. Philbert, Photochem. Photobiol., 2005, 81, 242 CrossRef CAS; (b) F. Yan and R. Kopelman, Photochem. Photobiol., 2003, 78, 587 CrossRef CAS.
- F. Ma, H. Y. Huang, L. Zhou, C. Yang, J. H. Zhou and Z. M. Liu, Spectrochim. Acta, Part A, 2012, 97, 1159 CrossRef CAS PubMed.
- S. Kim, T. Y. Ohulchanskyy, D. Bharali, Y. H. Chen, R. K. Pandey and P. N. Prasad, J. Phys. Chem. C, 2009, 113, 12641–12644 CAS.
- X. F. Zhang, Q. Xi and J. Zhao, J. Mater. Chem., 2010, 20, 6726–6733 RSC.
- H. Yan, X. Y. Pan, M. H. Chua, X. B. Wang, J. Song, Q. Ye, H. Zhou, A. T. Y. Xuan, Y. Liu and J. W. Xu, RSC Adv., 2014, 4, 10708 RSC.
- R. Bhowmick and A. W. Girotti, Cancer Lett., 2014, 343, 115 CrossRef CAS PubMed.
Footnote |
| † Electronic supplementary information (ESI) available. See DOI: 10.1039/c4ra12855a |
| This journal is © The Royal Society of Chemistry 2015 |

