
Fluorescence enhancement of fisetin by silver nanoparticles with cetyltrimethyl ammonium bromide micelles†
Xiaodan Liu and
Xia Wu*
Key Laboratory of Colloid and Interface Chemistry (Shandong University), Ministry of Education, School of Chemistry and Chemical Engineering, Shandong University, Jinan 250100, P. R. China. E-mail: wux@sdu.edu.cn; Fax: +86 53188564464; Tel: +86 53188365459
First published on 9th December 2014
Abstract
In this work, in situ synthesized cetyltrimethyl ammonium bromide micelles-capped silver nanoparticles were used to sensitively and directly detect fisetin. Fisetin molecules solubilize in the Stern layer of cetyltrimethyl ammonium bromide micelles and mainly bind to the head group of the micelles by electrostatic interaction and hydrophobic effect. Silver nanoparticles also solubilize in cetyltrimethyl ammonium bromide micelles and form the micelles-capped silver nanoparticles. The suitable distances between fisetin molecules and silver nanoparticles for the fluorescence enhancement are provided by the micelles. The synergistic action of the solubilization and sensitization of micelles and metal-enhanced fluorescence of silver nanoparticles promote the fluorescence enhancement of the system. Under optimized conditions, the fluorescence intensity of the system exhibits a linear response with the concentrations of fisetin in the range from 5.0 × 10⁻⁸ mol L−1 to 7.0 × 10⁻⁶ mol L−1 and the detection limit (S/N = 3) is 1.5 × 10⁻⁹ mol L−1. Compared to the other methods, the developed method has higher sensitivity. Moreover, the method has been successfully used to detect fisetin in actual samples.
Introduction
Silver nanoparticels (AgNPs) can enhance the fluorescence response of fluorophores, which are near the electromagnetic field of the metal nanoparticles' surface, and overcome the weak fluorescence of conventional fluorophores. The metal-enhanced fluorescence (MEF) of AgNPs has been widely used in fluorescent assays.1,2 Many studies show that the MEF of AgNPs is not only relevant to their size and morphology but also to the distance between the fluorophore and the metal surface.3,4 Lakowicz5 reported that a suitable distance between the fluorophore and the surface of AgNPs favored the occurrence of MEF. Nowadays, the suitable distance is usually adjusted by surface modification, hybrid and functionalization of AgNPs. Chen6 used oligomer to control the separation distance of adjacent AgNPs, and developed two types of aptamer-modified AgNPs hybrid probes for the ultrasensitive determination of IgE. Ma7 used poly(3-acrylamidephenylboronic acid-co-acrylic acid) to adjust the distance between the Ag core and porphyrin molecules and proposed a core–shell AgNPs-based method to detect glucose. In this work, we used cation micelles to obtain the suitable distance.Fisetin (3,3′,4′,7-tetrahydroxyflavone) (Scheme 1), one of the flavonols, is found in eudicotyledons, vegetables, fruits, herbs and drinks.8,9 Fisetin is a potent sirtuin-activating compound,10 an agent that modulates sirtuins and plays important roles in anti-aging, anti-inflammation, anti-prostate cancer treatments, inhibiting human melanoma,10–13 eutherapeutic treatments for pancreatitis and diabetes.14 Fisetin can also enhance the memory and may be good for treating memory disorders.15 Therefore, the investigation for the determination of fisetin is important for clinical medicine and pharmacology.16,17 To date, many methods were used to detect fisetin, including high performance liquid chromatography,18,19 capillary electrophoresis20 and electrochemistry.21,22 However, many methods have some disadvantages, such as being time-consuming and tedious. Therefore, there is still an urgent demand to develop an accurate, sensitive, simple, fast response and low-cost method for the determination of fisetin.
 | ||
| Scheme 1 The chemical structure of fisetin. | ||
In this work, in situ synthesized cetyltrimethyl ammonium bromide (CTAB) micelles capped-AgNPs were used for the sensitive and direct determination of fisetin. Herein, the suitable distances for MEF between fisetin molecules and the surface of AgNPs are provided by CTAB micelles. In addition, the interaction mechanism of the system is studied by resonance light scattering (RLS), fluorescence polarization, UV-vis spectrometry, transmission electronic microscopy (TEM), dynamic light scattering (DLS), Raman spectra and zeta potential.
Experimental
Chemicals
The solutions of fisetin, kaempferol (Kae), myricetin (Myr), apigenin (Api) and quercetin (Que), galangin (Gal), luteolin (Lut) and morin (Mor) were prepared, and all flavonoids were purchased from Aladdin. Silver nanoparticles (1.0 × 10⁻³ mol L−1) were synthesized using chemical reduction method as described in previous studies.23 In this method, AgNO3 (Sinopharm, China) was reduced by the trisodium citrate of 1% (Aladdin, Shanghai). Silver colloid was formed until the colour of the solution changed to pale yellow. The plasma resonance absorption peak of AgNPs is at 410 nm. The solution was stored in a refrigerator at 0–4 °C. Formic–NaOH buffer solution (pH = 5.2) was prepared by diluting 1.8 mL of formic in 250 mL deionized water and adjusted using 0.2 mol L−1 NaOH.All chemicals were of analytical reagent grade, and ultra-pure water was used throughout.
The strawberries were purchased from the local supermarket and crushed using a juice extractor, and the fresh juice was centrifuged. The supernatant liquid was obtained and used for subsequent experiments.
Apparatus
Fluorescence and resonance spectra were carried out on an F-7000 spectrofluorimeter (Hitachi, Japan) using a 1 cm quartz cuvette. Fluorescence polarization was taken on a LS-55 spectrofluorimeter (PerkinElmer, USA). The absorption spectra were recorded using a U-4100 spectrophotometer (Hitachi, Japan). The TEM images were taken on a JEM-1011 Transmission Electron Microscope (JEOL, Japan). The pH was measured with a Delta 320-S pH-meter (Mettler Toledo, China). Surface tension experiments were performed on an automatic tensiometer JYW-200B (Dahua, China). Dynamic light scattering experiments were carried out on a BI 200-SM (Brookhaven Instruments, USA). Raman spectra were monitored using a QE 65000 (Ocean Optics, USA). The zeta potential was tested in a Beckman Coulter Delsa Nano C zeta-potential and particle size analyzer (Beckman Coulter, USA).Procedure
| P = (IVV + GIVH)/(IVV + GIVH) |
Results and discussion
Fluorescence enhancement of fisetin by AgNPs and CTAB micelles
Fig. 1 shows the fluorescence spectra of the system. As seen from it, the fluorescence intensity of AgNPs–CTAB is the lowest. The fluorescence of fisetin is weak, and the corresponding excitation and emission maximum wavelengths are at 370 nm and 480 nm, respectively. After CTAB was added, the fluorescence intensity of fisetin significantly increased, and the emission peak shows a large red shift to 545 nm; the peak is attributed to the tautomer of fisetin that arises from the excited-state intramolecular proton transfer (ESIPT) reaction.24,25 Upon addition of AgNPs to the CTAB–fisetin system, the fluorescence intensity is further enhanced. The emission of the fisetin tautomer has resonance coupling with surface plasmon of CTAB micelles-capped AgNPs, leading to a larger fluorescence enhancement of the system. These results reveal that CTAB micelles and AgNPs have synergistic enhancement effect on the fluorescence intensity of fisetin.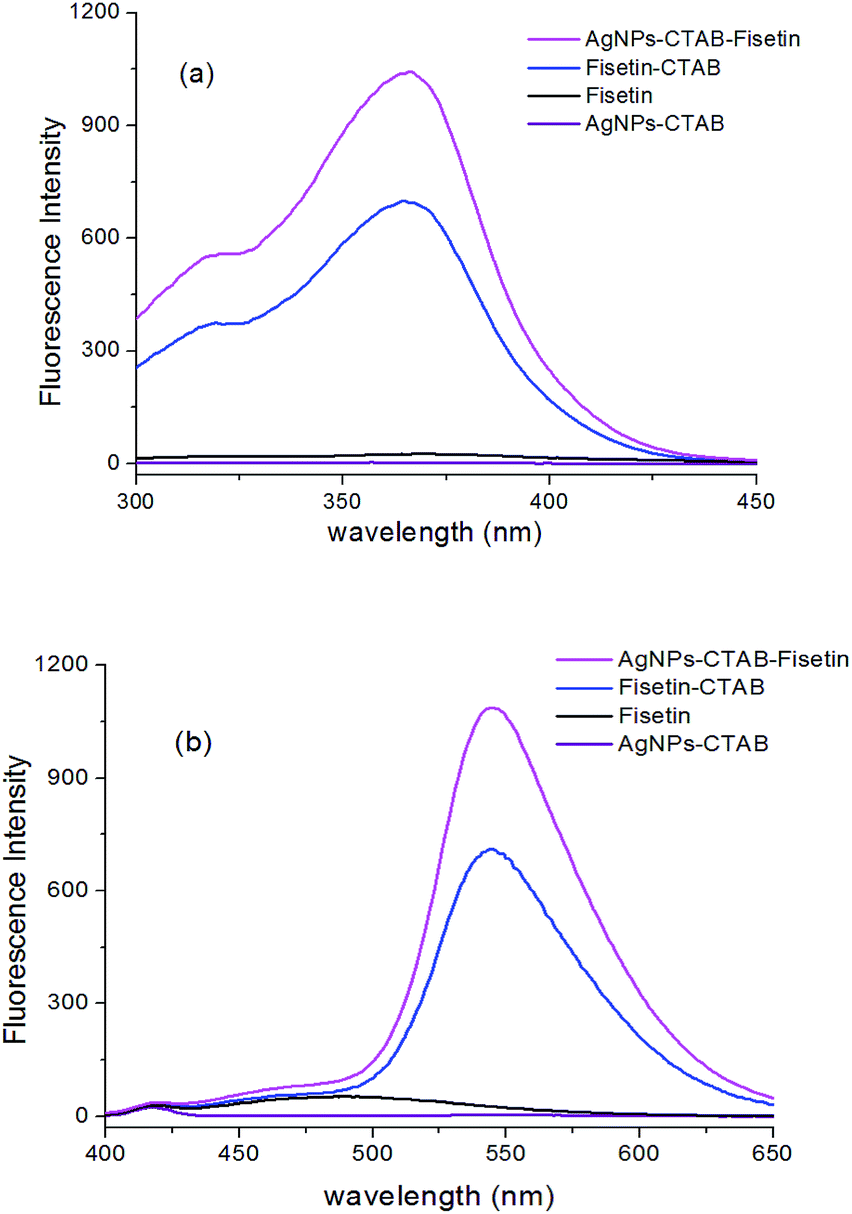 | ||
| Fig. 1 Fluorescence spectra (a) excitation spectra (λem = 545 nm) (b) emission spectra (λex = 365 nm). Conditions: CFisetin: 5.0 × 10⁻⁶ mol L−1, CCTAB: 5.0 × 10⁻⁴ mol L−1, CAgNPs: 4.0 × 10⁻⁶ mol L−1, formic–NaOH: 2.0 × 10⁻² mol L−1 (pH = 5.2). | ||
Effect of experimental variables
A plot of fluorescence intensity versus CTAB concentrations is performed (Fig. S3b, in the ESI†). When the concentration of CTAB is 5.0 × 10⁻⁴ mol L−1, the synergistic fluorescence enhancement effect of CTAB and AgNPs is the strongest.
A surface tension concentration curve of CTAB is measured (Fig. S3c, in the ESI†). The critical micelle concentrations (CMC) of CTAB in the systems of fisetin–CTAB, AgNPs–CTAB and AgNPs–CTAB–fisetin are 7.0 × 10⁻⁴ mol L−1, 3.1 × 10⁻⁴ mol L−1 and 3.3 × 10⁻⁴ mol L−1, respectively. The CMC of CTAB is 9.0 × 10⁻⁴ mol L−1 in water.27 We think AgNPs can promote the formation of the micelles at lower concentrations of CTAB. The CTAB concentration used in this work is 5.0 × 10⁻⁴ mol L−1, which is more than the CMC of this system. Here, CTAB forms micelles, and the micelles provide a hydrophobic environment for fisetin and reduce energy loss through collisions with other molecules. In addition, we think that AgNPs are capped by CTAB micelles, and a suitable distance between fisetin and AgNPs is obtained for the coupling effect of oscillating the dipole of the fluorescence of fisetin and the plasmon resonance of AgNPs; i.e., the synergistic action of the solubilization and sensitization of CTAB micelles and the MEF of AgNPs promote the fluorescence enhancement of the system.
The addition order and stability of system
The effect of the addition order on the fluorescence intensity was investigated. The result indicates that the best addition order of the reagents is formic–NaOH buffer solution, CTAB, fisetin and AgNPs. Under the optimized conditions, the fluorescence intensity reached a maximum after 20 min and remained stable for 2 h.Selective fluorescence response of fisetin
The effects of other flavonoids instead of fisetin on the fluorescence response were carried out (Fig. 2). The results show that fisetin, which is a 3,7-dihydroxy flavone, gives the strongest fluorescence response. Note that 5,7-dihydroxy flavones, Api and Lut, give the smallest fluorescence response, while the fluorescence responses of the 3,5,7-trihydroxy flavones, Mor, Kae, Myr, Que and Gal, are between those of 3,7-dihydroxy flavones and 5,7-dihydroxy flavones. This indicates that 3-hydroxyflavones are more efficient on excited-state intramolecular proton transfer than that of 5-hydroxyflavones in the system. From the previous studies we know that20 micellar electrokinetic capillary chromatography was used for the selectivity of the separation of flavonoids due to surfactant micelles providing both ionic and hydrophobic sites of interaction. This means that the interaction between the flavonoids and the surfactant micelles is closely related to the structures of two entities. In this study, the selective fluorescence response of flavonoids should be attributed to the different molecular structures of the flavonoids and the solubilization of flavonoids in CTAB micelles.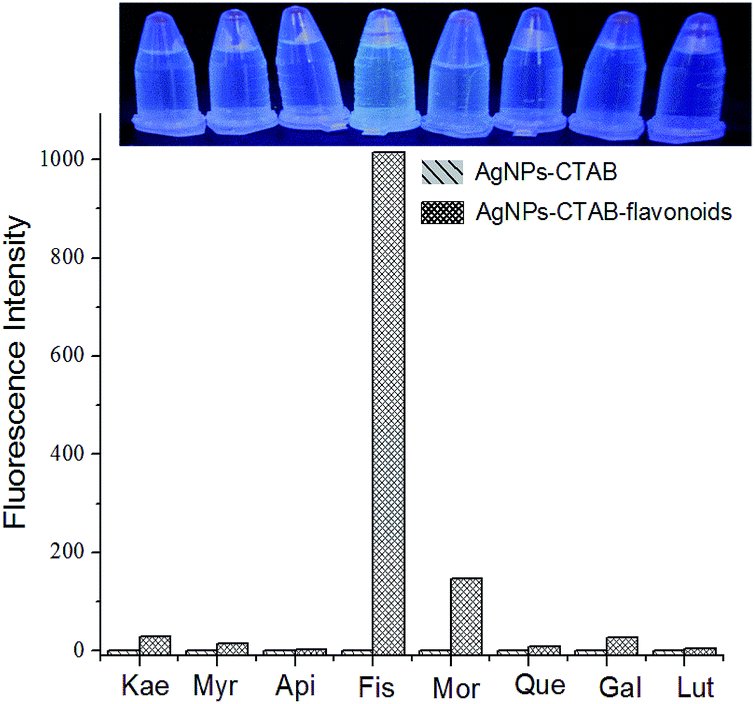 | ||
| Fig. 2 The fluorescence intensities of flavonoids. Conditions: CFlavonoids: 5.0 × 10⁻⁶ mol L−1, CCTAB: 5.0 × 10⁻⁴ mol L−1, CAgNPs: 4.0 × 10⁻⁶ mol L−1, formic–NaOH: 2.0 × 10⁻² mol L−1 (pH = 5.2). | ||
Interference of other flavonoids and some ions
The interferences of other flavonoids on the fluorescence of the system were tested. With 5.0 × 10⁻⁶ mol L−1 fisetin, the maximum permissible molar excesses of other flavonoids causing a ±5% relative error in the fluorescence intensity was as follows: 10-fold molar excesses of Kae, Myr, Api and Que, 5-fold molar excesses of Gal and Lut, and 2.5-fold molar excesses of Mor. The interferences of some potentially coexistent ions on the fluorescence intensity of the system were also performed (Table 1). Most of the metal ions tested had little effect on the fluorescence intensity of the system within ±5% relative error.| Foreign substances | Concentration coexisting (× 10−5 mol L−1) | Change of If (%) |
|---|---|---|
| a Conditions: CFisetin: 5.0 × 10⁻⁶ mol L−1, CCTAB: 5.0 × 10⁻⁴ mol L−1, CAgNPs: 4.0 × 10⁻⁶ mol L−1, formic–NaOH: 2.0 × 10⁻² mol L−1 (pH = 5.2). | ||
| Na+, CO32− | 2.5 | +3.6 |
| K+, Cl− | 2.5 | +3.2 |
| Ba2+, Cl− | 2.5 | +5.0 |
| Al3+, Cl− | 0.07 | +4.4 |
| Mg2+, Cl− | 2.5 | −3.4 |
| Cu2+, SO42− | 0.07 | −4.0 |
| Ca2+, Cl− | 2.5 | −2.9 |
| Zn2+, SO42− | 2.5 | +4.4 |
| Na+, Cl− | 2.5 | +4.8 |
| Zn2+, Cl− | 2.5 | −4.0 |
Analytical applications
Under the optimized conditions, a linear relationship (Fig. 3) was obtained between ΔIf and the concentrations of fisetin in the range from 5.0 × 10⁻⁸ mol L−1 to 7.0 × 10⁻⁶ mol L−1, with the correlation coefficient of 0.998. The linear equation is ΔIf = −7.37 + 2.66C (mol L−1). The detection limit is 1.5 × 10⁻⁹ mol L−1, according to the 3Sb/S criterion, where S is the slope for the range of the linearity and Sb is the standard deviation of the blank (n = 11). In comparison with other studies, the proposed method exhibits higher sensitivity (Table 2).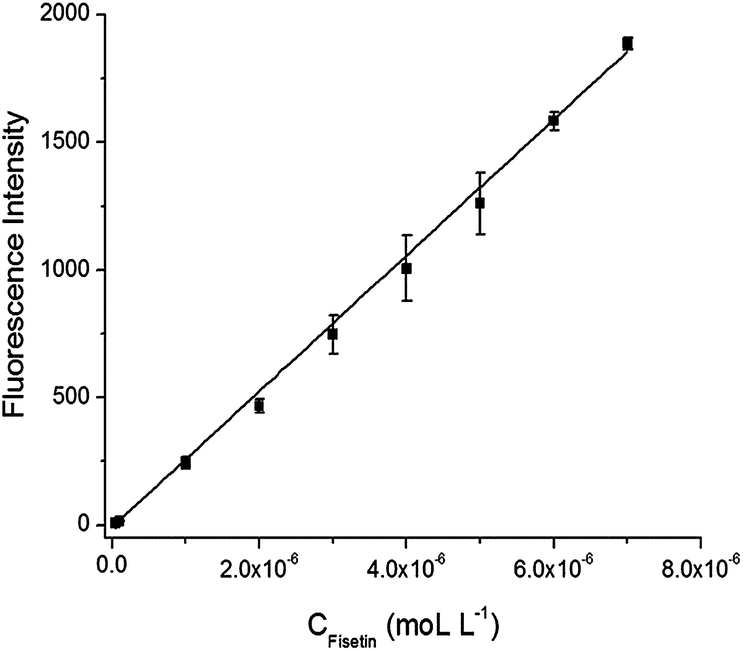 | ||
| Fig. 3 Calibration curve. Conditions: CAgNPs: 4.0 × 10⁻⁶ mol L−1, CCTAB: 5.0 × 10⁻⁴ mol L−1, formic–NaOH: 2.0 × 10⁻² mol L−1 (pH = 5.2). | ||
| Methods | Material | Linear range | LODa | References |
|---|---|---|---|---|
| a Limit of detection.b High-performance liquid chromatography.c Micellar electrokinetic capillary chromatography.d Sodium dodecyl sulfate.e Square-wave voltammetry.f 1-Butyl-3-methylimidazolium hexafluorophosphate.g [Ni2(HBPPAMFF)μ-(OAc)2(H2O)]BPh4. | ||||
| Fluorescence | DNA abasic site aptamer | 0.1–5.0 μM | 50 nM | 17 |
| HPLCb-UV-vis | 5.4–87 μM | 5.1 μM | 19 | |
| MEKCc | SDSd and β-cyclodextrin | 12–350 μM | 3.0 μM | 20 |
| SWVe | Au–fBMI.PF6 andgNiIINiII complex | 0.28–1.4 μM and 2.77–19.50 μM | 50 nM | 21 |
| Fluorescence | AgNPs–CTAB | 0.05–7.0 μM | 1.5 nM | This work |
Determination of fisetin in samples
The proposed method was used for the determination of fisetin in samples. The amount of total flavonoids of strawberry juice was measured using the standard addition method, the measurement of the average value (n = 5) is 2.9 × 10⁻⁵ mol L−1, and the relative deviation is 5.9%. The proposed method was also applied to detect fisetin in a synthesis sample (1![[thin space (1/6-em)]](https://www.rsc.org/images/entities/char_2009.gif) :10 mole ratio of fisetin to Myr in 1000 times diluted strawberry juice) containing a suitable volume of strawberry juice, 1.0 × 10⁻⁷ mol L−1 fisetin, and 1.0 × 10⁻⁶ mol L−1 Myr. The results were summarized in Table 3, and the found values are identical with the expected ones, and the recoveries are satisfactory. Hence, the proposed method is suitable for the determination of trace amounts of fisetin in strawberry juice.
:10 mole ratio of fisetin to Myr in 1000 times diluted strawberry juice) containing a suitable volume of strawberry juice, 1.0 × 10⁻⁷ mol L−1 fisetin, and 1.0 × 10⁻⁶ mol L−1 Myr. The results were summarized in Table 3, and the found values are identical with the expected ones, and the recoveries are satisfactory. Hence, the proposed method is suitable for the determination of trace amounts of fisetin in strawberry juice.
| No. | Samples (× 10−6 mol L−1) | Fisetin | Recovery (n = 5, %) | |
|---|---|---|---|---|
| Added (× 10−7 mol L−1) | Found ± SD (× 10−7 mol L−1) | |||
| 1 | Strawberry juice | 1.0 | 0.99 ± 0.032 | 99 |
| 2 | Strawberry juice + Myr (1.0) | 1.0 | 1.02 ± 0.022 | 102 |
Interaction mechanism investigations
Fig. 4 shows a comparison of resonance light scattering spectra. As seen from it, the RLS profile of fisetin–AgNPs is different from the others. The RLS peak appears at about 425 nm, which is attributed to fisetin directly binding with AgNPs. The RLS peak intensity of AgNPs–CTAB–fisetin is evidently higher than AgNPs–CTAB, but the shape and position of their peaks are similar. We speculate that fisetin combines with AgNPs coated by CTAB micelles.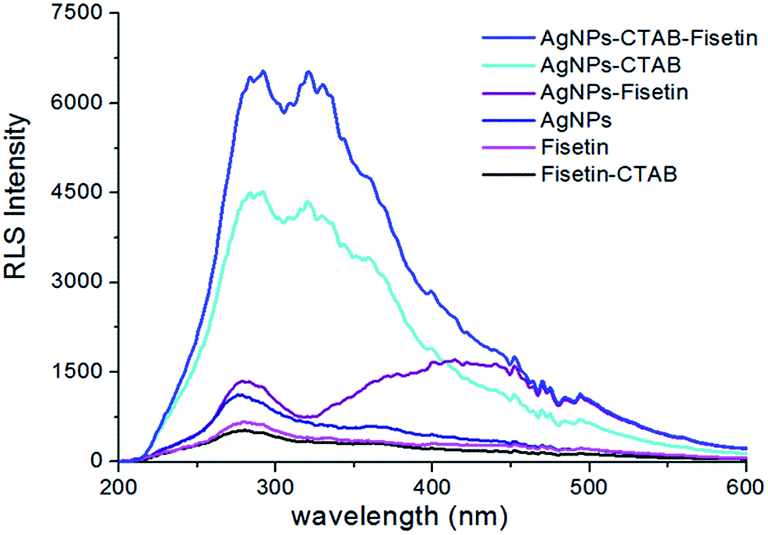 | ||
| Fig. 4 Resonance light scattering spectra. Conditions: CFisetin: 5.0 × 10⁻⁶ mol L−1, CCTAB: 5.0 × 10⁻⁴ mol L−1, CAgNPs: 4.0 × 10⁻⁶ mol L−1, formic–NaOH: 2.0 × 10⁻² mol L−1 (pH = 5.2). | ||
TEM images were used to verify CTAB micelles-capped AgNPs (Fig. 5). AgNPs are spherical shaped particles with an average diameter of 15 nm (Fig. 5a). Silver nanoparticles are dispersed in the CTAB micelles (Fig. 5b). After addition of fisetin, AgNPs distinctly aggregate, and the diameter is about 50 nm (Fig. 5c). However, when CTAB, AgNPs and fisetin coexist in the system, AgNPs disperse in CTAB micelles (Fig. 5d). The results confirm the formation of the micelles-capped AgNPs. We think that CTAB micelles provide the suitable distance between AgNPs and fisetin, leading to the fluorescence enhancement of AgNPs–CTAB–fisetin system.
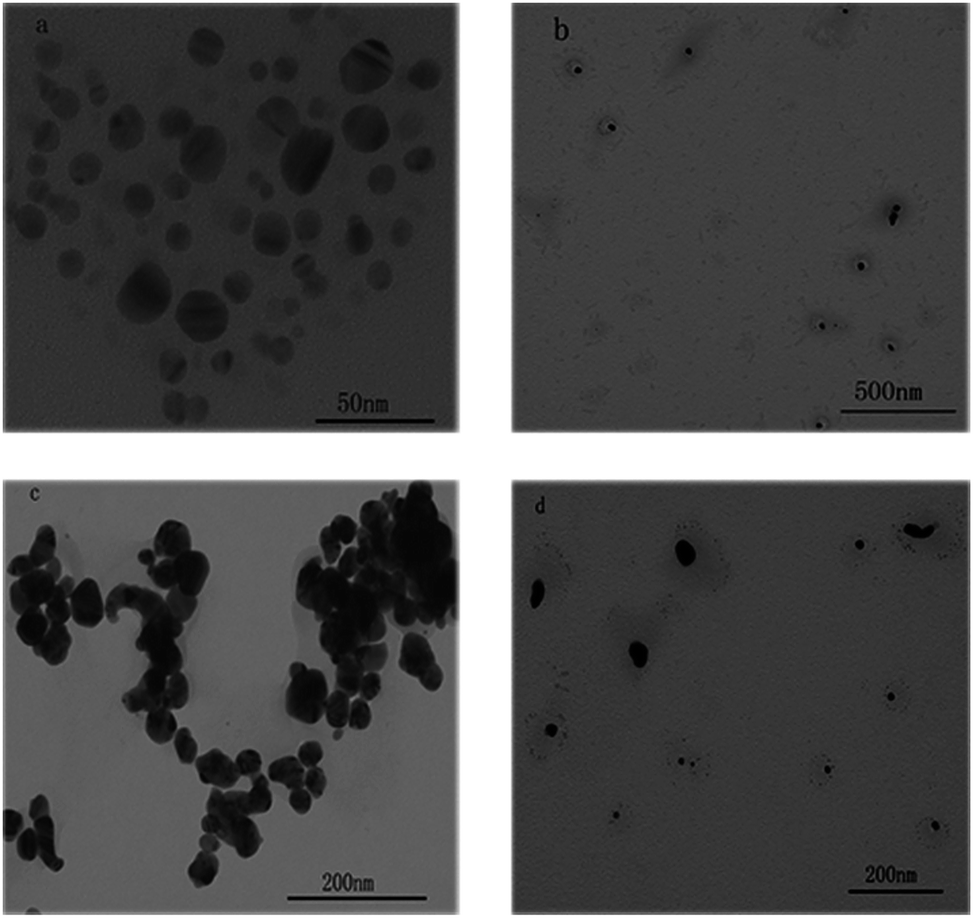 | ||
| Fig. 5 TEM images of the system (a) AgNPs, (b) AgNPs–CTAB, (c) AgNPs–fisetin, (d) AgNPs–CTAB–fisetin. Conditions: CFisetin: 1.3 × 10⁻⁴ mol L−1, CAgNPs: 1.0 × 10⁻⁴ mol L−1, CCTAB: 5.0 × 10⁻⁴ mol L−1. | ||
Dynamic light scattering (DLS) is an alternative method for monitoring particle size. Unlike TEM giving the number-average diameter, DLS exhibits a hydrodynamic diameter28 (Fig. S4, in the ESI†). DLS datum show that the average sizes of free AgNPs and AgNPs–CTAB are 74 nm and 92 nm, respectively. The increase in particle size proves that CTAB micelles coat on the surface of AgNPs, and AgNPs are well dispersed in CTAB micelles. AgNPs gather to 360 nm in the presence of fisetin because fisetin directly binds to AgNPs. The size distribution of AgNPs–CTAB–fisetin is from 6.66 nm to 203.2 nm. According to the size distribution of AgNPs–CTAB and AgNPs–CTAB–fisetin and TEM images (Fig. 5b and d), we find that CTAB micelles are preferred to coat smaller sized AgNPs. AgNPs that are approximately 10 nm may more effectively promote the fluorescence enhancement of the system.
Molecular rotational diffusion of the system was monitored by the fluorescence polarization (P). Under optimized conditions, the P values of CTAB–fisetin and AgNPs–CTAB–fisetin are 0.358 and 0.456, respectively. The result reveals that AgNPs can further hinder the rotational diffusion of fisetin in CTAB micelles, leading to the decrease of rotation velocity of AgNPs–CTAB–fisetin. This result further proves that fisetin combines with AgNPs coated by CTAB micelles.
Surface-enhanced Raman scattering (SERS) was experimented for further verifying the interaction among AgNPs, fisetin and CTAB (Fig. 6). Raman intensities of AgNPs–CTAB, fisetin and fisetin–CTAB are all weak. When fisetin binds to AgNPs, the SERS intensity of fisetin significantly increases. From the datum and according to previous studies,29,30 the band at 1596 cm−1 involves C–C stretching vibration of ring B, C2![[double bond, length as m-dash]](https://www.rsc.org/images/entities/char_e001.gif) C3 stretching vibration and bending vibration –OH. The band at 1505 cm−1 involves CO and C–C stretching vibration of ring B. The 1457 cm−1 band involves CO stretching vibration of ring A–C. The 1355 cm−1 band involves C–C stretching vibration of ring A, C–OH bending vibration of ring A (7-OH) and C–OH bending vibration of ring C (3-OH). The 1252 cm−1 band involves C–C stretching vibration of ring A and ring A–C. The 1207 cm−1 band involves stretching vibration peak of the CO of ring A–C and the C–OH bending vibration of ring A (7-OH). The 747 cm−1 band involves OC–C–C torsion vibration peak of the ring A and ring A–C. The 475 cm−1 band involves C–C–C bending vibration peak of ring A and ring A–C. According to the SERS selection rules,31 we consider that the –OH group in ring A and the CO group in ring C are close to the surface of silver nanoparticles. In contrast, the SERS spectrum of AgNPs–CTAB–fisetin has the 883 cm−1 band, which involves C–C deformation of ring A, B and C. Compared to AgNPs–fisetin, the Raman intensity of AgNPs–CTAB–fisetin is decreased and many vibration peaks disappear. We think that AgNPs solubilize in CTAB micelles and form the micelles-capped AgNPs, and the micelles hinder the direct interaction between AgNPs and fisetin. In consequence, we further clarify the above mentioned hypothesis that fisetin solubilizes in CTAB micelles and then combines with CTAB micelles-coated AgNPs.
C3 stretching vibration and bending vibration –OH. The band at 1505 cm−1 involves CO and C–C stretching vibration of ring B. The 1457 cm−1 band involves CO stretching vibration of ring A–C. The 1355 cm−1 band involves C–C stretching vibration of ring A, C–OH bending vibration of ring A (7-OH) and C–OH bending vibration of ring C (3-OH). The 1252 cm−1 band involves C–C stretching vibration of ring A and ring A–C. The 1207 cm−1 band involves stretching vibration peak of the CO of ring A–C and the C–OH bending vibration of ring A (7-OH). The 747 cm−1 band involves OC–C–C torsion vibration peak of the ring A and ring A–C. The 475 cm−1 band involves C–C–C bending vibration peak of ring A and ring A–C. According to the SERS selection rules,31 we consider that the –OH group in ring A and the CO group in ring C are close to the surface of silver nanoparticles. In contrast, the SERS spectrum of AgNPs–CTAB–fisetin has the 883 cm−1 band, which involves C–C deformation of ring A, B and C. Compared to AgNPs–fisetin, the Raman intensity of AgNPs–CTAB–fisetin is decreased and many vibration peaks disappear. We think that AgNPs solubilize in CTAB micelles and form the micelles-capped AgNPs, and the micelles hinder the direct interaction between AgNPs and fisetin. In consequence, we further clarify the above mentioned hypothesis that fisetin solubilizes in CTAB micelles and then combines with CTAB micelles-coated AgNPs.
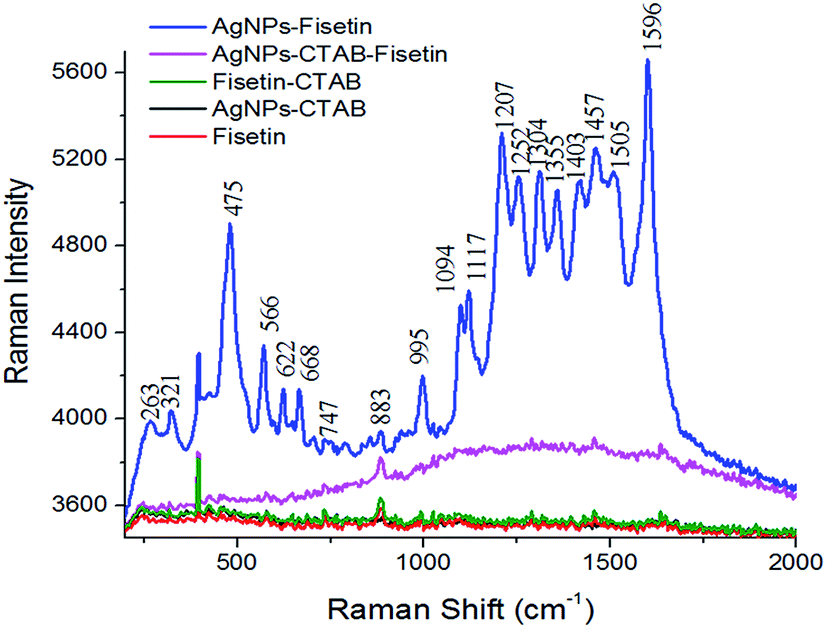 | ||
| Fig. 6 Raman spectra for the system. Conditions: CFisetin: 5.0 × 10⁻⁵ mol L−1, CCTAB: 5.0 × 10⁻⁴ mol L−1, CAgNPs: 4.0 × 10⁻⁵ mol L−1, formic–NaOH: 2.0 × 10⁻² mol L−1 (pH = 5.2). | ||
Fisetin exhibits two main absorption bands (Fig. 7); band I (about 357 nm) corresponds to the absorption of the cinnamoyl system (B and C ring), and band II (about 245 nm) corresponds to the absorption of the benzoyl system (A–C ring).32,33 As shown in Fig. 6, CTAB micelles can cause a red shift of the peak position of fisetin to 362 nm. The absorbance of two bands all decrease. Moreover, the absorption profile of AgNPs–fisetin is similar to fisetin but the intensity decreases. As for CTAB–fisetin, AgNPs can evidently increase its absorbance and exert almost no effect on its peak position. We believe that fisetin molecules solubilize in CTAB micelles and then combine with AgNPs in the AgNPs–CTAB–fisetin system.
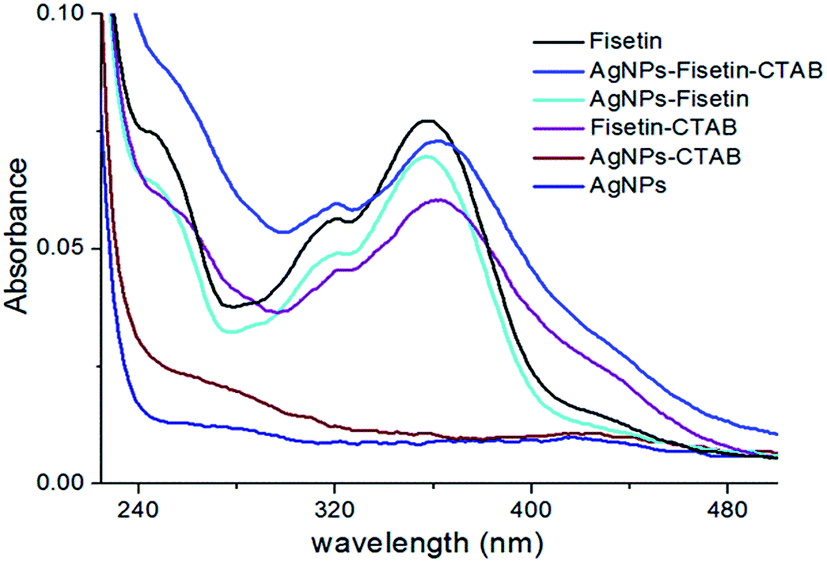 | ||
| Fig. 7 Absorption spectra of the system. Conditions: CFisetin: 5.0 × 10⁻⁶ mol L−1, CCTAB: 5.0 × 10⁻⁴ mol L−1, CAgNPs: 4.0 × 10⁻⁶ mol L−1, formic–NaOH: 2.0 × 10⁻² mol L−1 (pH = 5.2). | ||
The surface charges of nanoparticles were characterized by zeta potential. The zeta potentials of AgNPs, CTAB, AgNPs–CTAB, CTAB–fisetin and AgNPs–CTAB–fisetin were −23.23 mV, +83.76 mV, +64.45 mV, +53.96 mV and +40.95 mV, respectively. We infer that fisetin has anionic moiety and fisetin molecules solubilize in CTAB micelles with positive charges by electrostatic attraction and hydrophobic interaction. The CTAB micelles neutralize negative charges of AgNPs formation of the micelles-capped AgNPs. Based on fluorescence spectra and the above mentioned results, the possible mechanism of MEF of CTAB micelles-capped AgNPs is proposed as follows (Scheme 2): we believe that 7-hydroxyl deprotonation of fisetin can occur in the optimal conditions. Fisetin molecules solubilize in the Stern layer of CTAB micelles by electrostatic interaction and hydrophobic effect and then combine with CTAB micelles capped-AgNPs. The ESIPT reaction of fisetin occurs under 365 nm excitation. The CTAB micelles provide the proper distance for fisetin and AgNPs, leading to the evident fluorescence enhancement of the system.
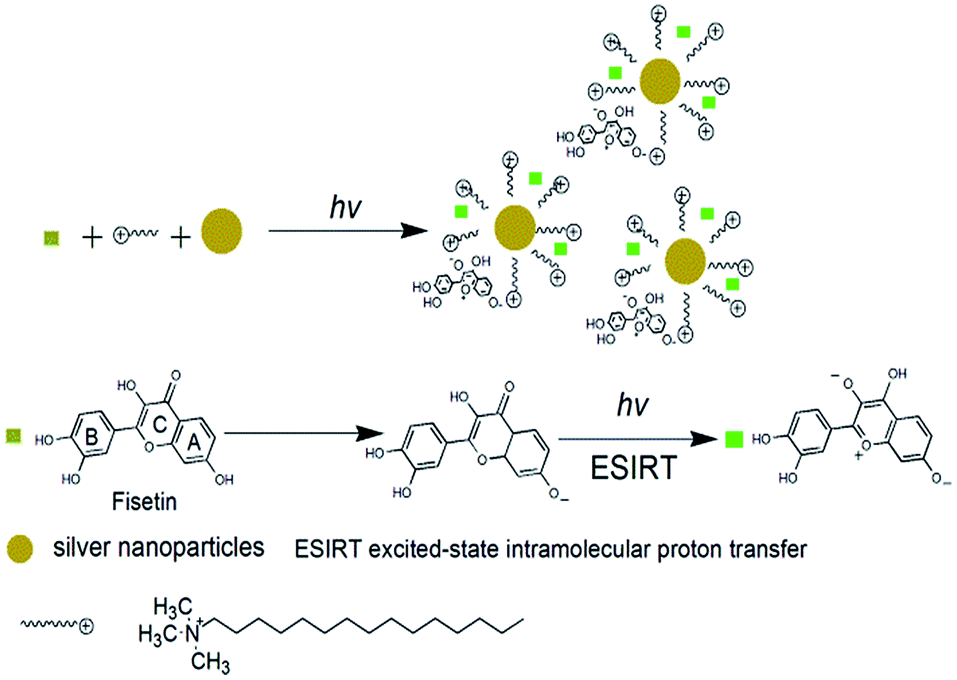 | ||
| Scheme 2 Schematic diagram of the mechanism of CTAB micelles-capped AgNPs enhance fluorescence of fisetin. | ||
Conclusions
In summary, we proposed in situ synthesized cetyltrimethyl ammonium bromide micelles-capped silver nanoparticles for the determination of fisetin. The detection limit (S/N = 3) is in nmol L−1. Investigations of the interaction mechanisms of the system demonstrate that fisetin molecules solubilize in cetyltrimethyl ammonium bromide micelles and then combine with silver nanoparticles coated by the micelles. In this work, the selective fluorescence response of fisetin is attributed to the binding site of hydroxyl groups and the solubilization in cetyltrimethyl ammonium bromide micelles. The CTAB micelles provide the suitable distance between fisetin and the surface of silver nanoparticles for metal-enhanced fluorescence, leading to the evident fluorescence enhancement of the system.Acknowledgements
This work was supported by the Natural Science Foundation of Shandong Province, China (Grant no. ZR2013BM025.Notes and references
- A.-M. Alam, M. Kamruzzaman, S. H. Lee, Y. H. Kim, S. Y. Kim and G. M. Kim, Microchim. Acta, 2012, 176, 153–161 CrossRef CAS.
- P. Hua, L. Zheng, L. Zhan, J. Li, S. Zhen and H. Liu, Anal. Chim. Acta, 2013, 787, 239–245 CrossRef PubMed.
- Y. Wang, Z. Li, H. Li, M. Vuki, D. Xu and H.-Y. Chen, Biosens. Bioelectron., 2012, 32, 76–81 CrossRef CAS PubMed.
- H. Li, C.-Y. Chen, X. Wei, W. Qiang, Z. Li and Q. Cheng, Anal. Chem., 2012, 84, 8656–8662 CrossRef CAS PubMed.
- J. Zhang, Y. Fu, M. H. Chowdhury and J. R. Lakowicz, Nano Lett., 2007, 7, 2101–2107 CrossRef CAS PubMed.
- H. Li, W. Qiang, M. Vuki, D. Xu and H.-Y. Chen, Anal. Chem., 2011, 83, 8945–8952 CrossRef CAS PubMed.
- J. Zhang, N. Ma, F. Tang, Q. Cui, F. He and L. Li, ACS Appl. Mater. Interfaces, 2012, 4, 1747–1751 CAS.
- B. Pahari, B. Sengupta, S. Chakraborty, B. Thomas, D. McGowan and P. K. Sengupta, J. Photochem. Photobiol., B, 2013, 118, 33–41 CrossRef CAS PubMed.
- G. Gutiérrez-Venegas and A. Contreras-Sánchez, Mol. Biol. Rep., 2013, 40, 477–485 CrossRef PubMed.
- K. T. Howitz, K. J. Bitterman, H. Y. Cohen, D. W. Lamming, S. Lavu and J. G. Wood, Nature, 2003, 425, 191–196 CrossRef CAS PubMed.
- I.-J. Jo, G.-S. Bae, S. B. Choi, D.-G. Kim, J.-Y. Shin and S.-H. Seo, Eur. J. Pharmacol., 2014, 737, 149–158 CrossRef CAS PubMed.
- N. Khan, F. Afaq, D. N. Syed and H. Mukhtar, Carcinogenesis, 2008, 29, 1049–1056 CrossRef CAS PubMed.
- D. N. Syed, F. Afaq, N. Maddodi, J. J. Johnson, S. Sarfaraz and A. Ahmad, J. Invest. Dermatol., 2011, 131, 1291–1299 CrossRef CAS PubMed.
- G. S. Prasath, S. I. Pillai and S. P. Subramanian, Eur. J. Pharmacol., 2014, 740, 248–254 CrossRef CAS PubMed.
- P. Maher, T. Akaishi and K. Abe, Proc. Natl. Acad. Sci. U. S. A., 2006, 103, 16568–16573 CrossRef CAS PubMed.
- A. S. Roy, N. K. Pandey and S. Dasgupta, Mol. Biol. Rep., 2013, 40, 3239–3253 CrossRef PubMed.
- S. Xu, Y. Shao, K. Ma, Q. Cui, G. Liu and F. Wu, Sens. Actuators, B, 2012, 171–172, 666–671 CrossRef CAS.
- I. Novak, P. Janeiro, M. Seruga and A. M. Oliveira-Brett, Anal. Chim. Acta, 2008, 630, 107–115 CrossRef CAS PubMed.
- F. Fang, J.-M. Li, Q.-H. Pan and W.-D. Huang, Food Chem., 2007, 101, 428–433 CrossRef CAS.
- L. Jiang, G. Fang, Y. Zhang, G. Cao and S. Wang, J. Agric. Food Chem., 2008, 56, 11571–11577 CrossRef CAS PubMed.
- D. Brondani, I. C. Vieira, C. Piovezan, J. M. R. da Silva, A. Neves and J. Dupont, Analyst, 2010, 135, 1015–1022 RSC.
- G. J. Volikakis and C. E. Efstathiou, Talanta, 2000, 51, 775–785 CrossRef CAS PubMed.
- J. Zheng, X. Wu, M. Wang, D. Ran, W. Xu and J. Yang, Talanta, 2008, 74, 526–532 CrossRef CAS PubMed.
- M. R. Guzzo, M. Uemi, P. M. Donate, S. Nikolaou, A. E. H. Machado and L. T. Okano, J. Phys. Chem. A, 2006, 110, 10545–10551 CrossRef CAS PubMed.
- A. Banerjee and P. K. Sengupta, Chem. Phys. Lett., 2006, 424, 379–386 CrossRef CAS.
- J. M. Herrero-Martinez, M. Sanmartin, M. Roses, E. Bosch and C. Rafols, Electrophoresis, 2005, 26, 1886–1895 CrossRef CAS PubMed.
- G. Li, D. Zhu, Q. Liu, L. Xue and H. Jiang, Org. Lett., 2013, 15, 924–927 CrossRef CAS PubMed.
- S.-j. Yu, J.-b. Chao, Y.-g. Sun, J.-f. Liu and G.-b. Jiang, Environ. Sci. Technol., 2013, 47, 3268–3274 CrossRef CAS PubMed.
- M. Wang, T. Teslova, F. Xu, T. Spataru, J. R. Lombardi and R. L. Birke, J. Phys. Chem. C, 2007, 111, 3038–3043 CAS.
- J. M. Dimitrí Markoví, Z. S. Markoví, D. Milenkoví and S. Jeremí, Spectrochim. Acta, Part A, 2011, 83, 120–129 CrossRef PubMed.
- S. M. Ansar, X. Li, S. Zou and D. Zhang, J. Phys. Chem. Lett., 2012, 3, 560–565 CrossRef CAS.
- B. Naseem, S. W. H. Shah, A. Hasan and S. S. Shah, Spectrochim. Acta, Part A, 2010, 75, 1341–1346 CrossRef PubMed.
- W. Liu and R. Guo, J. Colloid Interface Sci., 2006, 302, 625–632 CrossRef CAS PubMed.
Footnote |
| † Electronic supplementary information (ESI) available. See DOI: 10.1039/c4ra127726a |
| This journal is © The Royal Society of Chemistry 2015 |