Host matrix impact on Er3+ upconversion emission and its temperature dependence

A. K. Singh*a, Praveen Kumar Shahib, S. B. Raib and Bruno Ullrichac
aInstituto de Ciencias Físicas, Universidad Nacional Autónoma de México, Cuernavaca, Morelos 62210, Mexico. E-mail: akhilesh_singh343@yahoo.com
bDepartment of Physics, Banaras Hindu University, Varanasi-221005, India
cUllrich Photonics LLC, Wayne, Ohio 43466, USA

Received 17th October 2014 , Accepted 29th January 2015

First published on 29th January 2015


Abstract

By synthesizing Y(1.9−2x)Yb0.1Er2xO3, Y(0.95−x)Yb0.05ErxVO4 and Y(0.95−x)Yb0.05ErxPO4 phosphors, with phonon frequency maxima at 560, 826 and 1050 cm−1, respectively, we present the impact of phonon energy and crystal structure of the host matrix on upconversion and temperature sensing behavior. The spectral upconversion characteristics of all three phosphors reveal noticeable differences. The temperature sensing studies reveal that the phosphors have maximum sensitivity at ∼490 K, which is found to be highest (0.0105 K−1) in Y0.947Yb0.05Er0.003VO4 followed by Y1.894Yb0.1Er0.006O3 and Y0.947Yb0.05Er0.003PO4 phosphors. We found that the temperature sensitivity basically depends on the intensity ratio of two thermally coupled emission bands, 2H11/24I15/2 and 4S3/24I15/2, of Er3+. Further, the intensity ratio depends on phonon energy of the host lattice, crystal structure, surface quenching centers and the temperature dependence of non-radiative decay rate.

1. Introduction

Conventional methods for temperature measurements, which employ, for example liquid-filled thermometers, thermocouples, and thermistors are not applicable for temperature measurement of objects below 10 μm size.1 Consequently, temperature sensing in the microcosm requires altered, non-traditional probing techniques. This can be done with luminescence-based temperature sensors, which can be used for biological and technological applications, such as measuring the temperature of microfluids and microcircuits, to name a few.2,3 The here pursued principle basically uses lanthanide ions as a luminescence center, whilst the emission intensity, lifetime or intensity ratio of two-thermally coupled bands is monitored as a function of temperature to record the temperature of an object.4–10

Luminescence intensity and lifetime-based temperature sensing is generally performed in lanthanide complexes or lanthanide-based inorganic–organic hetero-paired nanostructures. However, the use of ultraviolet light as an excitation source limits their biological applicability,11,12 and additionally, power fluctuations and other environmental effects might influence the performance. On the other hand, temperature probing by means of luminescence intensity ratio variations overcomes these problems. The lanthanide which is commonly used for this purpose are Er3+, Ho3+, Tm3+, etc. The advantage with these ions is that they show efficient upconversion (UC) under near infrared (NIR) irradiation exposure, and therefore, are suitable for biological applications as well. It is important to note that temperature measurements relying on luminescence intensity ratios contain the precise information about the temperature in a single emission spectrum and are not influenced by intensity variations of the excitation source and photo detector drifts. In literature mainly Er3+, Ho3+, Nd3+ and Tm3+ doped phosphors have been used for temperature sensing.8–10 Among them Er3+ activated phosphors are preferred because of strong UC emission intensities for the thermally-coupled levels (2H11/2 and 4S3/2). The nature of temperature versus sensitivity plots reported in literature varies in different phosphors.1–10 Bearing in mind that the host lattice phonon energy affects the UC emission, it may also alter the sensitivity of temperature sensor.13–16 Therefore, it is important to investigate the role of host matrix (phonon energy, crystal structure, etc.) on UC emission and temperature sensing characteristics. In order to perform this study, which – to the best of our knowledge – cannot be found in the literature, we have synthesized Y(1.9−2x)Yb0.1Er2xO3, Y(0.95−x)Yb0.05ErxVO4 and Y(0.95−x)Yb0.05ErxPO4 phosphors by a solid state reaction method and studied the UC emission and its potential for temperature sensing.

2. Experimental

2.1 Materials

Analytical reagent (AR) grade yttrium oxide (Y2O3, 99.99%, Himedia), vanadium pentaoxide (V2O5, 99.9%, Loba Chemicals), phosphorus pentaoxide (P4O10 (empirical formula P2O5), 99.9%, Loba Chemicals), ytterbium oxide (Yb2O3, 99.9%, Aldrich) and erbium oxide (Er2O3, 99.9%, Aldrich) were used for the synthesis of Y(1.9−2x)Yb0.1Er2xO3, Y(0.95−x)Yb0.05ErxVO4 and Y(0.95−x)Yb0.05ErxPO4 phosphors.

2.2 Synthesis

For the synthesis of Y(1.9−2x)Yb0.1Er2xO3, Y(0.95−x)Yb0.05ErxVO4 and Y(0.95−x)Yb0.05ErxPO4 (x = 0.003, 0.01, and 0.02) phosphors the following, stoichiometric amounts of raw materials were mixed homogeneously in an agate mortar using AR grade acetone as a mixing medium:
image file: c4ra12637h-t1.tif

image file: c4ra12637h-t2.tif

image file: c4ra12637h-t3.tif

Afterwards, the samples were kept at ambient temperature for overnight drying. The mixture was then placed in an alumina crucible and calcined in high temperature furnace at the optimized temperature of 1523 K for 5 h. For the temperature sensing experiments, phosphor samples were produced in pellet form with diameter and thickness of 12 and 1.5 mm, respectively, and were sintered at 1573 K for 5 h.

2.3 Characterization

X-ray diffraction (XRD) patterns and Fourier transform infrared (FTIR) transmission spectra (from 400 to 4000 cm−1 with a resolution of 2 cm−1) of the samples were measured with a Rigaku (MiniFlex II DEXTOP) powder diffractometer (CuKα radiation (1.5404 Å)) and a Thermo Scientific FTIR spectrometer (NICOLET 6700), respectively. The down-shifting (DS) PL measurements were performed employing the fluorolog-3 spectrofluorometer (FL3-11, Horiba Jobin Yvon) equipped with a 450 W xenon flash lamp. The DS lifetime measurements were carried out with a pulsed xenon lamp (25 W) by the same setup. The UC luminescence was excited by the 976 nm emission of a tunable continuous wave (cw) 2 W diode laser, while the data collection was addressed via the conjunction of aiHR 320 (Horiba JobinYvon) spectrometer with an attached R928P photomultiplier tube (PMT). For the lifetime measurement of the 2H11/2 and 4S3/2 levels the laser beam was mechanically chopped at 10 Hz and the data were acquired using analog digital scope-HM1507 running software SP107. To measure the UC emission at different temperatures, the pellets were mounted on a homemade heating device, whereas the laser was focused near to the pellet edge keeping the thermocouple in close proximity (within ∼4 mm) to the focal spot.

3. Results and discussion

3.1 Structural analysis

In order to check the phase purity and to determine the crystal structure parameters, Rietveld analyses of the powder diffraction data have been carried out using the crystal structure refinement program “FULLPROF”.17 The Pseudo-Voigt function has been used to define the peak profile. In case of the Y1.894Yb0.1Er0.006O3 phosphor all the diffraction peaks match well using Ia[3 with combining macron] (206) space group (JCPDS no. 41-1105) of cubic structure. The structure provides two cation symmetry sites, C2 and C3i, with six-fold oxygen coordination. The Wyckoff positions for these two cationic sites are 8b and 24d with local symmetry C3i and C2, respectively, whilst oxygen ions are located at 48e Wyckoff positions. The Y0.947Yb0.05Er0.003VO4 and Y0.947Yb0.05Er0.003PO4 phosphors have zircon type tetragonal crystal structure with space group I41/amd (141). The Wyckoff positions for Y, V(P) and O are 4a, 4b and 16h, respectively. In this structure, Y and V(P) are surrounded by eight oxygen atoms having two different bond lengths and by four oxygen atoms with equal bond lengths, respectively, and between YO8 and VO4 (PO4) units two oxygen atoms are corner-sharing. The VO4 (PO4) (tetrahedron) has S4 symmetry, whilst YO8 (dodecahedron) has D2d symmetry. The Yb/Er atoms substitute Y sites in the lattice. Fig. 1 depicts the Rietveld fits for Y1.894Yb0.1Er0.006O3, Y0.947Yb0.05Er0.003VO4 and Y0.947Yb0.05Er0.003PO4 phosphors, indicating a good agreement between observed and calculated XRD patterns. The refinement parameters are given in Table 1. The XRD analysis clearly depicts that Y1.894Yb0.1Er0.006O3 and Y0.947Yb0.05Er0.003VO4 are phase pure, whereas Y0.947Yb0.05Er0.003PO4 has small surplus of unreacted Y2O3.
image file: c4ra12637h-f1.tif
Fig. 1 X-ray diffraction patterns of the Y1.894Yb0.1Er0.006O3, Y0.947Yb0.05Er0.003VO4 and Y0.947Yb0.05Er0.003PO4 phosphors: the experimental results are represented by dots, and the solid lines show the calculation and difference (bottom) profiles after Rietveld refinement. Vertical tick marks above the difference plot show the positions of the Bragg peaks.
Table 1 Refine structural parameters for Y1.894Yb0.1Er0.006O3 (space group = Ia[3 with combining macron]), Y0.947Yb0.05Er0.003VO4 (space group = I41/amd) and Y0.947Yb0.05Er0.003PO4 (space group = I41/amd) phosphors
Sample Atoms Positional Coordinates Occupancy Thermal parameters
X Y Z B (Å2)
Y1.894Yb0.1Er0.006O3 Y/Yb/Er 0.25(0) 0.25(0) 0.25(0) 1.0 0.63(7)
Y/Yb/Er 0.968(2) 0.00(0) 0.25(0) 1.0 0.45(5)
O 0.392(1) 0.156(2) 0.376(2) 3.0 0.41(8)
a = b = c = 10.5935(2) Å, Rp = 12.0, Rwp = 16.9, Rexp = 11.74, χ2 = 2.06
Y–O = 2.4441 Å (48), Y–Y = 3.5138 Å (48), Y–Y = 3.9923 Å (24), Y–Y = 3.5302 Å (48), Y–O = 2.2717 Å (48), Y–O = 2.3904 Å (48), O–Y = 2.2437 Å (24), Y–Y = 4.0064 Å (24)
Y0.947Yb0.05Er0.003VO4 Y/Yb/Er 0.00(0) 0.75(0) 0.125(0) 1.0 0.70(4)
V 0.00(0) 0.25(0) 0.375(0) 1.0 0.08(1)
O 0.00(0) 0.435(1) 0.203(1) 4.0 0.13(2)
a = b = 7.1112(2) Å, c= 6.2860(2) Å, RB = 8.9, Rwp = 11.3, Rexp = 4.98, χ2 = 5.14
Y–Y = 3.8842 Å (5), Y–V = 3.1405 Å (6), Y–O = 2.2882 Å (14), Y–O = 2.4352 Å (12), V–O = 1.7088 Å (16)
Y0.947Yb0.05Er0.003PO4 Y/Yb/Er 0.00(0) 0.75(0) 0.125(0) 1.0 0.60(4)
P 0.00(0) 0.25(0) 0.375(0) 1.0 0.09(1)
O 0.00(0) 0.426(1) 0.219(1) 4.0 0.23(2)
a = b = 6818(2) Å, c = 6.0187(2) Å, RB = 9.16, Rwp = 12.7, Rexp = 4.69, χ2 = 7.3
Y–Y = 3.7555 Å (5), Y–P = 3.0092 Å (6), Y–O = 2.30122 Å (14), Y–O = 2.3964 Å (12), P–O = 1.1.5325 Å (16)


To determine the phonon frequency of the host lattices, we monitored the FTIR spectra of Y1.894Yb0.1Er0.006O3, Y0.947Yb0.05Er0.003VO4 and Y0.947Yb0.05Er0.003PO4 phosphors (see Fig. 2). The Y1.894Yb0.1Er0.006O3 shows a strong sharp peak due to the stretch of the Y–O bond at 560 cm−1, and Y0.947Yb0.05Er0.003VO4 and Y0.947Yb0.05Er0.003PO4 show intense peaks due to stretches of the V–O and P–O bonds at 826 and 1050 cm−1, respectively.14,18 In Y0.947Yb0.05Er0.003PO4 phosphor, the FTIR peaks at 523 and 638 cm−1 correspond to bending vibrations of P–O bonds.19 Thus, the FTIR studies reveal that all these host matrices possess considerably different phonon frequencies.


image file: c4ra12637h-f2.tif
Fig. 2 FTIR spectrum of Y1.894Yb0.1Er0.006O3, Y0.947Yb0.05Er0.003VO4 and Y0.947Yb0.05Er0.003PO4 phosphors.

3.2 Upconversion

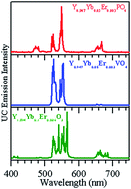
The UC emission spectra of Y0.947Yb0.05Er0.003PO4, Y0.947Yb0.05Er0.003VO4 and Y1.894Yb0.1Er0.006O3 are shown in Fig. 3. The Y1.894Yb0.1Er0.006O3 and Y0.947Yb0.05Er0.003VO4 phosphors show blue emission bands around 410 nm because of three-photon processes.8 The blue emission is more intense in Y1.894Yb0.1Er0.006O3 than in Y0.947Yb0.05Er0.003VO4 phosphor, most likely owing to the higher phonon energy of YVO4 host. The equivalent argument explains the absence of blue emission of Y0.947Yb0.05Er0.003PO4. The emission bands observed at 380, 410, 488, 523, 548 and 660 nm correspond to the 4G11/24I15/2, 2H9/24I15/2, 2H9/24I15/2, 4F7/24I15/2, 2H11/24I15/2, 4S3/24I15/2 and 4F9/24I15/2 transitions of Er3+ ion, respectively.5–8 It can also be noticed that all the emission bands show Stark components. The energy level splitting is the largest in Y1.894Yb0.1Er0.006O3 because of the difference in crystal field potential/distance between Er3+ and O2− (ligands) due to different crystal structure of the phosphors.20,21
image file: c4ra12637h-f3.tif
Fig. 3 Room temperature UC emission spectrum of Y1.894Yb0.1Er0.006O3, Y0.947Yb0.05Er0.003VO4 and Y0.947Yb0.05Er0.003PO4 phosphors.

In order to explain the origin of the UC emission transitions of the phosphors, Fig. 4 displays the energy level diagram of the Er3+ and Yb3+ ions. Basically, there are two distinct processes, i.e., the excited state absorption (ESA) and energy transfer (ET), which are responsible for the UC emission. The Er3+ ion in its ground state absorbs the incident NIR photon (ground state absorption, GSA) resulting in the resonant excitation of the 4I11/2 level, from where, via the absorption of a second photon the 4F7/2 level gets excited. As a result, the excitation scheme refers to a non-coherent two photon process. Instead re-excitation (from 4I11/2 level), however, the ion can relax to 4I13/2 level from where it can absorb a second photon and populate 4F9/2 level. The ion in 4F9/2 level can absorb a third photon populating the 2H9/2 level, or relaxes into the 4I15/2 level by emitting light at 660 nm. The ion in the 4F7/2 level can emit at 488 nm by relaxing to level 4I15/2, or through multiphonon non-radiative relaxation can populate the 2H11/2 and 4S3/2 levels. There are three possibilities for depopulation from these two levels: (i) emission at 523 and 548 nm via the 2H11/24I15/2 and 4S3/24I15/2 transitions, respectively, (ii) further relaxation to the 4F9/2 level, or (iii) the ion gets re-excited in the 4G7/2 level by the absorption of a third photon. The latter transition may result in blue and ultraviolet (UV) emissions.


image file: c4ra12637h-f4.tif
Fig. 4 Schematic energy level diagram of Er3+–Yb3+ showing mechanism involved in UC emissions.

It is important to stress at this point that the Er3+ ion itself has a very weak emission due to the low absorption cross section (1.7 × 10⁻²¹ cm2). However, by considering the factor 7 times greater absorption cross section (11.7 × 10⁻²¹ cm2) of the Yb3+ ion, the emission of the Yb3+/Er3+ co-doped samples can be increased by the energy transfer from Yb3+ to Er3+ ion.5 Additionally, keeping a concentration ratio of Yb3+/Er3+ = 16.7, the possibility of photon absorption by Yb3+ is considerably gained in comparison to Er3+. Fig. 4 shows that the Yb3+ can transfer single photon energy through different ways or it can transfer energy of two photons simultaneously through cooperative energy transfer (CET) process to 4F7/2 level of Er3+ ion. The UC emission in Yb3+/Er3+ co-doped phosphors for the given concentrations is basically due to ET process, while the probability of ESA and CET processes are very low.22

It is clearly of importance to discuss the reasons for the different green/red (G/R) emission intensity ratios in Fig. 3, which are ∼46.88, ∼2.66, and ∼5.18 (calculated by taking the ratio of integrated UC emission intensity of 500–586 nm and 625–720 nm regions) for Y0.947Yb0.05Er0.003VO4, Y0.947Yb0.05Er0.003PO4, and Y1.894Yb0.1Er0.006O3, respectively. To study the scatter of G/R intensity ratios, we prepared phosphors with different concentrations and recorded their DS and UC emission spectra, which are shown in Fig. 5 for Y1.86Yb0.1Er0.04O3, Y0.93Yb0.05Er0.02VO4, and Y0.93Yb0.05Er0.02PO4 phosphors (spectra for x = 0.02 composition are shown, because of higher possibility of red emission). The DS emission spectra of phosphors do not show red emission band, whereas it is observed in the UC emission spectra. Fig. S1 reveals that the intensity of the red emission band changes very little with Er3+ ion concentration (x = 0.003 to 0.02), but it significantly affected the G/R intensity ratio in Y(0.95−x)Yb0.05ErxVO4 phosphors. The UC emission spectrum of Y1.994Er0.006O3 phosphor, shown in Fig. S2, reveals only green emission bands, but an addition of Yb3+ ion in this phosphor (Y1.894Yb0.1Er0.006O3) causes the prominent red emission band. This observation suggests that – along with the overall UC emission change – the Yb3+ ion is also responsible for the G/R intensity alterations. The absence of the red emission band in the DS spectra clearly shows that mainly the ET process is the origin of the red emission band in UC spectrum, i.e. ion in the 4I13/2 level receives the energy via non-resonant energy transfer (most likely from Yb3+) and populates 4F9/2 level from where relaxation to the 4I15/2 level occurs – during the emission of red light emission at 660 nm.22–25 Thus, the difference in the G/R intensity ratio is basically due to the difference in lifetime of 4I11/2 and 4I13/2 levels in different host matrices. The lifetime of Er3+ levels in YVO4 host is significantly different than in other host matrices. Fig. S3 reveals that the lifetime of the 4S3/2 level of Er3+ ion in YVO4 is an order of magnitude less than in Y2O3 and YPO4 host matrices. The shorter lifetime of the 4S3/2 level of Er3+ in YVO4 could be attributed to wavefunction coupling between 3d orbital of V5+ and 4f orbital of Er3+. In YVO4 the energy levels of 2H11/2 and 4S3/2 of Er3+ are close to the 3T1 level of the V 3d orbital. These adjacent positions provoke strong coupling between the 2H11/2, 4S3/2 orbit of Er3+ and 3T1 level of the V 3d orbital, leading to oscillator strength increase in of the Er3+ ions.23 We should stress that Tolstik et al.24 measured lifetimes of 28 μs and 2.3 ms of the 4I11/2 and 4I13/2 levels of the Er3+ ion in YVO4 hosts, respectively. Both lifetimes are significantly lower than in Y2O3 and other host matrices22,25 and could be responsible for the relative intensity reduction of the red emission band in samples hosted by YVO4, causing the stronger green emission.


image file: c4ra12637h-f5.tif
Fig. 5 Room temperature DS and UC emission spectra of the Y1.86Yb0.1Er0.04O3, Y0.93Yb0.05Er0.02VO4, and Y0.93Yb0.05Er0.02PO4 phosphors.

The CIE (international commission on illumination) diagram provide the parameters x and y to demonstrate the color perception. This includes the hue and saturation on a two dimensional chromaticity diagram. We have given the color coordinates of Y1.894Yb0.1Er0.006O3, Y0.947Yb0.05Er0.003VO4 and Y0.947Yb0.05Er0.003PO4 in the CIE diagram shown in Fig. 6(a). The color perception reveals green (0.23, 0.74), yellowish (0.31, 0.67) blue-yellowish (0.30, 0.47) colors for the Y0.947Yb0.05Er0.003VO4, Y1.894Yb0.1Er0.006O3 and Y0.947Yb0.05Er0.004PO4 phosphors, respectively. It suggests that the color of the UC emission can also be tuned by modifications of the host lattices.


image file: c4ra12637h-f6.tif
Fig. 6 (a) The CIE chromaticity diagram for the UC emission in Y1.894Yb0.1Er0.006O3, Y0.947Yb0.05Er0.003VO4 and Y0.947Yb0.05Er0.003PO4. (b) The UC emission of Y0.947Yb0.05Er0.003PO4 measured at different temperatures.

3.3 Temperature sensing

In the Er3+ ion, the 2H11/2 and 4S3/2 levels are thermally coupled to each other and the intensity ratio (R) of the 2H11/24I15/2 and 4S3/24I15/2 emission bands is expressed as a function of temperature for temperature measurements. Fig. 6(b) shows the UC emission temperature dependence of Y0.945Yb0.05Er0.005PO4 in the wavelength range 500–575 nm. While the peak positions do not reveal sensitivity to temperature alterations, R considerably changes. At temperatures below ∼370 K the emission of 2H11/24I15/2 band is less intense than the one of 4S3/24I15/2 transition. For elevated temperatures beyond ∼470 K, however, the situation is opposite. The relative populations of the 2H11/2 and 4S3/2 levels follow the Boltzmann type distribution function, which leads to,
 
image file: c4ra12637h-t4.tif(1)
where, I523 and I548 are the integrated intensity of the 2H11/24I15/2 (515–540 nm) and 4S3/24I15/2 (540–565 nm) bands, N is the number of ions, and B = ωHAHgH/ωSASgS, with ω, A, g being the transition frequency, spontaneous emission rate from 2H11/2 and 4S3/2 to the ground level 4I15/2, and the level degeneracy, respectively – and k is the Boltzmann factor, T is the temperature, and ΔE is the energy gap between the 2H11/2 and 4S3/2 levels.

Fig. 7(a) shows R(T) for (i) Y0.947Yb0.05Er0.003VO4, (ii) Y1.894Yb0.1Er0.006O3, and (iii) Y0.947Yb0.05Er0.003PO4. As expected, caused by the above discussed differences of the recombination behaviors in Fig. 3, R varies for all the three samples. Additionally, the R(T) trend can also be affected by change of non-radiative relaxation rates during the temperature increase, causing variations of the luminescence intensities and lifetimes of the single transitions.


image file: c4ra12637h-f7.tif
Fig. 7 Temperature sensing performance of the samples: (a) R numbers of the 523 and 548 nm emission bands in (i) Y0.947Yb0.05Er0.003VO4, (ii) Y1.894Yb0.1Er0.006O3 and (iii) Y0.947Yb0.05Er0.003PO4, as a function of temperature. Temperature sensitivity in (b) Y0.947Yb0.05Er0.003VO4, (c) Y1.894Yb0.1Er0.006O3, and (d) Y0.947Yb0.05Er0.003PO4 vs. temperature.

The R fits displayed by the solid lines in Fig. 7(a) results in ΔE/k fit parameters of (i) 598, (ii) 599, and (ii) 581 for Y0.947Yb0.05Er0.003VO4, Y1.894Yb0.1Er0.006O3, and Y0.947Yb0.05Er0.003PO4, respectively. The result demonstrates the proximity of the average energy gap between the levels 2H11/2 and 4S3/2 in all three investigated phosphors. The sensitivity (S) of the sensor is defined as,

 
image file: c4ra12637h-t5.tif(2)
where the symbols have the same meanings as in eqn (1). Fig. 7(b)–(d) presents the calculated S(T) trend. The maximum sensitivity in Y0.947Yb0.05Er0.003VO4, Y1.894Yb0.1Er0.006O3, and Y0.947Yb0.05Er0.003PO4 phosphors is found to be 0.0105, 0.0077, 0.0035 K−1 at 499, 488, and 486 K, respectively.

It is important to mention that the temperature sensitivity in Y0.947Yb0.05Er0.003PO4 phosphor is significantly lower than in other two phosphors. This might be because of the higher phonon energy of the host lattice, which increases non-radiative relaxation from the 2H11/2 to the 4S3/2 level, resulting in the increase in the intensity of 548 nm emission with respect to the 523 nm emission (leading to smaller R). The value of 0.0105 maximum sensitivity observed in Y0.947Yb0.05Er0.003VO4 is probably the highest sensitivity reported for the luminescence intensity ratio based temperature sensors.1–12 The maximum sensitivity in all the three phosphors is observed ∼490 K, while, above this temperature, sensitivity starts to decrease. This might be because of the resonance of thermal phonon energy with the energy separation of the levels and/or the population saturation of the 2H11/2 level at increasing temperatures.

4. Conclusion

Summarizing, X-ray data analysis reveals the cubic structure for Y1.894Yb0.1Er0.006O3 and the tetragonal structure for Y0.947Yb0.05Er0.003VO4 and Y0.947Yb0.05Er0.003PO4. The optical studies show that the phonon energy and crystal structure of the host lattices affect the UC emission intensity of the blue, green and red emission bands, as well as the Stark splitting of the levels. The R value in Y0.947Yb0.05Er0.003PO4 is significantly lower than in Y1.894Yb0.1Er0.006O3 and Y0.947Yb0.05Er0.003VO4 because of the higher phonon energy in Y0.947Yb0.05Er0.003PO4, enforcing faster relaxation from the 2H11/2 to the 4S3/2 level. The maximum temperature sensitivity in all the three phosphors takes place in the vicinity of 490 K, which is the highest (0.0105 K−1) in Y0.947Yb0.05Er0.003VO4.

Authors' contributions

The manuscript was written through the contributions of all the authors. A.K.S. and P.K.S. have contributed equally to this work and therefore both are the first author of this manuscript. All the authors have given approval to the final version of the manuscript.

Acknowledgements

PKS acknowledges UGC, India for the award of JRF fellowship. AKS thankfully acknowledges the DGAPA-UNAM program of post-doctoral fellowship. The work was partly supported by the DGAPA-UNAM PAPIIT project TB100213-RR170213 (PI Dr Bruno Ullrich). The authors also thankfully acknowledge DST, New Delhi for experimental facilities. The authors also acknowledge S. K. Singh for his support during the experiments and valuable discussions.

References

  1. C. D. S. Brites, P. P. Lima, N. J. O. Silva, A. Millán, V. S. Amaral, F. Palacio and L. D. Carlos, New J. Chem., 2011, 35, 1177–1183 RSC.
  2. F. Vetrone, R. Naccache, A. Zamarrón, A. J. de la Fuente, F. Sanz-Rodríguez, L. Martinez Maestro, E. M. Rodriguez, D. Jaque, J. G. Solé and J. A. Capobianco, ACS Nano, 2010, 4, 3254–3258 CrossRef CAS PubMed.
  3. L. H. Fischer, G. S. Harms and O. S. Wolfbeis, Angew. Chem., Int. Ed., 2011, 50, 4546–4551 CrossRef CAS PubMed.
  4. H. Peng, M. I. J. Stich, J. Yu, L. Sun, L. H. Fischer and O. S. Wolfbeis, Adv. Mater., 2010, 22, 716–719 CrossRef CAS PubMed.
  5. A. K. Singh, S. K. Singh, B. K. Gupta, R. Prakash and S. B. Rai, Dalton Trans., 2013, 42, 1065–1072 RSC.
  6. B. Dong, B. Cao, Y. He, Z. Liu, Z. Li and Z. Feng, Adv. Mater., 2012, 24, 1987–1993 CrossRef CAS PubMed.
  7. R. Dey and V. K. Rai, Dalton Trans., 2014, 43, 111–118 RSC.
  8. S. K. Singh, K. Kumar and S. B. Rai, Sens. Actuators, A, 2009, 149, 16 CrossRef CAS PubMed.
  9. X. Wang, J. Zheng, Y. Xuan and X. Yan, Opt. Express, 2013, 21, 21596–21606 CrossRef CAS PubMed.
  10. A. Pandey and V. K. Rai, Dalton Trans., 2013, 42, 11005–11011 RSC.
  11. J. B. Yu, L. N. Sun, H. S. Peng and M. I. J. Stich, J. Mater. Chem., 2010, 20, 6975–6981 RSC.
  12. B. Zelelow, G. E. Khalil, G. Phelan, B. Carlson, M. Gouterman, J. B. Callis and L. R. Dalton, Sens. Actuators, B, 2003, 96, 304–314 CrossRef CAS.
  13. F. Wang and X. Liu, Chem. Soc. Rev., 2009, 38, 976–989 RSC.
  14. A. K. Singh, S. K. Singh, P. Kumar, B. K. Gupta, R. Prakash and S. B. Rai, Sci. Adv. Mater., 2014, 6, 405–412 CrossRef CAS PubMed.
  15. F. Auzel, Chem. Rev., 2004, 104, 139–173 CrossRef CAS PubMed.
  16. A. K. Singh, S. K. Singh and S. B. Rai, RSC Adv., 2014, 4, 27039–27061 RSC.
  17. J. Rodriguez-Carvajal, FULLPROF a Rietveld and pattern matching analysis program, Laboratoire Leon Brillouin (CEA-CRNS), France, 2007 Search PubMed.
  18. K. Mishra, S. K. Singh, A. K. Singh and S. B. Rai, Mater. Res. Bull., 2013, 48, 4307–4313 CrossRef CAS PubMed.
  19. A. K. Parchur, A. I. Prasad, S. B. Rai, R. Tewari, R. K. Sahu, G. S. Okram, R. A. Singh and R. S. Ningthoujam, AIP Adv., 2012, 2, 032119 CrossRef PubMed.
  20. B. F. Aull and H. P. Jenssen, Phys. Rev. B: Condens. Matter Mater. Phys., 1986, 34, 6640–6646 CrossRef CAS.
  21. L. Sorace, C. Benelli and D. Gatteschi, Chem. Soc. Rev., 2011, 40, 3092–3104 RSC.
  22. H. Lu, W. P. Gillin and I. Hernandez, Phys. Chem. Chem. Phys., 2014, 16, 20957–20963 RSC.
  23. W. Xu, B. Chen, W. Yu, Y. Zhu, T. Liu, S. Xu, X. Min, X. Bai and H. Song, Dalton Trans., 2012, 41, 13525–13532 RSC.
  24. N. A. Tolstik, A. E. Troshin, S. V. Kurilchik, V. E. kisel, N. V. Kuleshov, V. N. Matrosov, T. A. Matrosova and M. I. Kupchenko, Appl. Phys. B: Lasers Opt., 2007, 86, 275–278 CrossRef CAS.
  25. A. Jaffrès, P. Loiseau, G. Aka, B. Viana, C. Larat and E. Lallier, Laser Phys., 2014, 24, 125801 CrossRef.

Footnote

Electronic supplementary information (ESI) available: UC emission spectra of Y1.994Er0.006O3, Y(1.9−2x)Yb0.1Er2xO3, Y(0.95−x)Yb0.05ErxVO4 and Y(0.95−x)Yb0.05ErxPO4 (x = 0.003, 0.01 and 0.02) phosphors and luminescence decay curves of 4S3/2 level of Er3+ ion in Y1.894Yb0.1Er0.006O3, Y0.947Yb0.05Er0.003VO4 and Y0.947Yb0.05Er0.003PO4 phosphors are given. See DOI: 10.1039/c4ra12637h

This journal is © The Royal Society of Chemistry 2015