Investigation of luminescence properties and the energy transfer mechanism of Li6Lu(BO3)3:Ce3+, Tb3+ green-emitting phosphors
Irish Valerie B. Maggay,
Pin-Chun Lin and
Wei-Ren Liu*
Chung Yuan Christian University, Department of Chemical Engineering, Chung Li, Taiwan. E-mail: WRLiu1203@gmail.com
First published on 12th December 2014
Abstract
Li6Lu(BO3)3:Ce3+, Tb3+ phosphor was synthesized via a conventional solid-state method. The phase purity, photoluminescence properties, energy transfer mechanism, thermal stability and chromaticity coordinates were investigated. The absorption spectrum was comprised of broad bands in the UV region and the emission spectrum was consisted of characteristic peaks from both Ce3+ and Tb3+ under UV excitation. The amount of Ce3+ was fixed to 3 mol% while Tb3+ was varied from 20 to 80 mol% and the chromaticity coordinates were tuned from the blue to green region. The energy transfer mechanism between Ce3+ and Tb3+ was attributed to a quadrupole–quadrupole interaction and the critical distance was measured to be 8.12 Å. The overall performance of the phosphor was enhanced by the efficient energy transfer between Ce3+ and Tb3+ ions.
Introduction
White light emitting diodes (W-LEDs) have provided remarkable advances in lighting technologies and displays. They have gained significant attention over conventional lighting sources due to their advantages such as low energy consumption, long operational lifetime, high efficiency, high stability and less environmental threat.1–11 Commercially available W-LEDs are fabricated by combining a blue emitting InGaN-based LED chip covered by a yellow emitting phosphor Y3Al5O12:Ce3+ (YAG).1,2,4,6,7,10,11 However, YAG suffers from inevitable drawbacks such as low color rendering index (CRI) (Ra < 80) and high correlated color temperature (CCT) (Tc > 4500 K) due to the insufficient red emission in the visible spectrum.1–4,6–8,10,11 Moreover, blue LED chip and yellow phosphor have different degradation rates causing chromatic aberration and decreased efficiency over long period of time.1 To overcome these defects, a new method has been developed by coupling red, green and blue tricolor phosphors with n-UV LED chip in order to produce high CRI, high color stability and good color uniformity.1,2,6,7,10 Thus, developments of new phosphors with high chemical stability and strong absorption in UV or near-UV region with high conversion efficiency are highly crucial.1–3,10Borate compounds are widely used in nonlinear optics, piezo and scintillation techniques and phosphors for W-LEDs12 due to its low synthesizing temperature and high physical and chemical stability.2 Recent investigations were conducted on NaSrBO3:Ce3+,2 MSr4(BO3)3:Ce3+ (M = Li and Na),3 Ca3Y2(BO3)4:Eu3+,4 Na3La2(BO3)3:Ce3+, Tb3+,5 KSr4(BO3)3:Eu3+,7 LiSr4(BO3)3:Ce3+, Eu2+,11 LiCaBO3,13 Ba2Ca(BO3)2:Ce3+![[thin space (1/6-em)]](https://www.rsc.org/images/entities/char_2009.gif) 14 and KCa4(BO3)3:Ln3+ (Ln = Dy, Eu, Tb).15 (Li6Ln(BO3)3 (Ln = Gd, Y) were investigated and showed promising results on W-LEDs and nonlinear optics application.12,17–19 Li6Lu(BO3)3 host was first synthesized and studied by Yang et al.16 and Fawad et al.20 and it exhibited potential applications for neutron detection scintillator).
14 and KCa4(BO3)3:Ln3+ (Ln = Dy, Eu, Tb).15 (Li6Ln(BO3)3 (Ln = Gd, Y) were investigated and showed promising results on W-LEDs and nonlinear optics application.12,17–19 Li6Lu(BO3)3 host was first synthesized and studied by Yang et al.16 and Fawad et al.20 and it exhibited potential applications for neutron detection scintillator).
Energy transfer plays a crucial role in enhancing the luminescent properties of rare earth ions such as Tb3+ and Eu3+ which display only narrow excitation peaks near UV region due to the forbidden f–f transition and only yield sharp and weak emission peaks.1 Ce3+ is not only used as an activator but also as a sensitizer. It can generate strong excitation peaks near UV region and can provide efficient conversion to longer wavelengths.22 Several Ce3+ and Tb3+ co-doped phosphors were synthesized such as Ba3Gd(PO4)3:Ce3+, Tb3+,1 Na3La2(BO3)3:Ce3+, Tb3+,5 SrMgSi2O6:Ce, Tb,6 Sr2B5O9Cl:Ce3+, Tb3+,8 BaAl2B2O7:Ce3+, Tb3+,9 Sr3MgSi2O8:Ce3+, Tb3+,10 SrAl2B2O7:Ce3+, Tb3+,21 Ca3Y2Si3O12:Ce3+, Tb3+![[thin space (1/6-em)]](https://www.rsc.org/images/entities/char_2009.gif) 23 and so on.
23 and so on.
To the best of our knowledge, the luminescence properties of Li6Lu(BO3)3:Ce3+, Tb3+ have not been investigated yet. Borate host phosphors have lower synthesizing temperature than that of other host phosphors, such as silicon-based, aluminum-based and nitride-based system. These borate-based phosphors, such as Sr2B2O5:Ce3+, Tb3+ (1073 K), NaCaBO3 (1123 K), KCa4(BO3)3 (1073 K) have been reported.2,15,26,27 In this study, pure phased-Li6Lu(BO3)3 was obtained at a much lower temperature of 973 K with high purity, providing an energy-saving and cost effective advantages over other phosphors. In this study, the crystal structure, photoluminescence (PL) properties, color chromaticity, energy transfer mechanism between the sensitizer and activator, and thermal quenching were investigated. The results indicate that Li6Lu(BO3)3:Ce3+, Tb3+ is a potential green emitting phosphor for UV-LED applications.
Experimental section
Materials and synthesis
A series of rare earth-doped Li6Lu(BO3)3:xCe3+, yTb3+ (x = 0.005, 0.01, 0.03, 0.05, 0.07, 0.10 mol and y = 0.20, 0.40, 0.60, 0.70 and 0.80 mol) phosphors were synthesized via solid state reactions. The reactants used were Li2CO3 (99.99%, Aldrich), H3BO3 (99.99%, Aldrich), Lu2O3 (99.99, Aldrich), CeO2 (99.99%, Aldrich) and Tb4O7 (99.99%, Aldrich). The stoichiometric proportions of the precursors were weighed and thoroughly ground in an agate mortar. Subsequently, the powder was heated at 973 K for 8 hours under a reducing atmosphere (15% H2/85% N2). The products were then cooled down to ambient temperature and ground for further analyses.Materials characterization
The crystallinity of the as-synthesized samples were characterized using X-ray diffractometer with Cu Kα (λ = 1.5418 Å) generated at 45 kV and 30 mA. Data were gathered in the 2θ range of 10° to 80° with a scan speed of 5° min−1. The luminescence properties of the samples were determined using PL/PLE at room temperature and were recorded by a Spex-Fluorolog-3 spectrophotometer equipped with 450 W Xenon light source and measured with a scan rate of 150 nm min−1. Commission International de I'Eclairage (CIE) chromaticity coordinates of the samples were measured using a Laiko DT-101 color analyzer equipped with a CCD detector (Laiko Co., Tokyo, Japan).Results and discussion
XRD and crystal structure investigation
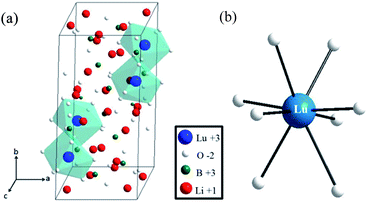
The X-ray powder diffraction (XRD) patterns of Li6Lu(BO3)3 doped with 0.03Ce3+, 0.80Tb3+ and 0.03Ce3+, 0.65Tb3+ are presented in Fig. 1. The data indicate that the peaks of the samples were consistent with the standard JCPDS #83-0843 and no impurities were observed even with heavy doping of Tb3+ ions. Therefore, pure-phased samples were obtained. Lu3+ ions were successfully substituted by Ce3+ ions and Tb3+ ions due to their comparable ionic radii (Lu3+ = 0.977 Å, Ce3+ = 1.14 Å, Tb3+ = 1.04 Å). Li6Lu(BO3)3 host phosphor belongs to the monoclinic system of Li6RE(BO3)3 (RE = Gd, Y, Yb, Ho) and space group of P21/c.12,16,17 The lattice parameters were calculated to be a = 0.7236 nm, b = 1.6584 nm, c = 0.6693 nm and β = 105.42°. The crystal structure of Li6Lu(BO3)3 is shown in Fig. 2(a). The structural unit of Li6Ln(BO3)3 (Ln = Gd, Y, Lu) consists of isolated boron with a triangular coordination with oxygen atoms, Li+ ions surrounded by four or five oxygen atoms forming trigonal bipyramids or tetrahedron prisms, and distorted eight-fold Lu3+ with C1 site symmetry. LuO8 polyhedra are connected with each other by common edges along the direction oblique to the c axis.9,12,18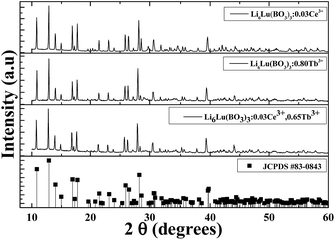 | ||
| Fig. 1 XRD patterns of different samples synthesized at 973 K for 8 hours under 15% H2/85% N2 reducing atmosphere. | ||
Photoluminescence properties of Li6Lu(BO3)3:xCe3+
Fig. 3 illustrates the PL/PLE of Li6Lu(BO3)3:xCe3+. When the sample is excited at 350 nm it displays an asymmetric broad band from 360–480 nm. This phenomenon was due to the dual emission of Ce3+ attributed to the parity allowed transition from the lowest 5d level to the 2F5/2 and 2F7/2 ascribed to the spin–orbit coupling of the 4f ground state of Ce3+.6,9,10,23 The emission band can be decomposed into two Gaussian profiles with maximum peaks at approximately 382 nm (26![[thin space (1/6-em)]](https://www.rsc.org/images/entities/char_2009.gif) 178 cm−1) and 415 nm (24
178 cm−1) and 415 nm (24![[thin space (1/6-em)]](https://www.rsc.org/images/entities/char_2009.gif) 096 cm−1) depicted in the inset with a difference of approximately 2082 cm−1. This result is comparable to the theoretical value of ≈2000 cm−1.2,10,11 The excitation spectrum monitored at 400 nm consists of two broad bands with maximum peak at 350 nm which was due to the 4f → 5d transition of Ce3+.1,2,6,8,9,21
096 cm−1) depicted in the inset with a difference of approximately 2082 cm−1. This result is comparable to the theoretical value of ≈2000 cm−1.2,10,11 The excitation spectrum monitored at 400 nm consists of two broad bands with maximum peak at 350 nm which was due to the 4f → 5d transition of Ce3+.1,2,6,8,9,21
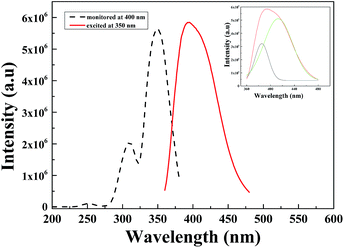 | ||
| Fig. 3 PL/PLE of Li6Lu0.97(BO3)3:0.03Ce3+ excited at 350 nm and monitored at 400 nm. Inset shows the Gaussian deconvolution of Ce3+ emission. | ||
A series of 0.005, 0.01, 0.03, 0.05, 0.07 and 0.10 mol concentration of Ce3+ were prepared and is presented in Fig. 4. It is evident that the emission intensity of samples initially increased as Ce3+ concentration increased until it reached maximum intensity at 3 mol%. Further increase of Ce3+ concentration resulted in decreased intensity due to the concentration quenching of the Ce3+. Also, it is noticeable that the emission spectra are shifted to a longer wavelength at higher Ce3+ concentration and the peak emission is red shifted from 388 nm to 398 nm which is attributed to the increase of crystal field effect.8
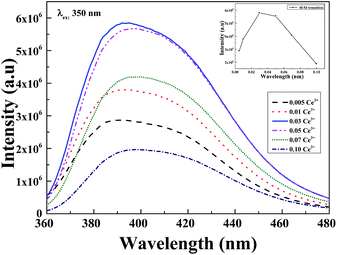 | ||
| Fig. 4 PL of Li6Lu1−x(BO3)3:xCe3+ (x = 0.5, 1, 3, 5, 7 and 10 mol%) excited at 350 nm. Inset: PL intensity of Li6Lu(BO3)3:Ce3+ as a function of Ce3+ concentration. | ||
Photoluminescence properties of Li6Lu1−y(BO3)3:yTb3+
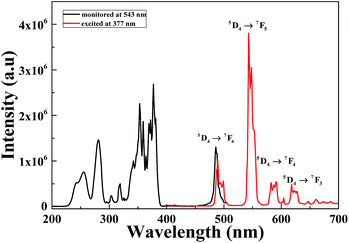
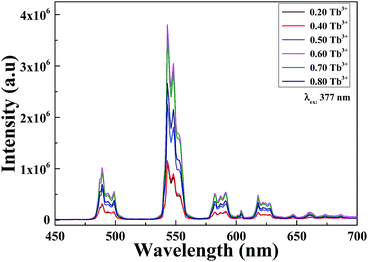
The ground state for Tb3+ ions with 4f8 configuration is 7FJ. When Tb3+ is excited it is promoted to the 5d shell which generates two 4f75d1 excitation states, a high spin state with 9DJ configurations or a low spin state with 7DJ configurations. According to Hund's rule, 9DJ levels have lower energy; as a result the transitions from 7FJ → 9DJ are spin–forbidden while 7FJ → 7DJ transitions are spin-allowed.23 Fig. 5 shows the PL/PLE of Li6Lu1−y(BO3)3:yTb3+. The absorption spectrum monitored at 543 nm is comprised of narrow peaks from 200–275 nm attributed to the spin allowed 4f8 → 4f75d1 transition and sharp peaks from 300–400 nm located at 281, 303, 319, 342, 354, 360 and 377 nm due to the forbidden 4f–4f transitions of Tb3+ ions from 7F6, to 5IJ, 5HJ, 5D0,1, 5G2,3,4, 5D2, 5L10, and 5D3 levels, respectively.8 The highest peak is centered at 377 nm indicating that the phosphor can be efficiently excited by n-UV chips. Tb3+ can be an activator for blue and green phosphors. At lower concentration, it emits blue color on the other hand, at higher concentrations, it exhibits green emission. When the sample is excited at 377 nm, the emission spectrum exhibits four sharp peaks located at 489 nm, 543 nm, 591 nm and 618 nm which are assigned to the 5D4 → 7FJ (J = 6, 5, 4 and 3) ascribed to the characteristic transition of Tb3+, respectively. The phosphor exhibits green emitting hue due to the maximum peak at 543 nm corresponding to 5D4 → 7F5 transition that is due to magnetic dipole transition.Different concentrations of Li6Lu1−y(BO3)3:yTb3+ (y = 0.20–0.80 mol) were synthesized and its corresponding emission intensities are illustrated in Fig. 6. The luminescence intensity of samples increased gradually as the concentration of Tb3+ ions increased. It reached maximum intensity at 60 mol% and began to decrease. This phenomenon is a result of the concentration quenching of the Tb3+ ions. 5D3 → 5D4 is resonant with 7F6 → 7F0 transition therefore, the emission due to 5D3 → 7FJ transitions are often quenched at high Tb3+ content because of the cross relaxation 5D3 + 7F6 → 5D4 + 7F0.1,9 The concentration quenching is higher than most Tb3+ doped phosphors. A possible reason is linked to the structure of Li6Lu(BO3)3 which the zigzag structure of the activator ion restrict the energy migration to one dimension. Therefore, the probability of the migrating excitation to encounter the randomly distributed killer site is lessened.10,12,17
Photoluminescence properties of Li6Lu0.97−y(BO3)3:0.03Ce3+, yTb3+
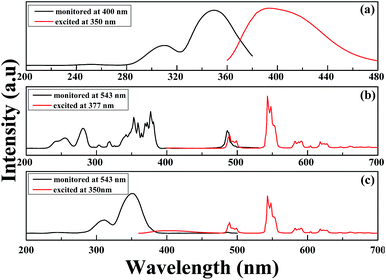
The 5d–4f transition of Ce3+ is electric dipole allowed and is evidently stronger compared to the 4f–4f intra-configurational transition of Tb3+. Fig. 7(a)–(c) depict the PL/PLE comparison of singly doped Ce3+, Tb3+ and Ce3+–Tb3+ co-doped Li6Lu(BO3)3 phosphor. It is evident that there is a spectral overlap between the emission spectrum of Ce3+ in Fig. 7(a) and excitation spectrum of Tb3+ in Fig. 7(b) which implies that energy transfer between Ce3+ and Tb3+ is expected in Li6Lu(BO3)3 host. In Fig. 7(c), there is an obvious overlap between the emission and excitation spectra of Ce3+–Tb3+ co-doping that verifies that the energy absorbed by Ce3+ is efficiently transferred to Tb3+ thus, Ce3+ is an efficient sensitizer for Tb3+. Furthermore, there is a broad absorption band at UV region attributed to Ce3+ which makes it suitable to be excited by n-UV LED chip.Energy transfer between sensitizer and activator enhances the emission intensity. Fig. 8 illustrates the investigation of series of phosphors co-doped with 3 mol% of Ce3+ and varying concentrations of Tb3+ (y = 20–80 mol%) excited at 350 nm. The broad band situated from 360–450 nm is ascribed to the 5d–4f transition of Ce3+ ions while the narrow peaks 475–650 nm are assigned to the 5D4 → 7FJ (J = 6, 5, 4 and 3) transitions of Tb3+ with maximum peak at 543 nm emitting a green color. The PL intensity initially increased as the concentration of Tb3+ increased until it reached its optimum concentration at x = 0.03, y = 0.65. As the Tb3+ concentration further increased, the emission intensity decreased as a result of concentration quenching. Conversely, the intensity of Ce3+ is inversely proportional to the concentration of Tb3+. These results denote that an effective energy transfer occurred. Moreover, comparing the PL of Fig. 8 with Fig. 6, it is highly evident that the intensity of Ce3+–Tb3+ co-doping is higher than singly doped Tb3+ proving that Ce3+ is an efficient sensitizer.
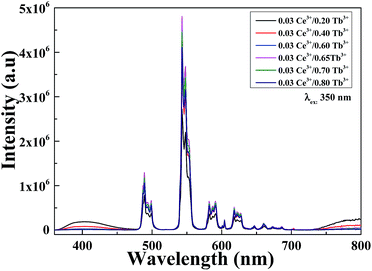 | ||
| Fig. 8 PL of Li6Lu(BO3)3:0.03Ce3+, yTb3+ (y = 20, 40, 60, 65, 70 and 80 mol%) excited at 350 nm and monitored at 543 nm. | ||
Schematic diagram of energy transfer
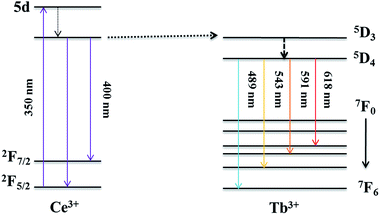
The energy levels and energy transfer mechanism are illustrated in the schematic diagram in Fig. 9. When excited at 350 nm, Ce3+ ions are excited to the 5d configuration then the ions relax non-radiatively to the lowest of 5d state. The excited ions return to its ground state at 2F5/2 and 2F7/2 levels with a consequent broad band emission. As a consequence of the matched energy levels of Ce3+ and Tb3+, the sensitizer (Ce3+) can transfer its energy to the activator (Tb3+) thence causing Tb3+ ions to excite from its ground state. Tb3+ ions relax at level 5D3 with subsequent 5D3 → 7FJ transitions. Cross-relaxation might occur between 5D3 and 5D4 simultaneously with increasing amount of Tb3+ generating stronger emissions and higher intensities at 5D4 → 7FJ transitions while leading to a decrease in 5D3 emission. Finally, the excited Tb3+ ions return to its ground state with a subsequent emission of green luminescence.1,6Ce3+ → Tb3+ energy transfer
In order to further analyze the energy transfer between Ce3+ and Tb3+, Fig. 10 presents the energy transfer efficiency of Ce3+ and Tb3+, 4f–5d transition of Ce3+ and 5D4 → 7F5 transition of Tb3+ all as a function of Tb3+ concentration in Li6Lu(BO3)3 phosphor excited at 350 nm. The energy transfer efficiency (ηET) can be calculated using following equation:1,6,8,9
 | (1) |
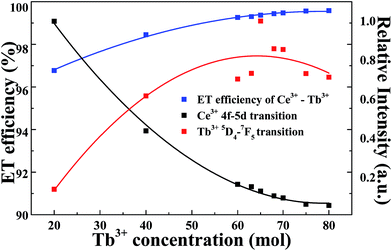 | ||
| Fig. 10 Dependence of Ce3+ emission (4f → 5d), Tb3+ emission (5D4 → 7F5) and energy transfer efficiency as a function of Tb3+. | ||
Besides from spectral overlap, efficient energy transfer involves strong interactions. It may transpire under radiative transfer through photons which is nearly distance independent and non-radiative transfer which is associated with the resonance between the donor and acceptor. It can be either exchange interaction or multipolar interaction.24,25 To calculate the critical distance (Rc) between Ce3+ ions and Tb3+ ions, the following equation is used:9,10,24
 | (2) |
 | (3) |
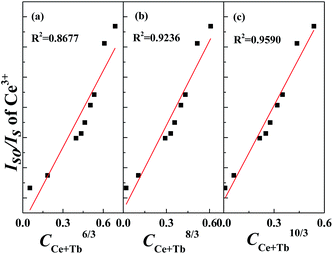
In order to further comprehend the energy transfer mechanism between Ce3+ and Tb3+ ions, Fig. 11(a)–(c) illustrate the relationships of IS0/IS and Cn/3. Among these three, Fig. 10(c) demonstrates the most commendable linear relationship. Therefore, it signifies that the energy transfer mechanism between Ce3+ and Tb3+ in Li6Lu(BO3)3 host is governed by quadrupole–quadrupole interaction.
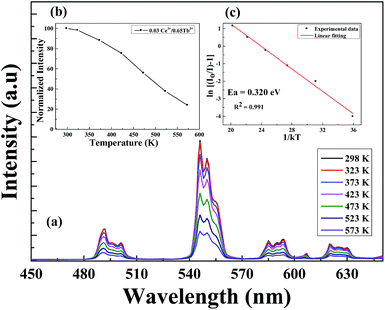
Aside from high luminescence, another crucial property of LED phosphors is thermal stability predominantly for high power LEDs in which the operating temperature can reach up to 450 K.12 Fig. 12(a) depicts the temperature dependence of the luminescence intensity of Li6Lu(BO3)3:0.03Ce3+, 0.65Tb3+ excited at 350 nm in the temperature range of 298 K to 573 K. The maximum peak is constantly located at 543 nm even at higher temperature. The emission intensity progressively decreased as the temperature increased due to thermal quenching. Fig. 12(b) presents the normalized intensity of the thermal luminescence. At 373 K, the thermal luminescence is reduced by almost 12%, at 473 K the intensity is decreased to 50% and at 573 K, the thermal luminescence is reduced by approximately 76%.
To promote better understanding of the relationship between the temperature and luminescence intensity and to determine the activation energy for thermal quenching, the gathered data were fitted to the Arrhenius equation:12,14
 | (4) |
CIE coordinates of Li6Lu0.97(BO3)3:0.03Ce3+ and Li6Lu0.97−y(BO3)3:0.03Ce3+, yTb3+ phosphors
Commission International de I'Eclairage (CIE) chromaticity coordinates of the samples are presented in Fig. 13 and summarized in Table 1. The CIE coordinates illustrate that with increasing Tb3+ concentration, the chromaticity is tuned from blue to green as a result of the cross-relaxation between 5D3 level and 5D4 level. Table 1 also shows the relative intensity of 5D4 → 7F5 transition and it indicates that the influence of energy transfer between Ce3+ and Tb3+ has significantly improved the luminescence properties of the phosphor. At 350 nm, the relative intensity of Li6Lu(BO3)3:0.03Ce3+, 0.65Tb3+ was enhanced by 178%. It is also noticeable that Li6Lu0.97(BO3)3:0.03Ce3+ has high color purity.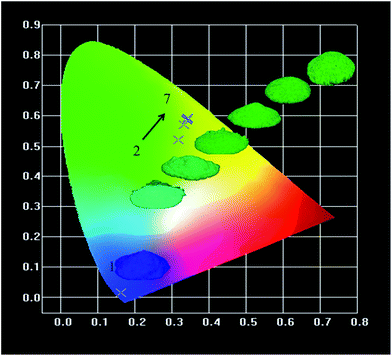 | ||
| Fig. 13 CIE coordinates of Li6Lu0.97(BO3)3:0.03Ce3+ and Li6Lu0.97−y(BO3)3:0.03Ce3+, yTb3+ (y = 0.20 to 0.75) phosphors under 350 nm excitation. | ||
| Phosphors | Excitation wavelength (nm) | CIE chromaticity coordinates | 5D4 → 7F5 Relative intensity | |
|---|---|---|---|---|
| x | y | |||
| 1. Li6Lu0.97(BO3)3:0.03Ce3+ | 350 | 0.162 | 0.015 | 0 |
| 2. Li6Lu0.77(BO3)3:0.03Ce3+,0.20Tb3+ | 350 | 0.317 | 0.519 | 1.00 |
| 3. Li6Lu0.57(BO3)3:0.03Ce3+,0.40Tb3+ | 350 | 0.334 | 0.570 | 1.43 |
| 4. Li6Lu0.37(BO3)3:0.03Ce3+,0.60Tb3+ | 350 | 0.340 | 0.586 | 1.50 |
| 5. Li6Lu0.32(BO3)3:0.03Ce3+,0.65Tb3+ | 350 | 0.340 | 0.588 | 1.78 |
| 6. Li6Lu0.27(BO3)3:0.03Ce3+,0.70Tb3+ | 350 | 0.342 | 0.589 | 1.64 |
| 7. Li6Lu0.22(BO3)3:0.03Ce3+,0.75Tb3+ | 350 | 0.342 | 0.593 | 1.53 |
Conclusions
A series of tunable blue to green emitting Li6Lu0.97−y(BO3)3:0.03Ce3+, yTb3+ phosphors were successfully synthesized via conventional solid state reaction. Pure phased samples were successfully obtained even at high Tb3+ doping concentration. The energy absorbed by Ce3+ ions were efficiently transferred to Tb3+ since the 5d energy level of Ce3+ ions is close to the 5D3 level of Tb3+ ions resulting in improved photoluminescence properties of the phosphors. The gathered results indicate that Ce3+ is an efficient sensitizer for Tb3+. The energy transfer is governed by a resonant type quadrupole–quadrupole interaction and the energy transfer critical distance is calculated to be 8.12 Å. The high activation energy denotes high thermal stability of the phosphor. The color of Li6Lu(BO3)3:Ce3+, Tb3+ phosphor can be modified from blue to green under UV radiation and shows a great potential for W-LED applications.Acknowledgements
This research is supported by the National Science Council of Taiwan under contract numbers: 102-2221-E-033-050-MY2 and 102-3011-P-033-003.Notes and references
- Y. Jin, Y. Hu, X. Wang, Z. Mu, G. Ju and Z. Yang, Phys. B, 2014, 436, 105–110 CrossRef CAS PubMed
.
- W. R. Liu, C. H. Huang, C. P. Wu, Y. C. Chiu, Y. T. Yeh and T. M. Chen, J. Mater. Chem., 2011, 21, 6869–6874 RSC
.
- C. Guo, X. Ding, H. J. Seo, Z. Ren and J. Bai, J. Alloys Compd., 2011, 509, 4871–4874 CrossRef CAS PubMed
.
- P. L. Lin, Z. P. Yang, Z. J. Wang and Q. L. Guo, Chin. Phys. Lett., 2007, 24, 2977–2979 CrossRef
.
- M. Yang, L. Liu and F. Chen, Mater. Lett., 2012, 88, 116–118 CrossRef CAS PubMed
.
- X. Fu, L. Fang, S. Niu and H. Zhang, J. Lumin., 2013, 142, 163–166 CrossRef CAS PubMed
.
- Y. Zhang, L. Wu, M. Ji, B. Wang, Y. Kong and J. Xu, Opt. Mater. Express, 2012, 2, 92–102 CrossRef CAS
.
- J. Zheng, C. Guo, X. Ding, Z. Ren and J. Bai, Curr. Appl. Phys., 2012, 12, 643–647 CrossRef PubMed
.
- J. Sun, Y. Sun, J. Lai, Z. Xia and H. Du, J. Lumin., 2012, 132, 3048–3052 CrossRef CAS PubMed
.
- H. Yu, W. Zi, S. Lan, S. Gan, H. Zou, X. Xu and G. Hong, Opt. Laser Technol., 2012, 44, 2306–2311 CrossRef CAS PubMed
.
- Q. Wang, D. Deng, Y. Hua, L. Huang, H. Wang, S. Zhao, G. Jia, C. Li and S. Xu, J. Lumin., 2012, 132, 434–438 CrossRef CAS PubMed
.
- F. Zhang, Y. Wang and Y. Tao, J. Lumin., 2013, 136, 51–56 CrossRef CAS PubMed
.
- L. H. Jiang, Y. L. Zhang, C. Y. Li, R. Pang, J. Q. Hao and Q. Su, J. Lumin., 2008, 128, 1904–1908 CrossRef CAS PubMed
.
- H. Lin, H. Liang, Z. Tian, B. Han, J. Wang, Q. Su and G. Zhang, J. Phys. D: Appl. Phys., 2009, 42, 1–9 Search PubMed
.
- A. A. Reddy, S. Das, A. Goel, R. Sen, R. Siegel, L. Mafra, G. V. Prakash and J. M. F. Ferreira, AIP Adv., 2013, 3, 1–15 Search PubMed
.
- F. Yang, S. K. Pan, D. Z. Ding, X. F. Chen, H. Feng and G. H. Ren, J. Cryst. Growth, 2010, 312, 2411–2414 CrossRef CAS PubMed
.
- G. Ju, Y. Hu, H. Wu, Z. Yang, C. Fu, Z. Mu and F. Kang, Opt. Mater., 2011, 33, 1297–1301 CrossRef CAS PubMed
.
- F. Zhang, Y. Wang and Y. Tao, Phys. Procedia, 2012, 29, 55–61 CrossRef CAS PubMed
.
- H. Nishimura, S. Hosoya, H. Takashima and Y. Kanno, Jpn. J. Appl. Phys., 2006, 45, 909–911 CrossRef CAS
.
- U. Fawad, M. Oh, H. Park and H. J. Kim, J. Korean Phys. Soc., 2013, 62, 1102–1107 CrossRef CAS
.
- Y. Yang, A. Bao, H. Lai, Y. Tao and H. Yang, J. Phys. Chem. Solids, 2009, 70, 1317–1321 CrossRef CAS PubMed
.
- U. Manik, S. C. Gedam and S. J. Dhoble, J. Lumin., 2013, 136, 191–195 CrossRef CAS PubMed
.
- B. V. Rao, Y. T. Nien, W. S. Hwang and I. G. Chen, J. Electrochem. Soc., 2009, 156, J338–J341 CrossRef CAS PubMed
.
- I. V. B. Maggay, P. C. Lin and W. R. Liu, J. Solid State Lighting, 2014, 1, 1–15 CrossRef
.
- G. Ju, Y. Hu, L. Chen, X. Wang, Z. Mu, H. Wu and F. Kang, J. Electrochem. Soc., 2011, 158, J294–J299 CrossRef CAS PubMed
.
- J. Sun, J. Lai, J. Zhu, Z. Xia and H. Du, Ceram. Int., 2012, 38, 5341–5345 CrossRef CAS PubMed
.
- J. Sun, Z. Lian, G. Shen and D. Shen, RSC Adv., 2013, 40, 18395–18405 RSC
.
| This journal is © The Royal Society of Chemistry 2015 |

