A facile method to enhance ferroelectric properties in PVDF nanocomposites

Mohammad Mahdi Abolhasani*a, Fatemeh Zarejousheghania, Zhenxiang Chengb and Minoo Naebe*c
aChemical Engineering Department, University of Kashan, Kashan, Iran. E-mail: abolhasani@kashanu.ac.ir
bInstitute for Superconducting & Electronic Materials, University of Wollongong, NSW 2500, Australia
cInstitute for Frontier Materials, Deakin University, VIC 3216, Australia. E-mail: minoo.naebe@deakin.edu.au

Received 11th October 2014 , Accepted 11th February 2015

First published on 12th February 2015


Abstract

Poly(vinylidene fluoride) (PVDF)/nanoclay composites were prepared using melt compounding. The effect of acrylic rubber (ACM) as a compatibilizer on different polymorph formation and on the ferroelectric properties of nanocomposites were investigated. The intercalation and morphological structure of the samples were studied using X-ray diffraction (XRD) and transmission electron microscopy (TEM). The infrared spectroscopy and X-ray analysis revealed the coexistence of β and γ crystalline forms in PVDF–clay nanocomposite, while in partially miscible PVDF/ACM/clay hybrids, three polymorphs of α, β and γ coexisted. The coefficients of electric field–polarization (EP) Taylor expansion were calculated based on the Lorentz theory. Using a genetic algorithm, complex dielectric susceptibilities as well as the dielectric constants for each sample were calculated and optimized. The predicted dielectric constants were found to be in good agreement with the experimental results. A dielectric constant of 16 (10 Hz) was obtained for PVDF/ACM/clay (90/10/5), which was 40% higher than that of the PVDF–clay (100/5) nanocomposite without ACM. The improved dielectric performance of the nanocomposites can be attributed to the compatibilizing effect of ACM, which facilitated the growth of β polymorph in the sample.

Introduction

In the last decade, ferroelectric materials have received considerable attention due to their industrial applications, such as nonvolatile memory and transducers in sensors and actuators, electrostriction, electric energy storage, electrocaloric cooling, fuel injectors for high efficiency-low emission diesel engines, and ultrasonic rotary inchworm motors with high power and torque densities.1–5

Ferroelectric materials are mainly divided into two groups: ceramics and polymer ferroelectrics. Ceramic ferroelectrics show highly desirable properties; however, they are brittle and considerably heavy. The ferroelectric polymers are light, flexible, easy to process and low cost; nevertheless, their polar properties are an order of magnitude weaker.1,6 Among polymers, PVDF and its copolymers are the most well-known and widely used family of polymer ferroelectrics with significant ferroelectric properties mainly due to their β polymorph.

PVDF as a polymorphous crystallizable polymer has at least five crystal polymorphs, i.e., α, β, γ, ε and δ. However, only the β and γ crystalline phases with trans conformation have a dipole moment in crystalline phase. Thus, the β and γ crystalline phases are the most important and attractive phases among others with outstanding electric properties.7–10 Nevertheless, when polarizability is studied, β polymorph plays a more significant role; therefore, many efforts have been made to induce the formation of this polymorph type to take the full advantage of the ferroelectric properties that PVDF has to offer.

Various methods have been proposed and implemented11–14 to increase the β phase content of PVDF films; however, high temperature mechanical stretching and high voltage poling are proved to be efficient and practical.15–17

Nanoparticles have been used since a long time in polymer matrices to improve mechanical, thermal and electrical properties. The performance of polymer based nanocomposites depends on the distribution and dispersion of nanoparticles within the matrix as well as the strength of the interfacial bonding between nanoparticles and polymer matrix.18 It has been shown that employing block or graft copolymers as compatibilizing agents in nanocomposites can improve the interaction between polymer matrix and inorganic nano particles.19

Carbon-based nanoparticles have shown to enhance the ferroelectric and dielectric properties of polymers. Kim et al.17 used multiwalled carbon nanotubes (MWCNTs) to improve the piezo- and ferroelectric properties of PVDF matrix. Shang et al.20 used layered graphene nanosheets in PVDF polymer matrix and reported a high dielectric constant of 63 (100 Hz) upon the addition of 1.27 vol% of graphene, which was 9 times higher than that of pure PVDF. Yu et al.21 also studied graphene based nanocomposites and found that with a percolation threshold of 4.5 wt%, a dielectric constant of 40 (100 Hz) was obtained. Ma et al.22 studied the crystalline structure of polymer blends and revealed that PMMA can increase the β phase content of PVDF, whereas Li et al.23 further investigated PVDF/PMMA ferroelectric properties and reported 4 μC m−2 of Pr for a blend of PVDF with 20 wt% PMMA. Moussaif et al.24 reported that a small amount of PMMA can act as a compatibilizer, and it can enhance the affinity of PVDF to organosilicate particles. However, in this study, no results were provided for the effect of PMMA on the crystalline structure of PVDF matrix.

Lately, it has been reported that the addition of clay platelets into PVDF polymer matrix induces a polar crystalline phase.12,25–30 Priya and Jog25–27 reported the effectiveness of organically modified montmorillonite for the induction of β polymorph formation in PVDF films. Peng et al.31 reported the nucleation of a β polymorph with the addition of 1–2 wt% clay; however, the nanocomposite containing 5 wt% nanoclay exhibited reduced crystallinity. Shukla et al.32 showed changes in the dielectric constants as a result of frequency changes at room temperature for pure PVDF and PVDF nanocomposites containing 10 wt% clay. At low frequencies, the dielectric constants of PVDF–clay nanocomposites were lower than for pure PVDF; however, at 100 Hz this trend was reverse.

In the present study, we have used an inorganic nanofiller (clay) and a rubbery polymer (ACM) as a compatibilizer to prepare ferroelectric PVDF films. We have shown that the enhanced ferroelectric properties can be obtained in a simple fashion and with no further post-treatments such as high temperature stretching. A correlation was found between the improved ferroelectric properties and the growth of β phase content in PVDF nanocomposites containing ACM compatibilizer. To the best of our knowledge, it is the first time that the effect of the intercalation of layered inorganic nano-fillers on the ferroelectric properties of PVDF is studied.

To investigate the ferroelectric properties of PVDF–clay nanocomposites, the PE hysteresis loops of nanocomposites, which are indicative of polarizability, were first compared. The EP Taylor expansion was then modeled using the Lorentz theory. Finally, using the new generated equation, linear susceptibility or dielectric constant, as well as the nonlinear optical values were calculated.

Theory of ferroelectricity

There are two main theories to study the ferroelectric properties of materials, namely, the Landau–Devonshire theory33 and the Landau–Khalatnikov theory.34 The Landau–Khalatnikov theory is a dynamical version of the Landau–Devonshire one, using which the PE hysteresis loop could be regenerated.

According to the Landau–Devonshire theory, free energy, G, could be determined based on a few variables, including temperature (T), electric field (E), polarization (P), stress (s), and strain (e).

In the absence of mechanical stress, free energy would be described as follows:

 
G = f(Px, Py, Pz, E, T) (1)
where Px, Py, and Pz are the components of the polarization, T is the temperature and E is the external electric field.

Assuming that for a uniaxial ferroelectric the free energy of unpolarized crystals is equal to zero,35–37 the free energy, G, of polarized crystals could be written as follows:

 
image file: c4ra12221f-t1.tif(2)

For all known ferroelectrics, the coefficient α is a function of temperature; note that at below Curie temperature this coefficient is negative. The δ parameter is positive, while γ depends on the type of transition (it is negative for first-order transitions and positive for second-order transitions).

In equilibrium thermodynamic condition at constant temperature, when image file: c4ra12221f-t2.tif, eqn (2) can be rewritten as follows:

 
E = αP + γP3 + δP5 + … (3)

Furthermore, for uniaxial ferroelectric, general relation between polarization, P, and applied electric field, E, has been given as a Taylor expansion38–41 as follows:

 
P = a1E + a2E2 + a3E3 + … (4)
where a1, a2 and a3 are the first, second, and third derivatives of the Taylor expansion. In eqn (4), a1 = ε0χ, where χ or χ(1) is the linear susceptibility and dimensionless physical property; a2 = ε0χ(2) and a3 = ε0χ(3), where χ(2) and χ(3) are the first and second hyper-susceptibilities (sometimes referred to optical susceptibilities).39 In general, the complex dielectric susceptibilities, χ(n), are related to the microscopic (electronic and nuclear) structure of material38 and are a function of the frequency of the applied electric field. Linear dielectric susceptibility is generally considerably larger than nonlinear coefficients, namely, χ(2) and χ(3). For dielectric crystals, semiconductors, and organic materials used in photonics application, χ(2) are in the range of 10−13–10−10 (m V−1); and for glasses, crystals, semiconductors, semiconductor-doped glasses, and organic materials involved in photonics, χ(3) are in the vicinity of 10−23–10−16 (cm2 V−2).40

The Lorentz classical theory is based on the classical theory of interaction between light and matter, and it is used to describe the frequency dependent polarization due to bound charge. The bindings between electrons and nucleus are supposed to be similar to the that of a mass–spring system.42 The linear susceptibility χ(ω) can be deduced from the Lorentz theory as follows:

 
image file: c4ra12221f-t3.tif(5)
where ωp is plasma frequency, ω0 is resonant frequency and Γ is the damping factor. Based on eqn (5), we can represent the real and the imaginary part of the dielectric constant (εr = ε′ − ′′) as follows:
 
image file: c4ra12221f-t4.tif(6)
 
image file: c4ra12221f-t5.tif(7)

Experiments

Materials and methods

PVDF (Kynar 710) with a melting flow rate of 25 g/10 min (2328C/12.5 kg load) from Arkema and acrylic rubber (Grade AR71) from Zeon Advanced Polymix Co. (Thailand) were used in this work. The major component of the acrylic rubber was poly(ethyl acrylate) (PEA), which contains a minor amount (5 wt%) of chlorine cure-site monomer. Organically modified clay Cloisite 30B with a cation exchange capacity of 90 meq/100 g was supplied by Southern Clay. All the components were dried in a vacuum oven at 80 °C for at least 12 h before processing. The clay content in composite samples was 5 wt%. Hereafter, in this manuscript, we use NPVDF, NACM, NPVDF/5ACM and NPVDF/10ACM nomenclature for PVDF nanocomposite, ACM nanocomposite and PVDF nanocomposite with 5% and 10% ACM as compatibilizer, respectively. All the samples were prepared using a Brabender internal mixer at a rotation speed of 100 rpm at 190 °C for 10 min. Samples were hot pressed at 200 °C to a thin film and allowed to slowly cool down to room temperature.

Characterization

To investigate the level of clay layers dispersion, Molau test was done by adding 1 gram of PVDF–clay samples in 10 ml N,N-dimethylformamide (DMF). The mixture was shaken vigorously at 50 °C and then left at room temperature for one month to observe the turbidity of the solutions.

Fourier transform infrared spectroscopy (FTIR) was carried out using a Bruker 70 equipped with ATR unit. FTIR spectra were acquired (64 scans at 4 cm−1 resolution) from 500 cm−1 to 1500 cm−1.

X-ray diffraction measurements were performed on a Panalytical XRD instrument. The data were recorded in the 2θ range of 2–10°. Samples were scanned continuously with a 0.5° scan step and 1 s scan time.

The composite samples were sectioned using a Leica UC6 ultramicrotome with FC6 cryochamber at −120 °C at a nominal thickness of 70 to 80 nm. Sections were imaged using a Gatan Orius SC1000 digital camera on a JEOL 2100 transmission electron microscope (TEM) operating at an accelerating voltage of 200 kV.

Ferroelectric hysteresis loops were measured at ambient temperature with a continuous triangular wave signal electric field at a frequency in the range of 5 to 100 Hz and an amplitude up to 30 MV m−1. A plot for electric polarization versus electric field was obtained using an Easy Check 300 (aixACCT Systems GmbH, Germany) equipped with Trek 610E high voltage amplifier T source for measurements at room temperature.

Results and discussion

FTIR analysis

In our earlier work, we showed43–48 that the neat PVDF and PVDF/ACM blends formed an α polymorph, while PVDF–clay nanocomposites induce both β and γ polymorphs. In this work, our aim is to explore the compatibilizing effect of ACM on the ferroelectric polymorph formation of PVDF in the presence of nanoclay. Fig. 1a displays the FTIR spectra of the neat PVDF, NPVDF, NPVDF/5ACM and NPVDF/10ACM samples. The frequencies and the vibrational assignments for α, β and γ phases are 763, 811 and 839 cm−1, respectively.44 Neat PVDF shows only an α phase characteristic peak, while the NPVDF sample showed both β and γ phase peaks. However, for the NPVDF/ACM sample, all three polymorphs peaks were observable. This observation demonstrates that the presence of nanoclay hindered the formation of α polymorph in the NPVDF sample, while the compatibilizing effect of ACM induced α phase formation. The formation of β and γ polymorphs in NPVDF composites can be attributed to the similar crystal lattices between clay and these polymorphs,25 the presence of an ion–dipole interaction between nanoclay layers and PVDF chains in molten state12 or different velocity regimes present in the nanocomposite.47
image file: c4ra12221f-f1.tif
Fig. 1 (a) FTIR spectrum, (b) WAXD profile of the prepared samples.

To further explain the results, the change of α, β and γ phase contents for NPVDF, NPVDF/5ACM and NPVDF/10ACM samples are compared in Table 1. The peak at 1072 cm−1 is selected as a reference band because this band is well-known to be proportional only to the sample thickness, regardless of the crystalline modification of PVDF.46 The ratio of the FTIR absorbance of 763 cm−1 (α polymorph), 839 cm−1 (β polymorph) and 811 cm−1 (γ polymorph) with respect to the reference band are used to calculate the percentage of α, β and γ polymorphs, as shown in Table 1. Because the absorption peak at 1234 cm−1 is solely for γ polymorph, it can be employed for quantitative analysis. However, when this peak is detected as a shoulder, the content of γ polymorph cannot be calculated quantitatively because it is difficult to separate this peak from the overlapped peaks of the two other crystalline polymorphs, namely, α and β, at 1214 and 1276 cm−1, respectively. Therefore, a very small but discernible shoulder at 811 cm−1 is designated to show the change in the γ polymorph content in the resultant samples. As seen in Table 1, the addition of ACM as a compatibilizer increased the β phase content from 17% in NPVDF to 21% and 30% in NPVDF/5ACM and NPVDF/10ACM samples, respectively. The high amount of γ phase in NPVDF is related to the molecular chains that have had enough time to form gauche defect at high temperatures or crystallization within rose regime.47 However, decreasing the γ phase content and increasing the β polymorph by the addition of compatibilizer can be related to better dispersion of clay in the presence of ACM, which can result in the enhanced nucleation of β polymorph in NPVDF/5ACM and NPVDF/10ACM samples as compared to NPVDF nanocomposites. Thus, in NPVDF/ACM sample, the nucleation of β polymorph is facilitated. Moreover, the nucleation of α phase is related to the nucleus that formed independent of nanoclays due to the hindrance effect of ACM. We recently reported this phenomenon for a PVDF/ACM/clay hybrid with more than 70 wt% ACM content.37,42 Note that in this work, all the composite samples were hot pressed and slowly cooled down to room temperature, and the increase in the β phase content was simply achieved by the addition of a compatibilizer. Obtaining even larger β phase content is possible by isothermal crystallization and stretching at high temperatures, which is the subject of our next paper. In the following section, we will show that the increase in the electroactive β polymorph leads to the improved ferroelectric properties of NPVDF/5ACM and NPVDF/5ACM samples compared to NPVDF nanocomposites. However, pure PVDF showed solely α polymorph; therefore, its ferroelectric properties were not investigated in this study.

Table 1 Quantitative analysis of the percentage of crystallinity and different polymorphs
Sample Crystallinity α β γ
PVDF 51% 45% 4% 2%
NPVDF 46% 3% 15% 28%
NPVDF/5ACM 47% 6% 14% 21%
NPVDF/10ACM 46% 11% 30% 5%


Morphology and clay dispersion

Fig. 1b presents the WAXD patterns of Cloisite 30B, NPVDF, NACM, NPVDF/5ACM and NPVDF/10ACM samples. The Cloisite 30B has a d-spacing of 1.8 nm, evidenced by the XRD peak at 2θ = ∼4.8°. In the NPVDF containing 5 wt% clay, this peak is shifted towards the left (lower frequencies), resulting in a diffused peak at 2θ = ∼2.5°, corresponding to the d-spacing of 3.4 nm. This suggests that the PVDF has penetrated into the gallery region and formed an intercalated structure with an increase in the clay interlayer space. This type of structure is formed due to the interaction between the modified clay and PVDF or shear induced intercalation. The peak at 2θ = ∼5.8° corresponding to the d-spacing 1.4 nm is due to the second order diffraction d(002).45 The appearance of this peak could be attributed to a partially collapsed structure resulting from quaternary ammonium degradation. NACM, NPVDF/5ACM and NPVDF/10ACM samples showed a different behavior, these samples had two small peaks at 2θ = ∼2° corresponding to the d-spacing of 4.2 nm and a broad peak at around 2θ = ∼5°, which is almost the same as the neat Cloisite 30B peak. However, the relative intensity of the peak reduced significantly, which suggests that the clay is exfoliated but a small fraction of the clay layers remains as local aggregates in the ACM nanocomposites.

TEM images for NPVDF, NACM, NPVDF/5ACM and NPVDF/10ACM samples are shown in Fig. 2. TEM images of NPVDF clearly show clay tactoids, which have a thickness of ∼150 nm as a result of the high interfacial tension between PVDF and Cloisite 30B. From the TEM images, it can be seen that the NPVDF sample failed to form an exfoliated structure. In sharp contrast, NACM, NPVDF/5ACM and NPVDF/10ACM samples showed individual layers as well as stacks containing layers oriented in parallel with various degree of intercalation. The compatibilizing effect of ACM chains are enhanced by the strong polar interaction developed between the oxygen groups of the silicate and the oxygen groups of ACM. Therefore, ACM acts as a compatibilizer and increases the intercalation of nanoclay in PVDF.


image file: c4ra12221f-f2.tif
Fig. 2 TEM images of (a) NPVDF, (b) NACM, (c) NPVDF/5ACM and (d) NPVDF/10ACM.

Effects of ACM on the ferroelectric & dielectric properties of NPVDF nanocomposite

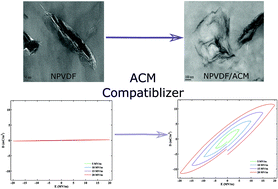
PE hysteresis loop & dielectric. As discussed earlier, a common method to observe ferroelectric polarization characteristic is via the hysteresis loop, which can be translated into the existence of β phase crystals in PVDF polymers. Fig. 3 shows the sequence of polarization for applied electric fields at 20 MV m−1 in different frequencies for NPVDF, NPVDF/5ACM and NPVDF/10ACM nanocomposites.
image file: c4ra12221f-f3.tif
Fig. 3 PE hysteresis loops for (a) NPVDF, (b) NPVDF/5ACM and (c) NPVDF/10ACM at the evaluated temperature in different frequencies, namely, 5 Hz, 10 Hz and 100 Hz.

In all the samples, increase in frequencies resulted in decrease in polarizations, suggesting that the increase in time of an applied electric field induced a more polarized dipole moment.

The comparison of NPVDF, NPVDF/5ACM and NPVDF/10ACM composites revealed that ACM increased the polarization up to 100-fold at the same frequency and electric field. This observation is associated to the crystal structure of PVDF, in which β polymorph nucleation increased in the presence of ACM. The addition of ACM would also affect the number of domains, a region of a ferroelectric material within which the spontaneous polarization is constant.

For all the samples, the polarization increased with decrease in the frequency from 100 to 5 Hz; however, this increase is more pronounced at higher frequencies. This phenomenon is independent of electric field, which confirms that change in electric field at constant frequency would not change the polarization mechanism; however, it would increase polarizability.

Note that decrease in frequency increased the area under the curve, which is associated to the dissipated energy. Therefore, the optimization of dielectric constant and dissipated energy has been an interesting subject of research for many years.1,49

For the determination of polarization mechanism, the real and imaginary parts of dielectric constant were obtained at the evaluated temperature for NPVDF, NPVDF/5ACM and NPVDF/10ACM nanocomposites, as shown in Fig. 4.


image file: c4ra12221f-f4.tif
Fig. 4 Frequency dependence for the real and imaginary components of the dielectric permittivity for NPVDF, NPVDF/5ACM and NPVDF/10ACM at the evaluated temperature.

For all the samples, according to the real part of dielectric constant, orientational (dipolar) and atomic polarization are seen below 100 Hz and at 1 MHz, respectively. When the dielectric constant increases, and based on the ACM effect, the increase in nucleation increases the reflex of dipolar polarization 40% faster than in samples without it, and it also decreases the dielectric loss.

Fig. 5–7 show temperature gradients of dielectric constants for all the samples. When the increases in the dielectric constants are compared with respect to temperature for all the samples, it is observed that ACM shifts Curie temperature to higher values.


image file: c4ra12221f-f5.tif
Fig. 5 Frequency dependence for the real and imaginary components of the dielectric permittivity for NPVDF at different temperatures.

image file: c4ra12221f-f6.tif
Fig. 6 Frequency dependence for the real and imaginary components of the dielectric permittivity for NPVDF/5ACM at different temperatures.

image file: c4ra12221f-f7.tif
Fig. 7 Frequency dependence for the real and imaginary components of the dielectric permittivity for NPVDF/10ACM at different temperatures.

Calculation of dielectric & nonlinear optical constants

To calculate the dielectric constant as well as the optical susceptibilities of nanocomposites (represented by eqn (4)), the Lorentz theory was used.

In the second step, using a genetic algorithm and a series of data, eqn (4) in combination with eqn (5)–(7) was optimized. Objective function, OF, is defined as follows:

 
OF = ∑(P − (a1E + a2E2 + a3E3))2 (8)

The results of optimization for NPVDF, NPVDF/5ACM and NPVDF/10ACM nanocomposites were calculated using the PE hysteresis data and are reported in Table 2. As can be seen, the addition of ACM as a compatibilizer in nanocomposite increased the dielectric constant of NPVDF/5ACM nanocomposite up to 30% compared to NPVDF and up to 33% for NPVDF/10ACM compared to NPVDF/5ACM. Note that this increase in the dielectric constant was obtained simply by the addition of ACM into the PVDF nanocomposite. However, we believe that further increases in the ferroelectric constant can be achieved using an optimum amount of clay, ACM, isothermal crystallization and high temperature stretching of the samples.

Table 2 Dielectric constant and the complex dielectric susceptibilities, χ(n), for NPVDF, NPVDF/5ACM and NPVDF/10ACM samples
Samples name Frequency (Hz) ε χ(2) (m V−1) χ(3) (cm2 V−2)
NPVDF 5 14.86 −1.650 × 10⁻¹¹ 2.112 × 10⁻¹⁸
NPVDF 10 13.15 −1.074 × 10⁻¹¹ 1.046 × 10⁻¹⁸
NPVDF 100 9.85 −5.580 × 10⁻¹² 4.372 × 10⁻¹⁹
NPVDF/5ACM 5 20.45 −3.596 × 10⁻¹⁰ 1.284 × 10⁻¹⁷
NPVDF/5ACM 10 16.47 −2.549 × 10⁻¹⁰ 7.170 × 10⁻¹⁸
NPVDF/5ACM 100 12.56 −8.206 × 10⁻¹¹ 3.231 × 10⁻¹⁸
NPVDF/10ACM 5 29.6 −1.627 × 10−09 3.752 × 10⁻¹⁷
NPVDF/10ACM 10 24.91 −1.402 × 10−09 3.016 × 10⁻¹⁷
NPVDF/10ACM 100 12.78 −5.305 × 10⁻¹⁰ 6.680 × 10⁻¹⁸


As mentioned above, the dependency of polarization on frequency varies from 100 to 5 Hz. This observation may be attributed to the ionic polarization or decrease in the dissipation factor, which arises in lower frequencies, i.e. 10 Hz.49 It is worth mentioning that PVDF nanocomposites containing ACM compatibilizer show larger optical susceptibilities compared to well-known commercial PVDF films (Table 2). Finally, the dielectric susceptibilities were obtained using the genetic algorithm optimization applied to the eqn (4).

Results (Table 2) are compared with experimental data (Fig. 4). This shows a good agreement between the theoretical and experimental data using the genetic algorithm along with information on PE hysteresis data.

Conclusion

In this study, the compatibilizing effect of ACM on various polymorph contents of PVDF was investigated. WAXD and TEM results proved that clay tactoids formed an intercalated structure in PVDF nanocomposite, while ACM compatibilized nanocomposites showed individual layers as well as stacks containing parallel and oriented layers with various degrees of intercalation. The FTIR analysis revealed the formation of β and γ polymorphs in NPVDF nanocomposite and α, β and γ polymorphs in both NPVDF/5ACM and NPVDF/10ACM samples. The investigation of ferroelectric properties of nanocomposites containing 5 and 10 wt% ACM showed 89% and 98% increases in polarization and 30% and 70% improvements in the dielectric constants, respectively, compared with samples without ACM. This is due to the enlargement of the β polymorph in the presence of ACM. The theoretical value of polarization calculated using an optimized coefficient was found to be in good agreement with the experimental results. A dielectric constant of 16 (100 Hz) was obtained for PVDF/10ACM/clay, which was 40% higher than that of the PVDF–clay nanocomposite. It is expected that employing mechanical and thermal processes, such as isothermal crystallization and high temperature drawing of nanocomposites, combined with optimum amounts of clay and ACM can significantly improve the ferroelectric properties of PVDF. This is the subject of our current research and will be reported in the future.

References

  1. L. Yang, X. Li, E. Allahyarov, P. L. Taylor, Q. M. Zhang and L. Zhu, Polymer, 2013, 54, 1709 CrossRef CAS PubMed.
  2. J. F. Scott, Science, 2007, 315, 954 CrossRef CAS PubMed.
  3. C. M. Landis, Curr. Opin. Solid State Mater. Sci., 2004, 8, 59 CrossRef CAS PubMed.
  4. P. Muralt, J. Micromech. Microeng., 2000, 10, 136 CrossRef CAS.
  5. K. Asadi, D. M. de Leeuw, B. de Boer and P. W. M. Blom, Nat. Mater., 2008, 7, 547 CrossRef CAS PubMed.
  6. J. Bernholc, S. M. Nakhmanson, M. B. Nardelli and V. Meunier, Comput. Sci. Eng., 2004, 6, 12 CrossRef CAS.
  7. J. Yang, J. Wang, Q. Zhang, F. Chen, H. Deng, K. Wang and Q. Fu, Polymer, 2011, 52, 4970 CrossRef CAS PubMed.
  8. G. Guerra, F. E. Karasz and W. J. MacKnight, Macromolecules, 1986, 19, 1935 CrossRef CAS.
  9. T. Hattori, M. Hikosaka and H. Ohigashi, Polymer, 1996, 37, 85 CrossRef CAS.
  10. R. Gregorio Jr and D. S. Borges, Polymer, 2008, 49, 4009 CrossRef PubMed.
  11. X. He and K. Yao, Appl. Phys. Lett., 2006, 89, 112909 CrossRef PubMed.
  12. D. Shah, P. Maiti, E. Gunn, D. F. Schmidt, D. D. Jiang, C. A. Batt and E. P. Giannelis, Adv. Mater., 2004, 16, 1173 CrossRef CAS.
  13. M. Benz and W. B. Euler, J. Appl. Polym. Sci., 2003, 89, 1093 CrossRef CAS.
  14. S. Yu, W. Zheng, W. Yu, Y. Zhang, Q. Jiang and Z. Zhao, Macromolecules, 2009, 42, 8870 CrossRef CAS.
  15. C.-h. Du, B.-K. Zhu and Y.-Y. Xu, J. Appl. Polym. Sci., 2007, 104, 2254 CrossRef CAS.
  16. P. Sajkiewicz, A. Wasiak and Z. Gocłowski, Eur. Polym. J., 1999, 35, 423 CrossRef CAS.
  17. G. H. Kim, S. M. Hong and Y. Seo, Phys. Chem. Chem. Phys., 2009, 11, 10506 RSC.
  18. M. Naebe, J. Wang, A. Amini, H. Khayyam, N. Hameed, L. H. Li, Y. Chen and B. Fox, Sci. Rep., 2014, 4, 4375 Search PubMed.
  19. E. P. Giannelis, Adv. Mater., 1996, 8, 29 CrossRef CAS.
  20. J. Shang, Y. Zhang, L. Yu, B. Shen, F. Lv and P. K. Chu, Mater. Chem. Phys., 2012, 134, 867 CrossRef CAS PubMed.
  21. Y. Jinhong, H. Xingyi, W. Chao and J. Pingkai, IEEE Trans. Dielectr. Electr. Insul., 2011, 18, 478 CrossRef.
  22. W. Ma, J. Zhang, X. Wang and S. Wang, Appl. Surf. Sci., 2007, 253, 8377 CrossRef CAS PubMed.
  23. M. Li, N. Stingelin, J. J. Michels, M.-J. Spijkman, K. Asadi, K. Feldman, P. W. M. Blom and D. M. de Leeuw, Macromolecules, 2012, 45, 7477 CrossRef CAS.
  24. N. Moussaif and G. Groeninckx, Polymer, 2003, 44, 7899 CrossRef CAS PubMed.
  25. L. Priya and J. P. Jog, J. Polym. Sci., Part B: Polym. Phys., 2002, 40, 1682 CrossRef CAS.
  26. L. Priya and J. P. Jog, J. Appl. Polym. Sci., 2003, 89, 2036 CrossRef CAS.
  27. L. Priya and J. P. Jog, J. Polym. Sci., Part B: Polym. Phys., 2003, 41, 31 CrossRef CAS.
  28. K. Asai, M. Okamoto and K. Tashiro, Polymer, 2008, 49, 4298 CrossRef CAS PubMed.
  29. K. Asai, M. Okamoto and K. Tashiro, Polymer, 2008, 49, 5186 CrossRef CAS PubMed.
  30. J. Buckley, P. Cebe, D. Cherdack, J. Crawford, B. S. Ince, M. Jenkins, J. Pan, M. Reveley, N. Washington and N. Wolchover, Polymer, 2006, 47, 2411 CrossRef CAS PubMed.
  31. Q.-Y. Peng, P.-H. Cong, X.-J. Liu, T.-X. Liu, S. Huang and T.-S. Li, Wear, 2009, 266, 713 CrossRef CAS PubMed.
  32. N. Shukla, A. Shukla, A. K. Thakur and R. N. P. Choudhary, Indian J. Eng. Mater. Sci., 2008, 15, 7 Search PubMed.
  33. P. Chandra and P. Littlewood, in Physics of Ferroelectrics, Springer, Berlin, Heidelberg, 2007, vol. 105, p. 69 Search PubMed.
  34. V. C. Lo, J. Appl. Phys., 2003, 94, 3353 CrossRef CAS PubMed.
  35. A. J. Dekker, Solid state physics, Prentice-Hall, 1965 Search PubMed.
  36. V. V. Kochervinskii, Russ. Chem. Rev., 1999, 68, 821 CrossRef CAS PubMed.
  37. A. Safari and E. K. Akdogan, Piezoelectric and Acoustic Materials for Transducer Applications, Springer, 2008 Search PubMed.
  38. C. Sinha and S. S. Bhattacharyya, Current Topics in Atomic, Molecular and Optical Physics: Invited Lectures Delivered at the Conference on Atomic Molecular and Optical Physics (TC 2005), 13th–15th December, 2005, Indian Association for the Cultivation of Science, Kolkata, India, World Scientific, 2007.
  39. F. Cardarelli, Materials Handbook: A Concise Desktop Reference, Springer, 2008 Search PubMed.
  40. N. Bloembergen, Nonlinear Optics, World Scientific, 1996 Search PubMed.
  41. E. W. Van Stryland, D. R. Williams and W. L. Wolfe, Handbook of Optics: Devices, Measurements, And properties; McGraw-Hill, Incorporated, Optical Society of America, W., DC, vol. 2, 1995 Search PubMed.
  42. P. G. Etchegoin, E. C. Le Ru and M. Meyer, J. Chem. Phys., 2006, 125, 164705 CrossRef CAS PubMed.
  43. M. M. Abolhasani, A. Jalali-Arani, H. Nazockdast and Q. Guo, Polymer, 2013, 54, 4686 CrossRef CAS PubMed.
  44. M. M. Abolhasani, Q. Guo, A. Jalali-Arani and H. Nazockdast, J. Appl. Polym. Sci., 2013, 130, 1247 CrossRef CAS.
  45. M. M. Abolhasani, M. Naebe, A. Jalali-Arani and Q. Guo, Nano, 2014, 09, 1450065 CrossRef CAS.
  46. M. M. Abolhasani, M. Naebe and Q. Guo, Phys. Chem. Chem. Phys., 2014, 16, 10679 RSC.
  47. M. M. Abolhasani, M. Rezaei-Abadchi, K. Magniez and Q. Guo, J. Therm. Anal. Calorim., 2015, 119, 527 CrossRef CAS.
  48. M. M. Abolhasani, M. Naebe, A. Jalali-Arani and Q. Guo, PloS One, 2014, 9, e88715 Search PubMed.
  49. L. Zhu and Q. Wang, Macromolecules, 2012, 45, 2937 CrossRef CAS.

This journal is © The Royal Society of Chemistry 2015
Click here to see how this site uses Cookies. View our privacy policy here.