Controllable synthesis of uniform CaMoO4:Eu3+,M+ (M = Li, Na, K) microspheres and optimum luminescence properties

Xiaoguang Liuabc, Ling Liab, Hyeon Mi Nohb, Jung Hyun Jeong*b, Kiwan Jang*c and Dong Soo Shinc
aHubei Collaborative Innovation Center for Advanced Organochemical Materials, Ministry-of-Education Key Laboratory for The Synthesis and Applications of Organic Functional Molecules, Hubei University, Wuhan 430062, China. E-mail: liuxiaoguang402@hotmail.com; liling402431@hotmail.com; Fax: +82-51-629-5549; Tel: +82-51-629-6285
bDepartment of Physics, Pukyong National University, Busan 608-737, Korea. E-mail: jhjeong@pknu.ac.kr; bwgn@naver.con
cDepartment of Physics, Changwon National University, Changwon, Korea 641-773. E-mail: kwjang@changwon.ac.kr; dsshin@changwon.ac.kr; Fax: +82-55-213-0263; Tel: +82-055-213-3427

Received 11th October 2014 , Accepted 5th January 2015

First published on 5th January 2015


Abstract

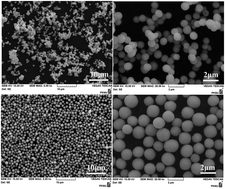
High-quality and monodisperse CaMoO4:Eu3+,M+ (M = Li, Na, K) microspheres have been synthesized with the assistance of poly-(diallyldimethylammonium chloride) (PDDA) via a facile coprecipitation hydrothermal route. X-ray diffraction (XRD), scanning electron microscopy (SEM), energy dispersive X-ray spectroscopy (EDS), transmission electron microscopy (TEM), thermogravimetric analysis (TGA), X-ray photoelectron spectroscopy (XPS), as well as photoluminescence (PL) spectroscopy are used to characterize the resulting samples. The results show that the CaMoO4:Eu3+,M+ (M = Li, Na, K) can be directly indexed to a tetragonal CaMoO4 phase with high purity. A series of controlled experiments indicate that PDDA as a shape modifier introduced into the reaction system plays a critical role in the morphology of the final products. Furthermore, the shape and size of the products can be further manipulated by adjusting the concentration of PDDA and pH values in the initial solution. The prepared microspheres are stable at a suitable annealing temperature. The possible formation mechanism for these microspheres is presented. Additionally, the PL properties of CaMoO4:Eu3+,M+ (M = Li, Na, K) were investigated in detail. The results reveal that the red emission peak intensities of CaMoO4:Eu3+,Li+ and CaMoO4:Eu3+,Na+ are higher than that of CaMoO4:Eu3+,K+. The particle size and shape have a remarkable effect on the photoluminescence properties of the phosphor. The luminescence intensity is observably enhanced with increasing of the annealing temperature due to eliminating PDDA and/or H2O present in the samples and to the improved crystal quality.


1. Introduction

In recent years, the precise architectural manipulation of inorganic nanocrystals, submicrocrystals and microcrystals with well-defined morphologies, excellent uniformity and monodispersity as well as accurately tunable sizes remains a research focus due to the close interrelation between the chemical and physical properties of materials and their geometrical factors such as shape, dimensionality, size and surface.1,2 Mastery over the shape, dimensionality and size of micro/nanocrystals not only enables control of their properties but also enhances their usefulness for a given application.3,4 Lanthanide-doped luminescent micro/nanomaterials exhibit interesting optical characteristics, which are poised to be exploited in the development of displays and phosphor applications.5

Among various rare earth doped phosphors, molybdates with scheelite-like structures are widely used as hosts for the luminescence of rare-earth ions.6 Metal molybdates (AMoO4, A = Ca, Sr, Ba, Pb and Cd) have novel properties and great potential applications in various fields such as PL, catalysis, scintillator materials, magnetic properties, and microwave applications.7–10 Among these materials, CaMoO4 has been extensively studied due to its attractive luminescence behavior and interesting structural properties. Calcium molybdate (CaMoO4) crystal, belonging to the scheelite type tetragonal structure is composed of deltahedral [CaO8] clusters and tetrahedral [MoO4] clusters with its space group I41/a (C64h).9 CaMoO4 is attractive for the following reasons. First, CaMoO4 is a highly transparent material which allows a wide range of light to pass through without much attenuation in luminescence. Second, CaMoO4 is a robust phosphor due to its high density (4.25 g cm−3) and possess better physical and chemical properties compared to other oxide materials. CaMoO4 compounds are potentially attractive as phosphor materials for advanced lighting and display applications when doped with rare-earth ions.11–15

Recently, Eu3+-doped CaMoO4 in particular has been investigated extensively as a red-emitting phosphor and was considered as ideal substitution for commercial red phosphors for WLEDs.16–19 Furthermore, a few efforts have been devoted to improve luminescence efficiency of CaMoO4:Eu3+ for better performance.12,14,20,21 It is widely reported in literatures that the presence of alkali metal ions like Li+, Na+, and K+ in CaMoO4 matrix enhances the luminescence of Eu3+ ions significantly.21–23

Many methodologies16,18,19,24–35 including conventional solid-state reactions, combustion methods, sol–gel, coprecipitation and hydrothermal method have been extensively studied to prepare CaMoO4-based micro/nanocrystals that although attractive, still face issues in efficient control over the crystal size, morphology, and compositions that are crucial for high luminescence performance.

At present CaMoO4:Eu3+,M+ red phosphors micro/nanomaterials including aggregates sphere-like particles, octahedrons, nanosheets and nanowhiskers, hollow microspherical CaMoO4:Eu3+,Li+, CaMoO4:Eu3+,Na+ nanoparticles, three dimensional flake-ball and flake-disk CaMoO4:Eu3+,Na+superstructures have been successfully fabricated by different methods, such as a microwave-assisted solid-state reaction,36 molten salt synthesis,37 spray pyrolysis method,38 solvothermal method39 and hydrothermal method.40 For practical applications, the phosphors with spherical shape are highly needed over other morphologies due to that (a) spheres can minimize the light scattering and (b) a denser luminescence layer could be developed by high packing densities.41,42 Thus, it is still one of the most challenging issues for us to establish an efficient method to synthesize CaMoO4:Eu3+,M+ red phosphors with an ideally spherical shape, a narrow size distribution, and highly dispersibility.

Solution chemistry via coprecipitation hydrothermal routes is advantageous for homogeneous nucleation of micro/nanocrystals with defined morphologies. Nevertheless, the nucleation rate is highly sensitive to the supersaturation with respect to the relative activity of Ca2+, and MoO42−. As a result, it is still an outstanding problem as to the simultaneous substitution of Eu3+ and monovalent alkali metal ions at Ca2+ sites of CaMoO4 when using solution chemistry. Having these in mind, regulation of the relative activity of reactive species (Ca2+, MoO42) by carefully choosing certain types of capping reagents such as PDDA is fundamentally. Important, which may help to simultaneously substitute Eu3+ and alkali metal ions at Ca2+ sites of CaMoO4 for significantly improved luminescence intensity. Furthermore, negatively charged polyelectrolyte are widely used as an effective means to control the crystallization of inorganic materials,43–45 positively charged polyelectrolyte are generally considered to be much less active. The cationic polyelectrolyte poly(diallyldimethyl-ammonium chloride) has recently been shown to exert significant control over CaWO4 precipitation, driving the formation of shuttle-like nanostructures.46 However, to the best of our knowledge, synthesis of monodisperse rare earth ions-doped CaMoO4 microspheres and control of sizes have never been reported in any articles.

In this paper, poly-(diallyldimethylammonium chloride) (PDDA), as an environmentally friendly and low cost cationic polyelectrolyte, has been used as an effective means to control CaMoO4:Eu3+,M+ (M = Li, Na, K) precipitation. We prepared uniform and monodisperse CaMoO4:Eu3+,M+ (M = Li, Na, K) microspheres with controllable sizes through a facile and mass production coprecipitation hydrothermal route. The effects of the amount of PDDA, pH value of the initial solution, the molybdenum source, hydrothermal temperature and annealing temperatures on the phase compositions, morphologies, and luminescence properties have been investigated in detail. In addition, the possible formation mechanism of the microspheres is proposed. By using the method in this work, we show how one may control the chemical compositions and particle sizes of CaMoO4-based red phosphors. The simultaneous substitutions of Eu3+ and Na+ at Ca2+ sites are also demonstrated. This work provides some insight into the design of other well-defined molybdate functional materials.

2. Experimental section

2.1 Materials

All chemicals were analytical grade and used directly without any further purification. Eu(NO3)3·5H2O were purchased from Shanghai Energy Chemical Limited Corporation (China). Na2MoO4·2H2O, Li2MoO4, K2MoO4, Ca(NO3)2·4H2O, nitric acid and poly(diallyldimethyl-ammonium chloride) (PDDA, 20%, w/w in water) with average molecular weights of 200[thin space (1/6-em)]000–350[thin space (1/6-em)]000 g mol−1 were purchased from Sigma-Aldrich Co. Deionized water was used throughout the experiment.

2.2 Preparation

In a typical synthesis procedure, 3.6 ml Ca (NO3)2 (0.5 mol L−1), 4 ml Eu (NO3)3 (0.05 mol L−1) were added into 17.4 ml aqueous solution containing a certain concentration of poly(diallyldimethyl-ammonium chloride) under magnetic stirring. After vigorous stirring for 20 min, 25 ml of aqueous solution containing 2 mmol Na2MoO4·2H2O was added drop wise into above solution. Then the pH value was adjusted to a given value by diluted NaOH solution or diluted HNO3 and stirred for another 30 min. After that, the as obtained mixed solution was sealed in a 70 ml Teflon-lined stainless steel autoclave and heated to the required temperature for 12 h. Finally, when the autoclave was cooled to ambient temperature naturally, the white precipitates were separated by centrifugation, washed with deionized water and ethanol several times, and air-dried at 70 °C for 10 h. For the preparation of Li+ or K+ charge compensated CaMoO4:Eu3+ sample, the corresponding amounts of Li2MoO4 or K2MoO4were added to replace Na2MoO4·2H2O at the initial stage. As-prepared samples were annealed at 600 °C, 700 °C and 900 °C in air for 6 h with a heating rate of 2 °C min−1.

2.3 Characterization

The phase structure and purity of the prepared products were characterized by X-ray diffraction (XRD) patterns using a Rigaku UItima IV multipurpose X-ray diffraction system with Cu Kα (λ = 1.5405 Å) radiation at 40 kV and 30 mA. Field emission scanning electron microscopy (FE-SEM) images and energy-dispersive spectroscopy (EDS) were taken on a TESCAN VEGA II LSU scanning electron microscope. Transmission electron microscopy (TEM) observations and selected area electronic diffraction (SAED) patterns were performed on a JEOL JEM 2010 transmission electron microscope (TEM), using an accelerating voltage of 200 kV. The X-ray photoelectron spectra (XPS) were taken on a VG ESCALAB 2000 electron energy spectrometer using Al Ká (1486.6 eV) as the X-ray excitation source. Thermogravimetric analysis (TGA) was carried out on a TGA-60H thermal analyzer (Shimadzu Corporation) with the heating rate of 10 °C min−1 in an air flow of 100 ml min−1. The photoluminescence (PL) and photoluminescence excitation (PLE) spectra were recorded by using a time-resolved Photon Technology International (PTI) fluorimeter with a Xe-arc lamp of power 60 W as the excitation source. The luminescent dynamic decay curves of Eu3+ were measured by using a phosphorimeter attachment to the main system (PTI) with a Xe-flash lamp (25 W) as the excitation source. All measurements were performed at room temperature.

3. Results and discussion

3.1 Phase, structure and morphology

During the formation process, PDDA plays a critical role in controlling the morphology and size of the final products. To investigate the effect of PDDA concentration on morphology and size evolution, a series of experiments were carried out using different PDDA concentrations, while other parameters were kept identical. Firstly, the phase purity of as-synthesized samples using Na2MoO4·2H2O as a molybdenum source in the presence of PDDA were investigated by X-ray diffraction (XRD) patterns. The XRD patterns of as-prepared samples are exhibited in Fig. 1(a)–(e). It can be observed from the XRD patterns that all the diffraction peaks are indexed as a pure tetragonal phase structure with a space group of I41/a (C64h), according to the standard data JCPDS card no. 29-0351. No discernible impurity or other phases can be detected, indicating that the prepared samples are high phase purity and the addition of PDDA and the doped Eu3+ ions has no influence on the phase transition of CaMoO4. The strong and sharp diffraction peaks suggest that the synthesized samples are highly crystallized.
image file: c4ra12183j-f1.tif
Fig. 1 XRD patterns of prepared samples using Na2MoO4·2H2O as the molybdenum source at 100 °C for 12 h with different PDDA concentration while the Eu3+ doped concentration and pH were fixed at 10 mol% and 6.0 respectively. PDDA concentration: (a) 0 g/50 ml, (b) 0.1 g/50 ml, (c) 0.2 g/50 ml, (d) 1.0 g/50 ml, (e) 2.0 g/50 ml.

Fig. 2 shows the SEM images and particle size distribution of as-prepared samples with different PDDA concentrations. As seen from the SEM images, when no PDDA is added, only irregular particles are produced (Fig. 2A and B). When the amount of PDDA is small (0.1 g/50 ml), most of the irregular shaped particles disappear and a large amount of spherical-shaped particles aggregates are obtained (Fig. 2C and D). These indicate that a small amount of PDDA already influences the morphology of the final products. Increasing the PDDA concentration to 0.2 g/50 ml, more PDDA polyelectrolyte chain can be adsorbed on the surface of resulting particles. Furthermore, the selective adsorption leads to reduced surface energy and interfacial tension of formed particles. Consequently, surface agglomeration can be effectively hindered and large scale highly dispersibility uniform microspheres are obtained (Fig. 2E and F). Fig. 2 also shows that the diameter of the microspheres increases with farther increasing PDDA concentration. When the PDDA concentration increases from 0.2 g/50 ml, 1 g/50 ml to 2 g/50 ml, the average diameter of the microspheres increases from 0.95 μm (Fig. 2E, F and K), 1.4 μm (Fig. 2G, H and L), to 2.2 μm (Fig. 2I, J and M). The above results demonstrate that the size distribution of the microspheres can be controlled by choosing suitable PDDA concentration.


image file: c4ra12183j-f2.tif
Fig. 2 SEM images of prepared samples using Na2MoO4·2H2O as the molybdenum source at 100 °C for 12 h with different PDDA concentration while the Eu3+ doped concentration and pH were fixed at 10 mol% and 6.0 respectively. PDDA concentration: 0 g/50 ml (A and B), 0.1 g/50 ml (C and D), 0.2 g/50 ml (E and F), 1.0 g/50 ml (G and H), 2.0 g/50 ml (I and J). Distribution of particle size at different PDDA concentration: (K) 0.2 g/50 ml, (L) 1.0 g/50 ml, (M) 2.0 g/50 ml.

Herein, we employ a cationic polyelectrolyte, poly-(diallydimethlammonium chloride) (PDDA) includes hydrophilic groups (positively charged quaternary ammonium groups parts) and hydrophobic groups (hydrocarbyl parts) as the capping agent and stabilizer simultaneously in a facile synthesis process. PDDA acts as a stabilizer experiencing steric repulsion and electrostatic stabilization with the attachment of neighboring PDDA molecules. The assembling process of microspheres reduces the overall energy by minimizing the surface energy. Notably, a sufficient amount of PDDA is necessary to control the crystal growth process and achieve the final microspheres.

On the basis of these results, when the PDDA concentration is high, positively charged hydrophilic groups move outward spontaneously to form a spherical-like micelle structure with large amounts of amino groups exposed. Furthermore, PDDA induces the rate of nucleation CaMoO4:Eu3+,Na+, which is attributed to phase separation based on the electrostatic interaction between the quaternary ammonium groups on the PDDA and the negatively charged molybdate ions. At much higher PDDA concentration, the nucleation of CaMoO4:Eu3+,Na+ easily occurs in the chemical microenvironments near the region of the PDDA chains. And therefore, the induction time of precipitation decreases and fewer CaMoO4:Eu3+,Na+ particles are formed. It is not surprising that the particle sizes increase slightly with increasing of the PDDA concentration. The above results powerfully demonstrate that the PDDA concentration plays a crucial role in determining the size and morphology of the products.

In this work, the products achieved at the concentration of PDDA 1.0 g/50 ml were selected as the representative samples and TEM, SAED, EDS, XPS and TGA were used to further investigate the detailed morphological, composition and structure features of the products.

The detailed morphology of the as prepared microspheres was further examined by TEM. The TEM images of the prepared samples with 1.0 g/50 ml PDDA concentration were shown in Fig. 3, from which we can clearly see that the particles are uniform in size, highly dispersibility, with an ideally spherical shape. This is well consistent with the corresponding SEM images (Fig. 2G and H). Close observation of the high-magnification TEM image in Fig. 3B reveals that the microspheres have clear edges and smooth surfaces with a solid interior. The corresponding selected area electron diffraction (SAED) pattern (inset of Fig. 3B) of individual particles exhibits the well-defined, crystalline structure, which is in good agreement with the XRD result (Fig. 1d).


image file: c4ra12183j-f3.tif
Fig. 3 (A) Low-magnification and (B) high-magnification TEM images of the as-prepared microspheres at the concentration of PDDA 1.0 g/50 ml. The inset of (B) is the corresponding SAED pattern.

It is well-known that CaMoO4 crystallizes into a tetragonal scheelite structure with space group C4h, in which Ca2+ is coordinated with eight oxygen atoms and has a S4 point symmetry with no inversion center.47 These considerations led us to assume that Eu3+ may be doped into the Ca2+ sites of the samples, in agreement with the ionic radii difference because the ionic radii of 0.947 Å for Eu3+ is slightly smaller than that of 1.00 Å for Ca2+,but much larger than that of 0.59 Å for Mo6+ in 4-fold coordination. Nevertheless, the difference in oxidation states between Eu3+ and Ca2+ would result in the deviation of the site symmetry of Eu3+ from S4 symmetry due to the charge compensation effects. Ghaderi and co-workers48 proposed two types of charge compensating patterns, hump-shaped (type I) and flat (type II), for Eu3+ substitution in Ca2+ sites via the paths: 2 Ca2+ = Eu3+ + Na+ for type I and 3Ca2+ = 2Eu3+ + ϒ (where ϒ is a Ca site vacancy) for type II. Considering the proposal of Ghaderi et al.48 This type of charge compensation pattern could exist in the present samples? To answer this question, it is necessary to measure samples composition.

Firstly, the Elemental dispersive spectrum (EDS) analysis was performed on as-prepared microspheres to identify the elements present and measure their composition. Fig. 4 shows the EDS spectra of as synthesized microspheres with PDDA as the capping agent. The EDS result confirms the presence of Ca, O, Mo, Na and Eu elements in the samples. And also the concentration of Eu3+ in the samples was determined to be 9.9%, which is close to their feed ratios. The existence of Na+ in the samples is clear in their corresponding EDS spectra. The ratio of Na and Eu atomic number in the samples is about 0.88[thin space (1/6-em)]:[thin space (1/6-em)]1, suggesting formation of CaMoO4:Eu3+,Na+. It is easy to see the effective incorporation of the Eu3+ and Na+ into the CaMoO4 matrix.


image file: c4ra12183j-f4.tif
Fig. 4 EDS spectra of as-prepared sample at the concentration of PDDA 1.0 g/50 ml.

Further evidence for the chemical composition on the surface of the as-prepared CaMoO4:Eu3+,Na+ microspheres was analyzed by the XPS technique. Fig. 5 shows the XPS survey spectra of CaMoO4:Eu3+,Na+ microspheres synthesized with PDDA. The XPS survey spectrum confirms the presence of Ca, Mo, O, Eu, Na, N and C elements in the synthesized samples surface. The C(1s, 285.21 eV) and N(1s, 401.97) peak were assigned to the PDDA capped on the CaMoO4:Eu3+,Na+ microspheres surface, which is due to the highest PDDA absorption during the synthesis. In addition, the binding energy of Na (1s, 1075.77 eV) can be clearly seen from the XPS survey spectrum, suggesting the existence of Na in the microspheres.


image file: c4ra12183j-f5.tif
Fig. 5 XPS spectrum of the CaMoO4:Eu3+,Na+ microspheres at the concentration of PDDA 1.0 g/50 ml.

The surface compositions of the CaMoO4:Eu3+,Na+ particle synthesized using PDDA as a capping agent estimated through XPS analysis were shown in Table 1. According to the data represented in Table 1 we observe that the atomic ratio of Na:Eu is estimated to be 0.93, which is close to EDS result. By combination of EDS and XPS results, it can be deduced that alkali metals ions Na+ are added into the host as the charge compensation agent. In our present work, we demonstrate the feasibility of intentionally introducing alkali ions (M+) into the vicinity of Eu3+. Once a Ca2+ site is substituted for a Eu3+ ion, an alkali ion M+ would preferentially locate in the neighborhood of Eu3+ as a result of charge compensation. In this way, the microenvironment around Eu3+ can be modified by the introduction of different types of alkali metals ions like Li+, Na+, and K+.

Table 1 Surface composition of the CaMoO4:Eu3+,Na+ microspheres synthesized with PDDA estimated through XPS analysis
CaMoO4:Eu3+,Na+ O(1s) Mo(3d) Ca(2p) Eu(3d5) Na(1s) C(1s) N(1s)
Peak position (eV) 534.12 236.28 350.93 1139.14 1075.77 285.21 401.97
(Atom%) 33.39 8.31 3.41 1.38 1.29 31.45 20.77


The thermal behavior of CaMoO4:Eu3+,Na+ microspheres was analyzed by TG technique (Fig. 6). The result shows that the CaMoO4:Eu3+,Na+ microspheres contained PDDA and little water. The mass loss between 200 and 800 °C is ascribed to the decomposition and desorption of residual PDDA. The amount of PDDA in the microspheres is about 2.8 wt%. These results indeed show that limited amount of PDDA molecules are incorporated into the microspheres.


image file: c4ra12183j-f6.tif
Fig. 6 TGA curve of CaMoO4:Eu3+,Na+ microspheres at the concentration of PDDA 1.0 g/50 ml.

3.2 Influence of factors on the phase identification and morphology

Influence of pH values. The variation of pH obviously influences the morphology of the as-obtained CaMoO4:Eu3+,Na+ products. Fig. 7 shows the SEM images of the products obtained under the same conditions but at various pH values. The corresponding XRD patterns were shown in Fig. 8. As seen from the SEM images, CaMoO4:Eu3+,Na+ materials with various morphologies can be obtained by simply adjusting the pH values of the suspension solution. At pH = 4, the obtained CaMoO4:Eu3+,Na+ products exhibit octahedral-shaped morphology and smooth surfaces (Fig. 7A). On increasing the pH value to 6, morphology of the products greatly varies. It can be clearly seen from Fig. 7B, that there are a large quantity of highly dispersibility uniform CaMoO4:Eu3+,Na+ microspheres with an average diameter of about 1.4 μm. When the pH value is varied from 6 to 7 (Fig. 8c), uniform microspheres disappear and two kinds of morphologies of the product coexist: nonregular large spheres particles and flower-like architectures composed of small particles irregular aggregates on the surface of the product, but they share the same XRD pattern (Fig. 8). When the pH is further increased to 10, the morphology of the corresponding product is basically maintained flower-like architectures (Fig. 7D).
image file: c4ra12183j-f7.tif
Fig. 7 SEM images of CaMoO4:Eu3+,Na+ prepared with different pH values of 4.0 (A), 6.0 (B), 7.0 (C), 10.0 (D).

image file: c4ra12183j-f8.tif
Fig. 8 XRD patterns of CaMoO4:Eu3+,Na+ prepared with different pH values of 4.0 (A), 6.0 (B), 7.0 (C), 10.0 (D).

On the basis of the experimental results, it is clear that the morphology of the final product strongly depended on the pH of the initial solution in our case. The pH is critical for directing the intrinsic shapes of the crystals due to its characteristic symmetry and structure, and change the growth rate of crystallographic planes with different surface energies so as to form different crystallite morphologies.27,49–51 Otherwise, the pH may affect the intensity of the electrostatic attraction between PDDA and crystal facets.52,53 As the pH increased, CaMoO4:Eu3+,Na+ nucleating process occurs faster and more nuclei are formed and large numbers of CaMoO4:Eu3+,Na+ nuclei tend to aggregate together to form larger irregular particles during the reaction process. Therefore, pH value of 6 is optimal for good crystallization.

Influence of hydrothermal temperature. In order to improve luminescence performance of CaMoO4:Eu3+,Na+ phosphor, the subsequent hydrothermal treatment is necessary. The effect hydrothermal temperatures on the morphology of the final products were shown in the Fig. 9. As seen from the SEM images, when the hydrothermal temperatures is not more than 140 °C, the morphology of the final products does not show obviously change. As the hydrothermal temperature reach 180 °C, the surface of microspheres is coarse, this is ascribed to the decomposition and desorption of the PDDA in the surface of microspheres.
image file: c4ra12183j-f9.tif
Fig. 9 SEM images of CaMoO4:Eu3+,Na+ prepared with different hydrothermal temperature 20 °C (A), 80 °C (B), 100 °C (C), 140 °C (D), 180 °C (E).
Influence of annealing temperature. To remove PDDA and/or H2O present in the samples and determine the effect of the annealing temperature on the CaMoO4:Eu3+,Na+ microspheres morphology, as-prepared samples were annealed for 6 h at three different temperatures, 600, 700 and 900 °C. The SEM images of samples annealed at different temperatures were shown in the Fig. 10. It can be seen from Fig. 10, CaMoO4:Eu3+,Na+ still retains the microspheres morphology, except for a little bulge as the exterior of the microspheres because of the gradual elimination of organic elements at 700 °C annealing temperature. When the annealing temperature is further increased to 900 °C, CaMoO4:Eu3+,Na+ particles morphology is changed from spheres to irregular shaped particles.
image file: c4ra12183j-f10.tif
Fig. 10 SEM images of CaMoO4:Eu3+,Na+ annealed at different temperatures: as-prepared (A), 600 °C (B), 700 °C (C), 900 °C (D).

The XRD patterns of CaMoO4:Eu3+,Na+ at different annealing temperatures were also shown in Fig. 11. Based on the XRD results, the calculated crystallite sizes for as-prepared, 600, 700 and 900 °C are 105, 98, 96.5 and 158.6 nm, respectively. The annealing process can be divided into two stages, namely remove PDDA and Ostwald ripening. When the annealing temperature is not more than 700 °C, the PDDA gradually ashing and can be removed. The procedures are mainly provided for removing PDDA. The average size of the grains has seldom changed as a consequence of annealing temperature. Therefore the morphological of CaMoO4:Eu3+,Na+ microspheres are obviously independent of the annealing temperature. When the annealing temperature increases from 700 to 900 °C, The average size of the grains increase obviously with the increase of the annealing temperature as a consequence of Ostwald ripening.54 This result indicates that the crystal quality of the CaMoO4:Eu3+,Na+ has changed little, and these microspheres morphology are stable when the annealing temperature is not more than 700 °C. At higher annealing temperatures the crystal quality of the CaMoO4:Eu3+,Na+ is significantly improved, however these microspheres morphology are unstable. The effect of different alkali metals ions.


image file: c4ra12183j-f11.tif
Fig. 11 XRD patterns of CaMoO4:Eu3+,Na+ as-prepared, 600 °C, 700 °C and 900 °C annealed.

According to above results, Eu3+ and Na+ are able to incorporation into the host CaMoO4, when Na2MoO4·2H2O as the molybdenum source. These considerations led us to assume that alkali metals ions Li+ and K+ may be doped into the Ca2+ sites of the samples. For the preparation of Li+ or K+ charge compensated CaMoO4:Eu3+sample, the corresponding amounts of Li2MoO4 or K2MoO4 were added to replace Na2MoO4·2H2O at the initial stage.

In our current system, X2MoO4 (X = Li, Na, and K) was added, the only difference lies in the cations in the initial solution. In this way, the microenvironment around Eu3+ can be modified by the introduction of different types of alkali metals ions like Li+ and K+. The phase purity of as-synthesized samples using Li2MoO4 or K2MoO4 as a molybdenum source in the presence of PDDA were investigated by X-ray diffraction (XRD) patterns. The XRD patterns of as-prepared samples were exhibited in Fig. 12(a)–(c). It can be observed from the XRD patterns that all the diffraction peaks are indexed as a pure tetragonal phase structure with a space group of I41/a (C64h), according to the standard data JCPDS card no. 29-0351. No discernible impurity or other phases can be detected, indicating that the prepared samples are high phase purity. The typical SEM images of the prepared products with different molybdenum source were shown in Fig. 13A–F, respectively. By comparison with Na2MoO4·2H2O as the molybdenum source, it clearly shows that the products prepared using Li2MoO4 as the molybdenum source is composed of numerous uniform microspheres, with the diameter of 1.4 μm. However, the products prepared using K2MoO4 as the molybdenum source is composed of inhomogeneous microspheres.


image file: c4ra12183j-f12.tif
Fig. 12 XRD patterns of prepared CaMoO4:Eu3+,M+ using Li2MoO4 (A), Na2MoO4·2H2O (B), and K2MoO4 (C) as the molybdenum source with a PDDA concentration of 1 g/50 ml at 100 °C for 12 h, respectively. Eu3+ doped concentration was 10 mol%, pH = 6.0.

image file: c4ra12183j-f13.tif
Fig. 13 SEM images of the obtained sample by using Li2MoO4 (A and B), Na2MoO4·2H2O (C and D), and K2MoO4 (E and F) as the Mo source, respectively.

3.3 Possible formation mechanism CaMoO4:Eu3+,M+ (M = Li, Na, K) microspheres

On the basis of the above experiment results and the morphological evolution evidence, Fig. 14 summarizes the possible formation processes of CaMoO4:Eu3+,M+ (M = Li, Na, K) microspheres. The CaMoO4:Eu3+,M+ microspheres formation process is considered as a three-step system: nucleation, aggregation and isotropic growth processes. First of all, the CaMoO4:Eu3+,M+ (M = Li, Na, K) formation for moderate supersaturation level, the nucleation process took place, and the amorphous CaMoO4:Eu3+,M+ (M = Li, Na, K) elementary clusters55–57 were formed as precursors in this step. In the subsequent process, the elementary clusters aggregated together to form metastable crystalline primary grains, and this led to the reduction in surface energy, and then the nearly uniform nanoparticles aggregated to form the highly monodisperse spheres. Simultaneously, the PDDA molecules evenly adsorb onto the surface of the particles in all directions to form a protective layer through electrostatic attraction, thus holding back the growth rate of the crystals and forming isotropic growth. After the spherical CaMoO4:Eu3+,M+ (M = Li, Na, K) microparticles underwent a recrystallization and ageing process. Due to the sufficient PDDA in the reaction system, the particles are well dispersed instead of being agglomerated. Consequently, the uniform monodisperse CaMoO4:Eu3+,Na+ (Li+) microspheres are obtained with smooth surface.
image file: c4ra12183j-f14.tif
Fig. 14 Schematic illustration of the possible formation process of CaMoO4:Eu3+,M+ (M = Li, Na, K) microspheres.

3.4 Luminescence properties

The photoluminescence properties of the as-prepared CaMoO4:Eu3+,Na+ phosphors were investigated in detail at room temperature. As shown in Fig. 15, the excitation spectrum of the CaMoO4:Eu3+,Na+ samples consists of a wide absorption band from 200 to 350 nm centered at 293 nm and several sharp lines such as 7F05L6 line at around 397 nm and 7F05D2 line at around 467 nm, which can be ascribed to the charge-transfer band between the O2− and Mo6+ ions58 and the f–f transitions within the 4f6 configuration of the Eu3+ ions, respectively. Upon excitation with UV (293 nm), near UV (397 nm) and blue (467 nm) wavelength light, the emission spectrum of CaMoO4:Eu3+,Na+ shows a typical Eu3+ red emission. These emission peaks are centered at 537, 593, 617.5 (614), 657, and 704 nm, which can be described as the well-known 5D07FJ (J = 0, 1, 2, 3, 4) radiative transition of the Eu3+ ions, as labeled in Fig. 14, respectively. Obviously, the strongest emission peak is located at 617.5 nm, which is due to the typical forced electric dipole transition 5D07F2 of the Eu3+ ions. As well-known to us, the intensities of different 5D07FJ transitions depend on the local symmetry of the crystal field of the Eu3+ ions. The 5D07F2 transition is hypersensitive, while the 5D07F1 transition is insensitive to the crystal field environment. For instance, in a site with an inversion symmetry, the magnetic dipole transition is dominant, while in a site without inversion symmetry, the 5D07F2 electronic transition becomes the strongest one.59,60 The intensity of 5D07F2 transition is much higher than that of 5D07F1, which is strong evidence that Eu3+ ions mainly occupy the lattice site without inversion symmetry.
image file: c4ra12183j-f15.tif
Fig. 15 Excitation and emission spectra of CaMoO4:Eu3+,Na+ phosphors with the microspheres morphology.

It is well-known that CaMoO4 crystallizes into a tetragonal scheelite structure with space group C4h, in which Ca2+ is coordinated with eight oxygen atoms and has S4 point symmetry. In our system, Eu3+ and Na+ codoped in CaMoO4 lattice would lead to a charge balance and moreover a reduction in Ca2+ vacancy concentration. Eu3+ and Na+ codoped in CaMoO4 matrix may induce a lattice distortion and lowered lattice symmetry. This assumption could be verified by the presence of the very weak 5D07F0 emission at 537 nm in the emission spectra since the 5D07F0 emission is only allowed for Cs, Cn, Cnν site symmetry.61 Furthermore, the codoped Eu3+ and Na+ at Ca2+ sites in prepared samples also plays a very important role in the enhanced luminescence intensity. Numerous papers have reported that the addition of alkali metal ions into the rare-earth-doped materials results in a significant enhancement of the luminescence properties, which is all based on the modifications of the local symmetry and the surroundings near the rare earth ions by the addition of coactive ions or charge compensators of alkali metal ions.22,37,62,63 For the present work, when Na+ ions are incorporated into CaMoO4 lattice in/near Eu-O8 cluster to maintain a local charge balance between Eu3+ and Na+, the structure of the Eu-O8 would not be destroyed but a slight structural modification and the resulting lowered symmetry of the crystal field around Eu3+.

In general, particle size and shape will affect the optical properties of phosphors. A series of experiments were carried out to explore the relationship between particle size, shape, and the fluorescent properties. Emission spectra of samples prepared with different PDDA concentrations ([PDDA]: 0.1 g/50 ml, 0.2 g/50 ml, 1 g/50 ml and 2 g/50 ml) were given in Fig. 16. The differences in the particle sizes (Fig. 2) will affect the scattering and absorption of incident light, so the emission intensities of the samples should be different. As shown in Fig. 15, the luminescent intensity CaMoO4:Eu3+,Na+ first observably enhance, and then very slight weaken with the increasing of the PDDA concentration. This is two reasons resulting on the one hand, larger size particles have much stronger emission intensity than of smaller samples, because larger particles imply smaller surface area and less activator ions near to the surface to suffer from the surface-defect resulting in less nonradioactive decay losses of the surface luminescence ions. On the other hand, in our experiment, the PDDA is a water soluble polymer, the PDDA concentration increases, the particles size increases, and then larger size particles have much thicker adsorbed layer than of smaller samples. On increasing the PDDA concentration to 2 g/50 ml, the luminescent intensity slight weaken. This is possibly due to a quenching effect from the surface PDDA or H2O over the particles.


image file: c4ra12183j-f16.tif
Fig. 16 Emission spectra of CaMoO4:Eu3+,Na+ at different PDDA concentration.

It is commonly accepted that the PL properties of inorganic materials are strongly dependent on their sizes, morphologies, and crystallinity. From Fig. 17, it can be clearly seen that the emission spectra of the products synthesized at different pH are similar in shape, but different in the intensity to some extent, indicating that the luminescent properties are closely correlated with the morphologies of the materials. Under identical measurement conditions, the sphere-shaped microstructure (red line) has the highest relative emission intensity, while the flower-shaped structures (green line) exhibit the lowest intensity. It is thus inferred that the morphology of the microsphere is more beneficial than the morphology of octahedral-shaped morphology and flower-like to the emission in the red region. The possible reasons for the difference of emission intensities can be deduced as follows. On the one hand, this interesting phenomenon might arise from the difference in the effects of crystal field perturbation on the in dividable f–f transition as a consequence of the different morphologies of the four samples. In our cases, the PL intensity of the sphere-shaped microstructure is higher than that of the others samples. The enhanced luminescence performance due to microsphere has less surface defect than the other three samples. On the other hand, the electronic structures could be modified by means of the changes of the shapes of samples, which influences the excitation of the carriers from the valence band to the conduction band and the numbers of photons released from the surfaces of samples.64 All of the aforementioned observations support the concept of morphology-dependent properties of CaMoO4:Eu3+,Na+ samples and emphasizes the importance of morphology control.


image file: c4ra12183j-f17.tif
Fig. 17 Emission spectra of CaMoO4:Eu3+,Na+ at different pH value.

Fig. 18 showed the emission spectra of CaMoO4:Eu3+,Na+ phosphors prepared at various temperatures between 20 and 180 °C. From Fig. 18, it can be seen that the emission intensity increases gradually with increases in the temperature up to 140 °C, and then decreases dramatically at 180 °C, as shown in the inset in Fig. 18. The CaMoO4:Eu3+,Na+ prepared at 140 °C is found to have the largest emission intensity. As is for the microcrystals prepared by wet chemical methods, the surfaces of the particles are covered by a great number of hydrophilic groups or H2O either chemically bonded or physically adsorbed on the surfaces. These hydrophilic groups or H2O can be the very efficient quenchers of the luminescence of lanthanide elements through multiphonon relaxation.65 Huignard and co-workers demonstrated that the transfer of YVO4:Eu3+ colloidal from water to deuterated water reduces the multiphonon relaxation and thus enhances the luminescent efficiency.66 The sample prepared at room temperature has much more surface hydrophilic groups or H2O than that obtained after hydrothermal treatments. As the hydrothermal treatment temperature reached 180 °C, the emission intensity decreases remarkably, this is ascribed to the decomposition of the PDDA in the surface of microspheres.


image file: c4ra12183j-f18.tif
Fig. 18 Emission spectra of CaMoO4:Eu3+,Na+ at different hydrothermal temperatures.

The photoluminescence properties of the CaMoO4:Eu3+,Na+ samples annealed at different annealing temperatures were investigated in detail at room temperature. Fig. 19 showed excitation spectra and emission spectra of CaMoO4:Eu3+,Na+ at different annealing temperatures. Generally, the excitation position and its full width at half maximum (FWHM) are affected by the environmental factor surrounding the centre ion Mo6+, and the intensity of 5D07F2 emission is sensitive to the distortion degree of EuO8 polyhedron.58 From Fig. 19a, it can be clearly seen that the excitation spectra of the products annealed at different temperatures are similar in shape and position by monitoring the emission wavelength at 617.5 nm. It indicates that the environmental factor surrounding the Mo6+ ions has no change at different temperatures. An emission trend was observed for the CaMoO4:Eu3+,Na+ microspheres as a function of the annealing temperature, as shown in Fig. 19b, emission intensity at 614 nm and 617.5 nm increases in the following order of annealing temperature as-prepared 600 °C, 700 °C, and 900 °C. The luminescence intensity is enhanced significantly by annealing at 600 °C than that of as-prepared sample. It indicates that the distortion degree of EuO8 polyhedron is increasing with increasing of the annealing temperature. This may be attributed to eliminate of the PDDA by annealing resulting in decrease of the non-radiative transition probability. Up to 600 °C, there is almost no change in microspheres morphology (Fig. 10). As compared to the as-prepared, 600 °C and 700 °C annealed samples, 900 °C annealed samples have high luminescence intensity. However, the peak positions are almost unaffected for 900 °C annealed samples. Improvement of luminescence is related to the extent of the improved crystal quality and decrease of non-radiative rate arising from the surface defect after annealing at higher temperatures.


image file: c4ra12183j-f19.tif
Fig. 19 (a) Excitation and (b) emission spectra of CaMoO4:Eu3+,Na+ at different annealing temperatures.

The photoluminescence properties of the as-prepared CaMoO4:Eu3+,M+ with different charge compensator phosphors were investigated at room temperature. As shown in Fig. 20, the shape and positions are the same in the excitation spectra and emission spectra for CaMoO4:Eu3+,M+ (M = Li, Na, K) samples. However, it can be seen that Li+, Na+ or K+ ions have different influences on the luminescent intensity. The red emission peak intensity of CaMoO4:Eu3+ using Li+ and Na+ ions as charge compensator is higher than that of K+ ions, Li+ ions have the best charge compensation effect. Because K+ ion (0.138 nm) has the largest ionic radius, which is larger than that of Ca2+ (0.100), Na+ (0.102 nm) and Li+ (0.076 nm), and hence it is relatively difficult to substitute Ca2+ with K+ in the crystal lattice of CaMoO4, which in turn leads to the lowest luminescence intensity.


image file: c4ra12183j-f20.tif
Fig. 20 (a) Excitation and (b) emission spectra of CaMoO4:Eu3+,M+ with different charge compensator phosphors.

Fig. 21 showed the CIE chromaticity coordinates of CaMoO4:Eu3+,M+ (M = Li, Na, K) based on their corresponding emission spectra. The CIE color coordinate of the CaMoO4:Eu3+,Li+, CaMoO4:Eu3+,Na+, CaMoO4:Eu3+,K+ microspheres phosphor is (0.63, 0.34), (0.62, 0.35), (0.57, 0.36), respectively. They are close to the standard of NTSC (x = 0.67, y = 0.33), indicating that CaMoO4:Eu3+,M+ (M = Li, Na, K) microspheres phosphors have a good color purity and potential application for red phosphors.


image file: c4ra12183j-f21.tif
Fig. 21 CIE color coordinates of CaMoO4:Eu3+,M+ with different charge compensator microspheres phosphors (a) CaMoO4:Eu3+,Li+, (b) CaMoO4:Eu3+,Na+, (c) CaMoO4:Eu3+,K+.

The PL decay curves for the as-synthesized CaMoO4:Eu3+,Na+ microspheres samples were also studied. Fig. 22 showed the decay curves for the 5D07F2 transition of Eu3+ in CaMoO4:Eu3+,Na+, which can all be well fitted into a single exponential function as I = I0[thin space (1/6-em)]exp(−t/τ), where τ is the decay lifetime, I0 is the initial intensity and t is decay time. The lifetime is determined to be 467.5 μs for 5D07F2 emission of Eu3+.


image file: c4ra12183j-f22.tif
Fig. 22 The PL decay curves for the as-synthesized CaMoO4:Eu3+,Na+ microspheres samples.

4. Conclusions

A facile PDDA-modulated coprecipitation hydrothermal route was used to synthesize high-quality and monodisperse CaMoO4:Eu3+,M+ (M = Li, Na, K) microspheres. The PDDA plays a critical role in the morphology of the final products. Furthermore, the shape and size of the products can be manipulated by adjusting the concentration of PDDA and pH values in the initial solution. The prepared microspheres morphology is stable at the suitable annealing temperature. PL spectra of CaMoO4:Eu3+,Na+ show that the photoluminescence properties could be improved through different pH and PDDA concentration and hydrothermal treatment and annealing treatment. The particle size and shape have a remarkably effect on the photoluminescence properties of the phosphor. The luminescence intensity is remarkable enhanced with the increase of annealing temperature due to eliminating PDDA and/or H2O present in the samples and to the improved crystal quality. The red emission peak intensity of CaMoO4:Eu3+ using Li+ and Na+ ions as charge compensator is higher than that of K+ ions, and Li+ ions have the best charge compensation effect.

Acknowledgements

This research was supported by the Basic Science Research Program through the National Research Foundation of Korea (NRF) funded by the Ministry of Education, Science and Technology (no. 2010-0029634). The “CaMoO4:Eu3+,M+ (M = Li, Na, K) microspheres” was supplied by the Display and Lighting Phosphor Bank at Pukyong National University. Our study also was supported by the National Natural Science Foundations of China (Grant no. 21301053) and the Natural Science Fund for Creative Research Groups of Hubei Province of China (no. 2014CFA015).

References

  1. A. P. Alivisatos, Science, 1996, 271, 933–937 CAS.
  2. J. Hu, T. W. Odom and C. M. Lieber, Acc. Chem. Res., 1999, 32, 435–445 CrossRef CAS.
  3. Y. Xia, Y. Xiong, B. Lim and S. E. Skrabalak, Angew. Chem., Int. Ed., 2009, 48, 60–103 CrossRef CAS PubMed.
  4. S. Gai, C. Li, P. Yang and J. Lin, Chem. Rev., 2014, 114, 2343–2389 CrossRef CAS PubMed.
  5. Luminescent Materials, ed. G. Blasse and B. C. Grabmaier, Springer, Berlin, 1994 Search PubMed.
  6. A. M. Kaczmarek and R. Van Deun, Chem. Soc. Rev., 2013, 42, 8835–8848 RSC.
  7. J. C. Sczancoski, M. D. R. Bomio, L. S. Cavalcante, M. R. Joya, P. S. Pizani, J. A. Varela, E. Longo, M. S. Li and J. A. Andrés, J. Phys. Chem. C, 2009, 113, 5812–5822 CAS.
  8. N. Sharma, K. M. Shaju, G. V. Subba Rao, B. V. R. Chowdari, Z. L. Dong and T. J. White, Chem. Mater., 2003, 16, 504–512 CrossRef.
  9. F. A. Rabuffetti, S. P. Culver, L. Suescun and R. L. Brutchey, Inorg. Chem., 2014, 53, 1056–1061 CrossRef CAS PubMed.
  10. Q. Gong, X. Qian, H. Cao, W. Du, X. Ma and M. Mo, J. Phys. Chem. B, 2006, 110, 19295–19299 CrossRef CAS PubMed.
  11. C. Hazra, T. Samanta, A. V. Asaithambi and V. Mahalingam, Dalton Trans., 2014, 43, 6623–6630 RSC.
  12. B. P. Singh, A. K. Parchur, R. S. Ningthoujam, A. A. Ansari, P. Singh and S. B. Rai, Dalton Trans., 2014, 43, 4779–4789 RSC.
  13. B. P. Singh, A. K. Parchur, R. S. Ningthoujam, A. A. Ansari, P. Singh and S. B. Rai, Dalton Trans., 2014, 43, 4770–4778 RSC.
  14. S. Yan, J. Zhang, X. Zhang, S. Lu, X. Ren, Z. Nie and X. Wang, J. Phys. Chem. C, 2007, 111, 13256–13260 CAS.
  15. Y. Hu, W. Zhuang, H. Ye, D. Wang, S. Zhang and X. Huang, J. Alloys Compd., 2005, 390, 226–229 CrossRef CAS.
  16. S. Yu, Z. Lin, L. Zhang and G. Wang, Cryst. Growth Des., 2007, 7, 2397–2399 CAS.
  17. A. K. Parchur, R. S. Ningthoujam, S. B. Rai, G. S. Okram, R. A. Singh, M. Tyagi, S. C. Gadkari, R. Tewari and R. K. Vatsa, Dalton Trans., 2011, 40, 7595–7601 RSC.
  18. Y. Yang, X. Li, W. Feng, W. Yang, W. Li and C. Tao, J. Alloys Compd., 2011, 509, 845–848 CrossRef CAS.
  19. G. S. R. Raju, E. Pavitra, Y. H. Ko and J. S. Yu, J. Mater. Chem., 2012, 22, 15562–15569 RSC.
  20. A. Xie, X. Yuan, S. Hai, J. Wang, F. Wang and L. Li, J. Phys. D: Appl. Phys., 2009, 42, 105107 CrossRef.
  21. Z. H. Zhang, Q. Huang, X. Zhao and Z. L. Huang, Phys. Status Solidi A, 2009, 206, 2839–2843 CrossRef CAS.
  22. J. Liu, H. Lian and C. Shi, Opt. Mater., 2007, 29, 1591–1594 CrossRef CAS.
  23. G. h. Peng, X. Wang, Z. h. Liang, Y. c. Wang, X. b. Han and J. l. Wu, J. Alloys Compd., 2013, 576, 227–231 CrossRef CAS.
  24. Y. S. Luo, X. J. Dai, W. D. Zhang, Y. Yang, C. Q. Sun and S. Y. Fu, Dalton Trans., 2010, 39, 2226–2231 RSC.
  25. V. S. Marques, L. S. Cavalcante, J. C. Sczancoski, A. F. P. Alcântara, M. O. Orlandi, E. Moraes, E. Longo, J. A. Varela, M. Siu Li and M. R. M. C. Santos, Cryst. Growth Des., 2010, 10, 4752–4768 CAS.
  26. Z. Hou, R. Chai, M. Zhang, C. Zhang, P. Chong, Z. Xu, G. Li and J. Lin, Langmuir, 2009, 25, 12340–12348 CrossRef CAS PubMed.
  27. Y. Jin, J. Zhang, S. Lu, H. Zhao, X. Zhang and X. j. Wang, J. Phys. Chem. C, 2008, 112, 5860–5864 CAS.
  28. V. M. Longo, L. c. S. Cavalcante, E. C. Paris, J. l. C. Sczancoski, P. S. Pizani, M. S. Li, E. Longo and J. A. Varela, J. Phys. Chem. C, 2011, 115, 5207–5219 CAS.
  29. Q. Gong, X. Qian, X. Ma and Z. Zhu, Cryst. Growth Des., 2006, 6, 1821–1825 CAS.
  30. F. Yu, J. Zuo, Z. Zhao, C. Jiang and Q. Yang, Mater. Res. Bull., 2011, 46, 1327–1332 CrossRef CAS.
  31. T. Thongtem, S. Kungwankunakorn, B. Kuntalue, A. Phuruangrat and S. Thongtem, J. Alloys Compd., 2010, 506, 475–481 CrossRef CAS.
  32. C. Xu, D. Zou, H. Guo, F. Jie and T. Ying, J. Lumin., 2009, 129, 474–477 CrossRef CAS.
  33. Y. J. Zhu and F. Chen, Chem. Rev., 2014, 114, 6462–6555 CrossRef CAS PubMed.
  34. Y. Sun, C. Li, Z. Zhang, X. Ma, L. Wang, Y. Wang, M. Song, P. Ma, L. Jiang and Y. Guo, Solid State Sci., 2012, 14, 219–224 CrossRef CAS.
  35. D. Chen, K. Tang, F. Li and H. Zheng, Cryst. Growth Des., 2005, 6, 247–252 Search PubMed.
  36. Q. Zhang and Z. Xia, RSC Adv., 2014, 4, 53237–53244 RSC.
  37. X. Bao, S. Zhou, J. Wang, L. Zhang, S. Huang and Y. Pan, Mater. Res. Bull., 2013, 48, 1034–1039 CrossRef CAS.
  38. X. Wang, Y. He, G. H. Peng, Z. H. Liang and J. L. Wu, Chin. J. Mater. Res, 2012, 26, 615–620 CAS.
  39. M. J. Kim and Y. D. Huh, Opt. Mater., 2012, 35, 263–267 CrossRef CAS.
  40. Y. Zhou, J. Liu, X. Yang, X. Yu and L. Wang, J. Electrochem. Soc., 2011, 158, K74–K80 CrossRef CAS.
  41. G. Wakefield, E. Holland, P. J. Dobson and J. L. Hutchison, Adv. Mater., 2001, 13, 1557–1560 CrossRef CAS.
  42. J. G. Li, X. Li, X. Sun and T. Ishigaki, J. Phys. Chem. C, 2008, 112, 11707–11716 CAS.
  43. Y. Wang, S. Gai, C. Li, X. Zhang, N. Niu, F. He, M. Zhang and P. Yang, RSC Adv., 2013, 3, 5945–5955 RSC.
  44. T. Wang, H. Colfen and M. Antonietti, J. Am. Chem. Soc., 2005, 127, 3246–3247 CrossRef CAS PubMed.
  45. V. Dmitrovic, G. J. M. Habraken, M. M. R. M. Hendrix, W. J. E. M. Habraken, A. Heise, G. de With and N. A. J. M. Sommerdijk, Polymers, 2012, 4, 1195–1210 CrossRef CAS.
  46. S. Liu, S. Tian and R. Xing, CrystEngComm, 2011, 13, 7258–7261 RSC.
  47. S. P. Culver, F. A. Rabuffetti, S. Zhou, M. Mecklenburg, Y. Song, B. C. Melot and R. L. Brutchey, Chem. Mater., 2013, 25, 4129–4134 CrossRef CAS.
  48. M. P. Ghaderi, J. M. Campbell, I. H. Sylvester and P. J. Sylvester, J. Econ. Geol. Bull. Soc., 1999, 94, 423–437 CrossRef CAS.
  49. S. H. Yu, B. Liu, M. S. Mo, J. H. Huang, X. M. Liu and Y. T. Qian, Adv. Funct. Mater., 2003, 13, 639–647 CrossRef CAS.
  50. B. Liu, S. H. Yu, L. Li, Q. Zhang, F. Zhang and K. Jiang, Angew. Chem., Int. Ed., 2004, 43, 4745–4750 CrossRef CAS PubMed.
  51. Z. Fu, W. Xia, Q. Li, X. Cui and W. Li, CrystEngComm, 2013, 14, 4618–4624 RSC.
  52. F. Han, Z. Guan, T. S. Tan and Q. H. Xu, ACS Appl. Mater. Interfaces, 2012, 4, 4746–4751 CAS.
  53. L. Du, S. Zhang, G. Chen, G. Yin, C. Du, Q. Tan, Y. Sun, Y. Qu and Y. Gao, ACS Appl. Mater. Interfaces, 2014, 6, 14043–14049 CAS.
  54. D. Alloyeau, C. Ricolleau, C. Mottet, T. Oikawa, C. Langlois, Y. Le Bouar, N. Braidy and A. Loiseau, Nat. Mater., 2009, 8, 940–946 CrossRef CAS PubMed.
  55. D. Gebauer, A. Volkel and H. Colfen, Science, 2008, 322, 1819–1822 CrossRef CAS PubMed.
  56. B. Fleury, M. A. Neouze, J. M. Guigner, N. Menguy, O. Spalla, T. Gacoin and D. Carriere, ACS Nano, 2014, 8, 2602–2608 CrossRef CAS PubMed.
  57. A. Dey, P. H. H. Bomans, F. A. Muller, J. Will, P. M. Frederik, G. de With and N. A. J. M. Sommerdijk, Nat. Mater., 2010, 9, 1010–1014 CrossRef CAS PubMed.
  58. X. Liu, L. Li, H. M. Noh, B. K. Moon, B. C. Choi and J. H. Jeong, Dalton Trans., 2014, 43, 8814–8825 RSC.
  59. A. F. Kirby and F. S. Richardson, J. Phys. Chem., 1983, 87, 2544–2556 CrossRef CAS.
  60. J. W. Stouwdam and F. C. J. M. van Veggel, Nano Lett., 2002, 2, 733–737 CrossRef CAS.
  61. G. Blasse and A. Bril, J. Inorg. Nucl. Chem., 1967, 29, 2231–2241 CrossRef CAS.
  62. J. Huang, J. Xu, H. Luo, X. Yu and Y. Li, Inorg. Chem., 2011, 50, 11487–11492 CrossRef CAS PubMed.
  63. A. K. Singh, S. K. Singh and S. B. Rai, RSC Adv., 2014, 4, 27039–27061 RSC.
  64. D. Chen, G. Shen, K. Tang, Z. Liang and H. Zheng, J. Phys. Chem. B, 2004, 108, 11280–11284 CrossRef CAS.
  65. G. Blasse, Prog. Solid State Chem., 1988, 18, 79–171 CrossRef CAS.
  66. A. Huignard, T. Gacoin and J. P. Boilot, Chem. Mater., 2000, 12, 1090–1094 CrossRef CAS.

This journal is © The Royal Society of Chemistry 2015
Click here to see how this site uses Cookies. View our privacy policy here.