DOI:
10.1039/C4RA12138D
(Paper)
RSC Adv., 2015,
5, 8693-8705
Assessment of the corrosion protection ability of cysteamine and hybrid sol–gel twin layers on copper in 1% NaCl
Received
10th October 2014
, Accepted 19th December 2014
First published on 22nd December 2014
Abstract
Hybrid monolayers of 3-glycidoxypropyltrimethoxysilane and tetraethoxysilane have been fabricated onto a cysteamine modified copper surface with a view to achieve maximum corrosion protection. The grafting has been characterized by Fourier transform infrared spectroscopy, scanning electron microscopy, energy-dispersive X-ray spectroscopy and atomic force microscopy. The corrosion inhibiting effect of these twin layers has been investigated by cyclic voltammetry, electrochemical impedance spectroscopy and potentiodynamic polarization studies. The study revealed the efficacy of the twin layers in the protection of copper in a neutral medium.
1. Introduction
Copper is an actively researched metal, with a wide range of applications due to its high electrical and thermal conductivity, mechanical workability and malleability. However, it is vulnerable to corrosion particularly in the presence of aggressive chloride anions, which limits its industrial applications.1–4 Diverse strategies have been developed to protect copper from corrosion.5 In recent years, self-assembled monolayers (SAMs) have drawn greater interest due to their uses in various domains such as wetting, lubrication, chemical sensing, adhesion enhancement, corrosion resistant coatings, and electro-optic engineering. The formation of SAM films is simple and direct, and the resulting highly-ordered molecular films can be tailored to exhibit desirable chemical and physical properties.6,7 Among the measures of corrosion control, the eco-friendly hybrid sol–gel coatings have become popular and are replacing the environmentally hazardous chromate conversion coatings.8,9 SAMs of silica sol–gel have been formed spontaneously by chemisorption which subsequently undergo self-organization process, resulting in the enhanced protection of metals from corrosion.10 Silane coupling agents have three main advantages: (i) they are commercially available in a large scale, (ii) at one end, they have hydrolysable alkoxy groups capable of reacting with OH− rich surface and (iii) at the other end they have a large number of non-hydrolysable organic moieties, which are reactive towards other functional groups and metallic substrates.11 Among the hybrid silica sol–gel coating materials, epoxy functionalized sol–gel coatings have drawn greater attention not only due to presence of reactive epoxy group but also due to their mild preparation conditions.12 The surface pre-treatment of various metals or alloys like aluminium, copper, magnesium and steel by epoxy hybrid sol–gel coatings have been extensively studied.12 Even though epoxy functionalized hybrid coatings render better corrosion protection to various metals, it has poor adhesion to copper substrate due to the difficulty in the formation of Si–O–Cu bonds between Si–OH and copper surface.13 To overcome this drawback, organic corrosion inhibitors were added into the epoxy resins to improve the adhesion through chemisorption of these inhibitors on copper surface.14,15 In particular, organic compounds with hetero atoms like nitrogen, oxygen and sulphur have been extensively reported as good copper corrosion inhibitors due to their chelating action and the formation of an insoluble diffusion barrier on the substrate.16–18 The major drawback of using organic inhibitors lies in their inherent toxicity. Hence, the research has been directed towards green corrosion inhibitors with low/zero environmental impact. Recently, Song et al.19 studied the protection ability of cysteamine (CA) monolayers on copper corrosion. To the best of our knowledge, there are no reports on the usage of CA in the sol–gel system for the protection of copper from corrosion. In the present work, hybrid sol–gel coating (Hy) consisting of 3-glycidoxypropyltrimethoxysilane (GPTMS) and tetraethoxysilane (TEOS) were assembled on to the CA modified copper surface. The formed twin layers were characterized using Fourier transform infrared (FT-IR) spectroscopy, energy-dispersive X-ray spectroscopy (EDX), scanning electron microscopy (SEM) and atomic force microscopic (AFM) techniques, while cyclic voltammetry (CV), electrochemical impedance spectroscopy (EIS) and potentiodynamic polarization studies (PDS) were used to evaluate the corrosion protection ability of the formed twin layers.
2. Experimental
2.1 Materials and chemicals
CA, GPTMS and TEOS were purchased from Sigma-Aldrich (India) and used as received. All the chemicals used in this study were of analytical grade and the solutions were prepared using double distilled water.
2.2 Cysteamine solution and hybrid sol preparation
Aqueous solution of CA (0.01 M) was used as a precursor solution and the pH was adjusted to 5.0 by adding 0.1 M HCl. The hybrid silica sol was prepared by mixing GPTMS, TEOS and H2O in the molar ratio of 3.0![[thin space (1/6-em)]](https://www.rsc.org/images/entities/char_2009.gif) :1.0:1.5 and the pH was tuned to 4.0 by adding 0.1 M HNO3.12 The resulting sol was subjected to hydrolysis for 12 h at room temperature. The molar ratio of n (GPTMS) epoxy: n (CA) amine cross-linking reaction was 3.0:2.0.
:1.0:1.5 and the pH was tuned to 4.0 by adding 0.1 M HNO3.12 The resulting sol was subjected to hydrolysis for 12 h at room temperature. The molar ratio of n (GPTMS) epoxy: n (CA) amine cross-linking reaction was 3.0:2.0.
2.3 Pre-treatment of electrodes
The working electrode was made from copper (99.99%) rod embedded in a Teflon sheath with an approximate surface of about 0.75 cm2. It was successively polished with different grades of emery papers (80–240 grit). The polished copper electrode was treated in an ultrasonic bath with ethanol and acetone for 10 min. Subsequently, the specimens were etched with 7 N HNO3 for 30 s and then washed with double distilled water and dried to get fresh, reactive and oxide-free copper specimens.20
2.4 Formation of self-assembled monolayers
The pre-treated electrodes were immersed in acidified aqueous solution of CA (0.01 M) for 5 h to form CA SAM over copper surface.19 Then, the modified electrodes were washed thoroughly with double distilled water to remove the physically adsorbed CA and were marked as CA/Cu. Subsequently, Hy monolayers were assembled by immersing the CA/Cu electrode into the hybrid sol for 6 h. The tailored electrodes were rinsed first with double distilled water and then with methanol, which were designated as Hy/CA/Cu. For comparative study, the experiment was repeated with bare copper electrode forming the self-assembled Hy monolayers directly without pre-modification (denoted as Hy/Cu). Finally, Hy/Cu and Hy/CA/Cu electrodes were subjected to curing at 100 °C for 1 h.
2.5 Characterization of monolayers by FT-IR spectroscopy
Fourier transform infrared (FT-IR) spectra of pure CA as well as those of modified electrodes such as Hy/Cu, CA/Cu, Hy/CA/Cu were recorded using JASCO 460 plus model spectrometer in the absorption mode with a frequency range between 4000–400 cm−1. The IR spectra of the coated substrates were recorded after scratching the respective films formed over copper surface.
2.6 Surface and elemental analyses
Surface morphology of bare and modified copper surfaces viz., Hy/Cu, CA/Cu and Hy/CA/Cu was monitored using VEGA3TESCAN scanning electron microscopy. AFM images were obtained using Multimode Scanning Probe Microscope (NTMDT NTEGRA Prima) and the analysis was performed seven times to get statistically acceptable values. The elemental analysis of the samples was carried out using an EDX (Bruker, Nano GMBH X′ Flash Detector, 5010 model, Germany) spectrometer.
2.7 Electrochemical measurements
The electrochemical behaviour of bare and modified copper electrodes was studied using cyclic voltammetry (CV), electrochemical impedance spectroscopy (EIS) and potentiodynamic polarization studies (PDS), which were performed using a potentiostat (VersaSTAT3-400, AMETEK Princeton Applied Research, Tennessee, USA) instrument with in-built Versa studio software. The measurements were carried out in a conventional three-electrode compartment (corrosion cell kit) consisting of bare copper or Hy/Cu or CA/Cu or Hy/CA/Cu electrodes as working electrode, while saturated calomel electrode (SCE) and platinum (Pt) wire served as reference and counter electrodes respectively. At first, the working electrode was immersed in the test solution for 1 h to attain stable open circuit potential (OCP) and the changes were recorded as a function of exposure time. CV measurements were carried through the scanning potential from −1.0 V (SCE) to +1.0 V (SCE) at a scan rate of 20 mV s−1. EIS analysis was performed at OCP with the AC voltage amplitude of ±5 mV in the frequency range from 100 KHz to 0.1 Hz. The polarization studies were carried out from a cathodic potential of −0.5 vs. SCE/V to an anodic potential of +0.2 vs. SCE/V at a scan rate of 2 mV s−1 in 1% NaCl medium. CV experiments were performed ten times, whereas EIS and PDS experiments were performed twice and very good repeatability was achieved.
3. Results and discussion
In the present study, CA was assembled over copper surface initially and subsequently Hy sol–gel layers consisting of GPTMS and TEOS were packed over the CA tailored copper surface. The schematic representation of self-assembly of CA and Hy sol–gel twin layers onto copper surface is given in Scheme 1.21,22 The self-assembly occurs via three steps. First, the head group (–SH) of CA chemically binds to the copper surface. Then, the adsorbed aliphatic layers undergo self-organization process through van der Waals interaction in the second step. In the third step, the free NH2 group (tail group) in CA undergoes cross linking reaction with epoxy (head group) moiety of Hy sol–gel, through physical interaction (or) chemical bonding thereby enhancing the binding capacity of second coating.6,7
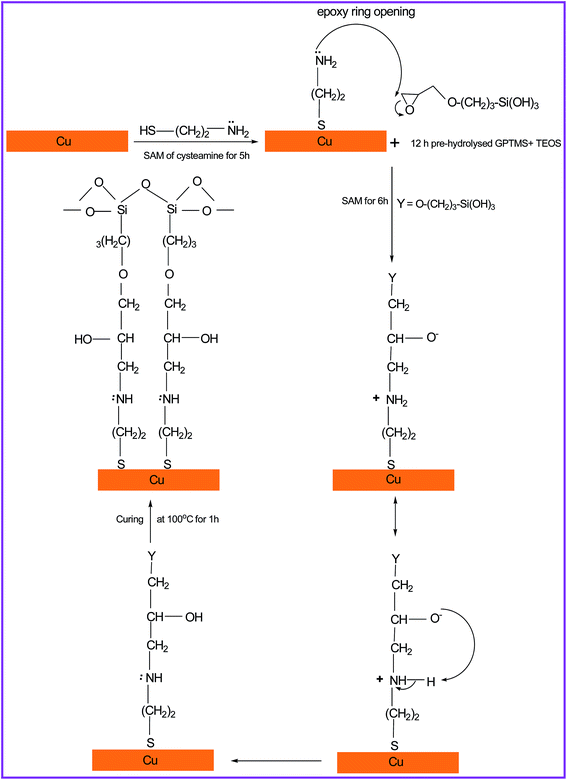 |
| | Scheme 1 Schematic representation of self-assembly of cysteamine (CA) and hybrid silica sol–gel (Hy) onto the copper surface. | |
3.1 Characterization of self-assembled monolayers
The characterization of Hy/Cu, CA/Cu and Hy/CA/Cu electrodes were undertaken by FT-IR, SEM, EDX and AFM analyses and the results are presented here.
3.1.1 FT-IR analysis. Fig. 1 and 2 show the IR spectra of pure CA, CA/Cu, Hy/Cu and Hy/CA/Cu respectively. In the case of pure CA (Fig. 1a), the absorption bands appeared at 3467 cm−1 and 1704 cm−1 which could be related to stretching and bending vibrations of N–H (–NH2) respectively. An absorption band observed around 2900 cm−1 could be due to the C–H stretching vibrations and its corresponding out of plane deformation was observed around 900 cm−1. In addition to that, the characteristic S–H stretching vibration was observed at 2467 cm−1. However, in the FT-IR spectrum of CA/Cu electrode (Fig. 1b) this characteristic S–H stretching vibration was not found, which revealed the coordination of CA with copper through S atom.23 Besides, it also showed characteristic stretching and bending vibrations of N–H group of free tail NH2 groups. Fig. 2 shows the IR spectra of Hy/Cu and Hy/CA/Cu. The absorption in the range of 3400–3000 cm−1 could be assigned to the stretching vibrations of silanol groups (Si–OH) that were formed during the hydrolysis of alkoxy groups in GPTMS and TEOS and its corresponding bending vibration was observed at 1635 cm−1. The FT-IR spectrum of Hy/Cu (Fig. 2a) displayed an absorption band at 2941 cm−1 which could be due to the alkyl hydrogen stretching and its corresponding bending vibration was observed at 1481 cm−1. The silica network was characterized by the strong absorptions at 1098, 788 and 468 cm−1, corresponding to the Si–O–Si asymmetric stretching, symmetric stretching and bending modes of vibrations respectively. The absorption bands at 1207 cm−1 (ring breathing) and 907 cm−1 (asymmetric stretching) were associated with epoxy ring of GPTMS. However, in the IR spectrum of Hy/CA/Cu, these bands disappeared and two absorption bands at 1618 cm−1 and 1044 cm−1 appeared corresponding to the N–H bending and C–N stretching vibrations.24 Thus it could be inferred from IR analysis, that CA got assembled over copper surface through sulphur atom with its free tail NH2 groups undergoing cross-linking reaction with epoxy ring of Hy sol–gel layers.
 |
| | Fig. 1 FT-IR spectra of (a) pure CA and (b) CA/Cu. | |
 |
| | Fig. 2 FT-IR spectra of (a) Hy/Cu and (b) Hy/CA/Cu. | |
3.1.2 Surface morphological and elemental studies. The formation of Hy monolayers over copper surface could be substantiated from the appearance of Si peak at 1.89 keV in the EDX spectrum. The as-formed Hy layer carried pores and cracks on the surface, which revealed the poor binding capacity of Hy monolayers onto the copper surface (Fig. 3a). On the other hand, the CA/Cu electrode surface was relatively smooth and its corresponding EDX spectrum confirmed the successful assembly of CA over copper surface through the existence of peaks at 2.15 keV and 0.42 keV accounting for S and N elements respectively (Fig. 3b). The Hy/CA/Cu electrode exhibited similar EDX pattern as that of CA/Cu surface with an additional intense Si peak (1.89 keV). It revealed the homogeneous assembly of Hy monolayers over CA modified copper surface (Fig. 3c). Fig. 4 and 5 represent the 3-D, 2-D and height profile of polished copper, bare and modified copper specimens after 1 h of immersion in 1% NaCl solution and their corresponding roughness and height profile values are listed in Table 1. The polished copper surface was considered as a benchmark for comparison. The AFM image of the freshly polished copper surface looked uniform with some tiny scratches (Fig. 4a and 5a), while upon NaCl treatment, the copper surface was severely damaged due to corrosion (Fig. 4b and 5b). Besides, Hy/Cu surface (Fig. 4c and 5c) appeared rough with potholes but not as bad as the bare copper immersed in NaCl solution. However, CA/Cu surface (Fig. 4d and 5d) was fairly smooth compared to those of bare copper and Hy/Cu specimens immersed in NaCl. In case of Hy/CA/Cu substrate (Fig. 4e and 5e), the surface was relatively smooth which revealed the formation of insulating, homogenous and compact Hy monolayers over CA modified copper surface.25,26 It was further corroborated by height profile values (Table 1).
 |
| | Fig. 3 SEM images and EDX spectra of (a) Hy/Cu (b) CA/Cu, and (c) Hy/CA/Cu electrodes. | |
 |
| | Fig. 4 3-D topographic images of (a) polished copper, (b) bare copper, (c) Hy/Cu, (d) CA/Cu and (e) Hy/CA/Cu surfaces after 1 h exposure in 1% NaCl. | |
 |
| | Fig. 5 Cross-sectional line scan and 2-D images of (a) polished copper, (b) bare copper, (c) Hy/Cu, (d) CA/Cu and (e) Hy/CA/Cu surfaces after 1 h exposure in 1% NaCl. | |
Table 1 Root-mean square roughness and height profile values (nm) of polished copper, bare copper, Hy/Cu, CA/Cu and Hy/CA/Cu after 1 h exposure in 1% NaCl
| S. no. |
Electrodes |
Root-mean square ± SD |
Height profile ± SD |
| 1 |
Polished copper |
10.38 ± 0.04 |
50 ± 0.13 |
| 2 |
Bare copper |
85.30 ± 0.13 |
785 ± 0.03 |
| 3 |
Hy/Cu |
78.68 ± 0.05 |
463 ± 0.09 |
| 4 |
CA/Cu |
32.10 ± 0.13 |
214 ± 0.04 |
| 5 |
Hy/CA/Cu |
4.78 ± 0.07 |
29 ± 0.09 |
3.2 Corrosion protection performance analysis
In order to examine the protection efficiency, the bare and modified specimens were subjected to variety of electrochemical analysis like CV, PDS and EIS in 1% NaCl solution.
3.2.1 Open circuit potential studies. The open circuit potential (OCP) acts as an indicator, which provides information about the metal/solution interface. The steady-state condition on electrode surface ensures the reliability of electrochemical measurements.27 From the plot of corrosion potentials (Ecorr) of bare copper and modified copper electrodes against immersion time (t), it is clear that the stable corrosion potential could be reached in about 1 h (Fig. 6). All the electrochemical measurements were carried out after the stabilization of the electrode at OCP for 1 h at room temperature.28
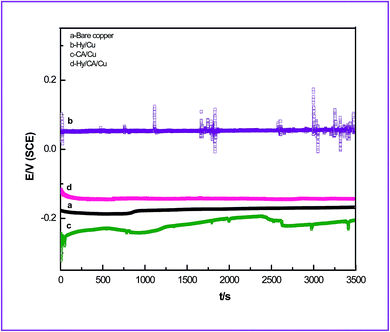 |
| | Fig. 6 Open circuit potential (Eocp)–time plots of (a) bare copper, (b) Hy/Cu, (c) CA/Cu, and (d) Hy/CA/Cu electrodes in 1% NaCl. | |
3.2.2 Cyclic voltammetric studies. The electrochemical behavior of the bare and tailored electrodes was studied using cyclic voltammetry. Fig. 7 shows the cyclic voltammograms obtained for (a) bare copper, (b) Hy/Cu, (c) CA/Cu and (d) Hy/CA/Cu electrodes by immersing in 1% NaCl solution. For bare copper electrode (plot-a), two oxidation wave intensities were observed at about +0.22 V and +0.38 V (vs. SCE) in the forward scan, designated as I and II respectively. The oxidation wave intensities I and II could probably be due to the formation of CuCl layer and soluble CuCl2− species respectively.29 In the reverse scan, a single reduction wave intensity was observed at −0.41 V, which could be related to the partial reduction of CuCl to metallic copper state. In addition to that, in the reverse scan a characteristic anodic hump appeared at +0.11 V due to the competition between dissolution and precipitation of corrosion products on the copper surface, with dissolution overtaking the precipitation process.29 The bare and modified electrodes showed analogous redox patterns in the cyclic voltammogram with less wave intensities. It can be seen from Fig. 7 and Table 2, that the redox wave intensities and area of CV curves of CA/Cu electrode (plot-c) was much less than those of bare copper (plot-a) and Hy/Cu electrodes (plot-b). The differences were attributed to the formation of coordination bond between CA and copper through sulphur atom. For Hy/CA/Cu electrode (plot-d), the redox wave intensities decreased due to the copper-thiolate bonds and siloxane linkages. Thus it is clear that twin layers effectively inhibited the redox process and demonstrated greater protection efficiency than singly grafted layers towards copper corrosion.
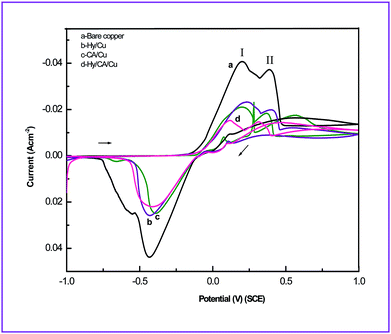 |
| | Fig. 7 Cyclic voltammograms of (a) bare copper, (b) Hy/Cu, (c) CA/Cu, and (d) Hy/CA/Cu electrodes in 1% NaCl. | |
Table 2 Peak potential, oxidative and reductive current density of bare copper, Hy/Cu, CA/Cu and Hy/CA/Cu electrodes
| Type of electrodes |
Anodic peak I potential ± SD (V) |
Anodic peak II potential ± SD (V) |
Cathodic peak potential ± SD (V) |
Reductive current density (mA cm−2) |
Oxidative current density (mA cm−2) |
Area of CV curve (10−4 cm2 gV−1) ± SD |
| Bare copper |
+0.22 ± 0.01 |
+0.38 ± 0.01 |
−0.41 ± 0.01 |
+43.63 |
−40.44 |
−24.21 ± 0.02 |
| Hy/Cu |
+0.21 ± 0.01 |
+0.40 ± 0.01 |
−0.40 ± 0.01 |
+25.66 |
−23.10 |
−13.61 ± 0.04 |
| CA/Cu |
+0.18 ± 0.01 |
+0.37 ± 0.02 |
−0.38 ± 0.01 |
+24.79 |
−20.98 |
−7.29 ± 0.02 |
| Hy/CA/Cu |
+0.10 ± 0.02 |
+0.30 ± 0.01 |
−0.42 ± 0.01 |
+21.95 |
−15.16 |
−6.98 ± 0.06 |
3.2.3 Potentiodynamic polarization studies. In order to know the kinetics of cathodic and anodic reactions, potentiodynamic polarization measurements were carried out. Fig. 8 presents the polarization curves of bare and assembled copper electrodes after 1 h exposure in 1% NaCl solution. Generally, the cathodic polarization behaviour of bare copper was determined either by the hydrogen evolution (at initial measurement) or by oxygen reduction (at more positive potential close to Ecorr).30| | |
O2 + 2H2O + 4e− → 4OH−
| (1) |
 |
| | Fig. 8 Polarization curves of (a) bare copper, (b) Hy/Cu, (c) CA/Cu and (d) Hy/CA/Cu electrodes in 1% NaCl. | |
But in most of the cases, the cathodic corrosion reaction of bare copper in NaCl solution is the reduction of oxygen.30 Whereas, the anodic polarization behaviour of bare copper consists of electrodissolution and diffusion processes.30,31
| | |
CuCl2− → Cu2+ + 2Cl− + e−
| (4) |
The sweeping potential of bare copper appeared at −0.20 V vs. Ecorr in the anodic region.32 The bare copper consists of three distinct regions in anodic polarization curve viz., the active dissolution region (apparent Tafel region), transpassive region and the limiting region. The first irreversible reaction close to the corrosion potential (apparent Tafel region) could be attributed to the oxidation of copper which leads to the formation of CuCl film (electrodissolution). Thus, the as-formed CuCl film over copper surface acts as a physical barrier between the metal and solution. In fact, the stability of this barrier controls the anodic dissolution rate. Under higher potential CuCl film reacts with excess of Cl− ions to form a soluble CuCl2− species (transpassive region), which can easily diffuse from the outer Helmholtz plane into the bulk solution (diffusion process). Above this region, a new mixed-kinetics region appeared due to the formation of divalent copper species as a result the current increases steeply was considered as limiting region.33–35 Fig. 8 showed that the Hy/CA/Cu electrode not only inhibited the anodic metal dissolution but also suppressed the cathodic oxygen reduction reaction effectively. The dynamic parameters such as corrosion current (icorr) and corrosion potential (Ecorr) were determined by extrapolating the polarization curves and they are summarized in Table 3. The inhibition efficiency (η) was calculated by the following equation.36
| |
 | (5) |
where,
i0corr and
icorr correspond to current densities of bare copper and modified copper electrodes respectively. As evidenced from
Table 3, the sequence of inhibition efficiency of the tailored surfaces in 1% NaCl is as follows Hy/CA/Cu (96%) > CA/Cu (80%) > Hy/Cu (42%). The higher protection efficiency of CA/Cu than Hy/Cu electrode, which could be attributed to the strong interaction of CA with copper through sulphur atom, while the poor protection of Hy monolayers over copper corrosion could be due to the difficulty of formation of Cu–O–Si bonds.
37 The results of potentiodynamic polarization studies validated that, the twin layers restrained both anodic and cathodic corrosion reactions to a larger extent displaying better surface protection.
Table 3 Polarization parameters of bare copper, Hy/Cu, CA/Cu and Hy/CA/Cu electrodes in 1% NaCl
| Electrode |
−Ecorr (mV vs. SCE) |
icorr (μA cm−2) |
η (%) |
| Bare copper |
278 |
3.175 |
— |
| Hy/Cu |
198 |
1.836 |
42.17 |
| CA/Cu |
223 |
0.631 |
80.12 |
| Hy/CA/Cu |
217 |
0.100 |
96.85 |
3.2.4 Electrochemical impedance spectroscopy. The corrosion behavior, reaction mechanism and electro-kinetics could be evaluated by a rapid, non-destructive and convenient electrochemical impedance spectroscopy (EIS) technique.33 Fig. 9A–C shows the Nyquist and Bode plots obtained for bare copper, Hy/Cu, CA/Cu and Hy/CA/Cu electrodes after 1 h of immersion in 1% NaCl solution respectively. Inset of Fig. 9A shows the Nyquist plot of bare copper with a depressed semicircle at high frequency and a long straight line at low frequency. The depressed semicircle in the high frequency region may be caused by the frequency dispersion, which could be attributed to the roughness and heterogeneities of the electrode surface.33 The low frequency tail, generally referred to as Warburg impedance, is caused due to (i) the transportation of soluble copper species from electrode surface to bulk solution and the (ii) diffusion of dissolved oxygen from the bulk solution to the copper surface.38 Therefore, due to the dispersing effect, a pure capacitor was substituted by a constant phase element (CPE) to fit the EIS data more accurately.39 The admittance and impedance of CPE are expressed40 in eqn (6) and (7)where Y0 is the proportionality factor, j is the imaginary root (j = (−1)1/2), ω is the angular frequency, and n is the surface irregularity factor (0.5 ≤ n ≤ 1). The values of n are usually related to the roughness of the electrode surface. Smaller the n value higher will be the surface roughness.41 When n = 0.5, the CPE represents a Warburg impedance. If the electrode surface is homogeneous (free from defects) and flat, the exponential value (n) becomes equal to 1 and the metal solution interface acts as an ideal capacitor with regular surface.42 The Nyquist plots of bare and modified copper electrodes were analyzed using four different equivalent circuits (Fig. 10).26 Model ‘a’ and ‘b’ involving Warburg impedance were used to analyze the EIS data of bare copper and Hy/Cu electrodes, while model ‘c’ and ‘d’ were used for Hy/Cu and Hy/CA/Cu electrodes respectively. In these equivalent circuits, Rs represents the ohmic resistance between the working and reference electrodes; Rh is the resistance of Hy monolayers; Rt is the resistance of CA monolayers. Similarly Rct represents the charge transfer resistance related to corrosion reaction at metal/solution interface. The electrochemical parameters and inhibition efficiency values were calculated from the fitted data using the following equation and are presented in Table 4.43| |
 | (8) |
 |
| | Fig. 9 Nyquist (A) and Bode (B and C) plots of bare copper, Hy/Cu, CA/Cu and Hy/CA/Cu electrodes in 1% NaCl. | |
 |
| | Fig. 10 Proposed equivalent circuits of (a) bare copper, (b) Hy/Cu, (c) CA/Cu and (d) Hy/CA/Cu electrodes. | |
Table 4 Impedance parameters of bare copper, Hy/Cu, CA/Cu and Hy/CA/Cu electrodes in 1% NaCl
| |
Bare copper |
Hy/Cu |
CA/Cu |
Hy/CA/Cu |
| Rs (Ω) |
32 |
64 |
47 |
38 |
| Rh (kΩ) |
— |
0.634 |
— |
0.964 |
| nh |
— |
0.56 |
— |
0.74 |
| Qh (sn Ω−1 cm−2) |
— |
2.91 × 10⁻⁵ |
— |
3.56 × 10⁻⁶ |
| Qt (sn Ω−1 cm−2) |
— |
— |
|
0.16 |
| nt |
— |
— |
0.63 |
0.64 |
| Rt (kΩ) |
— |
— |
2.304 |
1.429 |
| Qdl (sn Ω−1 cm−2) |
6.79 × 10⁻⁵ |
2.08 × 10⁻⁵ |
1.50 × 10⁻⁶ |
1.02 × 10⁻⁶ |
| ndl |
0.60 |
0.65 |
0.81 |
0.96 |
| Rct (kΩ) |
1.020 |
3.097 |
12.358 |
69.617 |
| Normalized Rct (kΩ cm2) |
1.360 |
4.130 |
16.510 |
92.822 |
| W (Ω−1 cm−2 s0.5) |
314 |
439 |
— |
— |
| Inhibition efficiency using normalized Rct (η) |
— |
67.0 |
91.7 |
98.5 |
Here the Rct(f) and Rct(b) are the charge transfer resistance of modified and bare copper electrodes respectively. As inferred from Table 4, the Rct values of modified electrodes are evidently higher than those of bare copper electrode and the diameter of Nyquist loop for Hy/CA/Cu electrode was larger than those of other modified electrodes, indicating the substantial decrease in the copper dissolution. The densely packed monolayers significantly lowered the Qdl value and the decrease of Qdl value is a reasonable proof for the enhancement of corrosion resistance.43 Inspection of Table 4 reveals that in the case of Hy/CA/Cu electrode the Qdl decreased to a large extent due to the decrease in dielectric constant or increase in the thickness of the electrical double layer. In addition, the value of n reaches a maximum value of about 0.96 for Hy/CA/Cu electrode which revealed a considerable decrease of surface inhomogeneity due to the SAM adsorbed on most of the active centres.44 Fig. 9B and C represent the phase angle–frequency and Z modulus–frequency plots of bare and modified copper electrodes. In general, higher the phase angle greater is the inhibition efficiency. As inferred from Fig. 9B, that Hy/CA/Cu electrode exhibited a maximum phase angle value and its phase angle plot is wider than those of other systems. The overlapping of time constants, due to interaction between Hy monolayers and CA modified copper surface could well be cause for the same.45 The corrosion resistance of SAMs on electrodes can be quantitatively evaluated by the low-frequency impedance values (Zlf).42 It can be seen from Fig. 9C that the Z modulus of modified copper electrodes was steadily increased over the whole frequency range, especially for Hy/CA/Cu surface, which could be ascribed to the formation of homogeneous and protective film over copper surface.45 The results of EIS measurement reasonably agreed with those of PDS analysis.
4. Conclusions
Grafting of Hy sol–gel monolayers over CA tailored copper surface forms a successful strategy to protect the copper from getting corroded in neutral medium. Copper-thiolate bonds formed by the CA treatment and subsequent interaction of NH2 with the epoxide ring ensure a smooth, homogeneous protective layer over metallic surface. This method of twin layer grafting over copper can be exploited for protection of metallic surfaces in industrial operations.
Acknowledgements
The authors are grateful to the Board of Research in Nuclear Sciences (BRNS), Department of Atomic Energy (DAE), Mumbai, Government of India, for the financial support for this work through a major research project on “Sol–Gel” (no. 2011/37C/55/BRNS).
Notes and references
- S. Yuan, S. O. Pehkonen, B. Liang, Y. P. Ting, K. G. Neoh and E. T. Kang, Corros. Sci., 2011, 53, 2738 CrossRef CAS PubMed.
- Z. Chai, Y. Liu, J. Li, X. Lu and D. He, RSC Adv., 2014, 4, 50503 RSC.
- W. Chen, S. Hong, H. B. Li, H. Q. Luo, M. Li and N. B. Li, Corros. Sci., 2012, 61, 53 CrossRef CAS PubMed.
- D. Wang, B. Xiang, Y. Liang, S. Song and C. Liu, Corros. Sci., 2014, 85, 77 CrossRef CAS PubMed.
- Y. C. Pan, Y. Wen, X. Y. Guo, P. Song, S. Shen, Y. P. Du and H. F. Yang, Corros. Sci., 2013, 73, 274 CrossRef CAS PubMed.
- A. Ulman, Chem. Rev., 1996, 96, 1533 CrossRef CAS PubMed.
- C. Vericat, M. E. Vela, G. Corthey, E. Pensa, E. Cortés, M. H. Fonticelli, F. Ibañez, G. E. Benitez, P. Carro and R. C. Salvarezza, RSC Adv., 2014, 4, 27730 RSC.
- M. L. Zheludkevich, I. Miranda Salvadob and M. G. S. Ferreira, J. Mater. Chem., 2005, 15, 5099 RSC.
- M. Pagliaro, R. Ciriminna and G. Palmisano, J. Mater. Chem., 2009, 19, 3116 RSC.
- H. Fan, S. Li, Z. Zhao, H. Wang, Z. Shi and L. Zhang, Corros. Sci., 2011, 53, 4273 CrossRef CAS PubMed.
- S. Shokoohi, A. Arefazar and R. Khosrokhavar, J. Reinf. Plast. Compos., 2008, 27, 473 CrossRef CAS PubMed.
- S. Peng, W. Zhao, H. Li, Z. Zeng, Q. Xue and X. Wu, Surf. Coat. Technol., 2012, 213, 175 CrossRef CAS PubMed.
- F. Zucchi, V. Grassi, A. Frignani and G. Trabanelli, Corros. Sci., 2004, 46, 2853 CrossRef CAS PubMed.
- R. B. Vignesh and M. G. Sethuraman, Prog. Org. Coat., 2014, 77, 136 CrossRef CAS PubMed.
- N. Karthik and M. G. Sethuraman, Ionics, 2014 DOI:10.1007/s11581-014-1274-1.
- H. Tian, W. Li, K. Cao and B. Hou, Corros. Sci., 2013, 73, 281 CrossRef CAS PubMed.
- M. Levin, P. Wiklund and C. Leygraf, Corros. Sci., 2012, 58, 104 CrossRef CAS PubMed.
- G. Gece, Corros. Sci., 2011, 53, 3873 CrossRef CAS PubMed.
- P. Song, X. Y. Guo, Y. C. Pan, S. Shen, Y. Sun, Y. Wen and H. F. Yang, Electrochim. Acta, 2013, 89, 503 CrossRef CAS PubMed.
- B. V. A. Rao, M. Y. Iqbal and B. Sreedhar, Corros. Sci., 2009, 51, 1441 CrossRef PubMed.
- P. Innocenzi, T. Kidchob and T. Yoko, J. Sol-Gel Sci. Technol., 2005, 35, 225 CrossRef CAS PubMed.
- J. Clayden, N. Greeves, S. Warren and P. Wothers, Organic Chemistry, Oxford University Press Inc., New York, 1st edn, 2001 Search PubMed.
- R. Kuang, X. Kuang, S. Pan, X. Zheng, J. Duan and Y. Duan, Microchim. Acta, 2010, 169, 109 CrossRef CAS.
- S. Kumar, J. Singh, A. A. Agarwal, M. Ahamad and B. D. Malhotra, Anal. Methods, 2011, 3, 2237 RSC.
- G. Mu and X. Li, J. Colloid Interface Sci., 2005, 289, 184 CrossRef CAS PubMed.
- A. K. Singh and M. A. Quraishi, Corros. Sci., 2011, 53, 1288 CrossRef CAS PubMed.
- F. Mansfeld and B. Little, Corros. Sci., 1991, 32, 247 CrossRef CAS.
- S. Ghareba and S. Omanovic, Corros. Sci., 2010, 52, 2104 CrossRef CAS PubMed.
- Y. M. Lee, Y. H. C. Chien, M. K. Leung, C. C. Hu and C. C. Wan, J. Mater. Chem. A, 2013, 1, 3629 CAS.
- M. Finšgar and D. K. Merl, Corros. Sci., 2014, 80, 82 CrossRef PubMed.
- G. Kear, B. D. Barker and F. C. Walsh, Corros. Sci., 2004, 46, 109 CrossRef CAS.
- M. Finšgar, Corros. Sci., 2013, 72, 82 CrossRef PubMed.
- A. L. Bacarella and J. C. Griess, J. Electrochem. Soc., 1973, 120, 459 CrossRef CAS PubMed.
- P. Wang, D. Zhang, R. Qiu and J. Wu, Corros. Sci., 2014, 83, 317 CrossRef CAS PubMed.
- Ž. Petrović, M. M. Huković, J. Harvey and S. Omanovic, Phys. Chem. Chem. Phys., 2010, 12, 6590 RSC.
- N. Karthik and M. G. Sethuraman, Mater. Corros., 2014, 65, 982 CrossRef CAS.
- V. Subramanian and W. J. van Ooij, Corrosion, 1998, 54, 204 CrossRef CAS.
- H. P. Lee and K. Nobe, J. Electrochem. Soc., 1986, 133, 2035 CrossRef CAS PubMed.
- F. Mansfeld, Corrosion, 1981, 37, 301 CrossRef CAS.
- I. D. Raistrick, D. R. Franceschetti and J. R. Macdonald, Impedance Spectroscopy Theory, Experiment, and Application, John Wiley & Sons Inc., Hoboken, New Jersey, 2nd edn, 2005 Search PubMed.
- M. A. Amin, K. F. Khaled, Q. Mohsen and H. A. Arida, Corros. Sci., 2010, 52, 1684 CrossRef CAS PubMed.
- N. Karthik, V. Arunkumar and M. G. Sethuraman, J. Mater. Sci., 2014, 49, 7970 CrossRef CAS.
- S. Peng, W. Zhao, H. Li, Z. Zeng, Q. Xue and X. Wu, Appl. Surf. Sci., 2013, 276, 284 CrossRef CAS PubMed.
- M. Ormellese, L. Lazzari, S. Goidanich, G. Fumagalli and A. Brenna, Corros. Sci., 2009, 51, 2959 CrossRef CAS PubMed.
- R. T. Sakai, F. M. Di, L. da Cruz, H. G. de Melo, A. V. Benedetti, C. V. Santilli and P. H. Suegama, Prog. Org. Coat., 2012, 74, 288 CrossRef CAS PubMed.
|
| This journal is © The Royal Society of Chemistry 2015 |
Click here to see how this site uses Cookies. View our privacy policy here. 


