Tunability of monodispersed intermetallic AuCu nanoparticles through understanding of reaction pathways†
S. K. Sinhaa,
C. Srivastavaa,
S. Sampathb and
K. Chattopadhyay*a
aDepartment of Materials Engineering, Indian Institute of Science, Bangalore-560 012, India. E-mail: kamanio@materials.iisc.ernet.in
bDepartment of Inorganic and Physical Chemistry, Indian Institute of Science, Bangalore-560 012, India
First published on 9th December 2014
Abstract
Synthesis of size selective monodispersed nanoparticles particularly intermetallic with well-defined compositions represents a challenge. This paper presents a way for the synthesis of intermetallic AuCu nanoparticles as a model system. We show that reduction of Au and Cu precursors is sensitive to the ratio of total molar concentrations of surfactant to metal precursors. A careful design of experiments to understand the kinetics of the reduction process reveals initial formation of seed nanoparticles of pure Au. Reduction of Cu occurs on the surface of the seed followed by diffusion to yield AuCu. This understanding allows us to develop a two step synthesis where the precise size controlled seed of Au nanoparticles produced in the first step is used in the second step reaction mixture as an Au precursor to allow deposition and interdiffusion of Cu that yields size selected AuCu intermetallics of sub 10 nm sizes.
Introduction
Alloy nanoparticles have received wide scientific and technological attention due to their unique and tunable properties.1–8 Within the nano-size regime, minor alterations in shape and size of nanoparticles produce appreciable changes in the properties.9–12 Alterations in size and shape are however non-trivial and require precise control over the nanoparticle nucleation and growth processes. The complexity is further enhanced in case of multi-component nanoparticles where a synergistic realization of “desired” composition and size/shape is an essential requirement. Therefore, a substantial part of the literature on nano-sized particles is devoted towards formulating novel synthetic methodologies to suitably engineer the particle formation mechanism in order to produce nanoparticles of various shapes and sizes.13–20 In the case of methodologies that can be grouped under solution-based chemical techniques,21–30 control over the particle formation process can be exercised through suitable changes in the synthesis protocols and process variables. These variables typically are: type and amount of surfactants, type and amount of reducing agent(s), reaction mixture heating rate, reaction mixture reflux temperature and time, metal precursor type, etc. Among these variables, type and molar amounts of surfactant(s) are the two variables that have mostly been used by the researchers to alter shape and sizes of the nanoparticles.13,31 During the nanoparticle formation, surfactants get adsorbed on the surface of growing particles providing a capping layer that stabilizes them in solution and mediates their growth by providing controlled stearic hindrance to the transfer of atoms from the reaction solution to the growing nanoparticles.19,32,33 It has also been reported that surfactants alter the relative rates of nucleation and growth of the nanoparticles by attaching strongly to the reduced precursor metal atoms in the reaction mixture thus controlling the reaction mixture supersaturation with respect to the zero valent metal atoms.34 Although the literature contains reports on the use of type and amount of surfactant(s) as a synthesis process variable to manipulate bi-metallic nanoparticle sizes35–38 there are limited reports on the detailed investigation of the effect of both type and relative quantity of surfactant(s) on different stages of the synergistic evolution of composition, size and phase(s) of alloyed nanoparticles during their synthesis process. The literature also lacks comprehensive reports on the methodologies by which synthesis engineering can be conducted in order to tune alloy nanoparticle sizes while keeping the average composition and phase identity unaltered.The present manuscript addresses the above issue through a detailed study of the mechanism of formation of AuCu nanoparticles through the chemical synthesis route. Emphasis is on investigating the effect of molar ratio of surfactant-to-metal precursor and type of surfactant as process variables on size and compositional evolution of AuCu alloyed nanoparticles. Information obtained from the study of the mechanism was used to suitably engineer the nanoparticle synthesis process in order to produce alloyed equiatomic AuCu nanoparticles of different sub 10 nanometer sizes. Choice of Au–Cu system was guided by the fact that the literature contains reports on the synthesis of AuCu nanoparticles through wet chemical synthesis techniques39–46 which shows promising catalytic activity.47,48 Bauer et al.47 have shown that a suitable pre-treatment of AuCu nanoparticles supported on silica produces highly active and stable catalyst that facilitates 100% oxidation of CO. Kim et al.48 have demonstrated how the catalytic activity of ordered monolayers of monodisperse Au–Cu nanoparticles for reduction of CO2 depends on the electronic structure and the local atomic environment of the nanoparticles. In addition to their catalytic activity, there is an abundance of structural and thermodynamic data on Au–Cu system which makes it a model system for investigating size dependence of phase transformations in alloyed nanoparticles.49–54 However, achieving tunable intermetallic compositions of AuCu nanoparticles by chemical route is still synthetically challenging because of its small scale phase separations.55–57
Experimental
Synthesis of intermetallic AuCu nanocrystals
Modified polyol method was used to synthesize Au–Cu nanoparticles using tetracholoroauric acid H[AuCl4] as Au precursor, copper(II)acetylacetonate [Cu(acac)2] as Cu precursor, hexadecanediol (HDD) as reducing agent, oleylamine (OAm) and oleic acid (OA) as surfactants. To synthesize the nanoparticles, appropriate amounts of the metal precursors, surfactants and reducing agent were first dissolved in 10 mL of diphenyl ether solvent. Refer to Table S1† for the exact amounts of precursors that were used. This solution was then transferred into a three necked round bottom flask fitted with a thermometer, a reflux condenser and a magnetic stirrer. During the synthesis reaction an inert atmosphere was maintained inside the reaction flask by passing argon gas. The reaction mixture was heated to the boiling temperature of the reaction mixture (∼260 °C) and refluxed for 5 hours. After the reflux, heating was stopped and the reaction mixture containing nanoparticles was allowed to cool down to the room temperature under the inert atmosphere. At the room temperature, ethanol was added into the reaction mixture to precipitate the nanoparticles. The nanoparticles were then isolated by high speed centrifugation (7000 revolutions per minute).Five different nanoparticle dispersions were synthesized by using different ratios of total molar amounts of surfactants-to-metal precursors. These dispersions are identified as ‘dispersion X’ (X = 1, 2…5) in Table S1.† The different ratios of the total molar amount of surfactants-to-metal precursors used were 1![[thin space (1/6-em)]](https://www.rsc.org/images/entities/char_2009.gif) :
:![[thin space (1/6-em)]](https://www.rsc.org/images/entities/char_2009.gif) 1, 10
1, 10![[thin space (1/6-em)]](https://www.rsc.org/images/entities/char_2009.gif) :
:![[thin space (1/6-em)]](https://www.rsc.org/images/entities/char_2009.gif) 1, 20
1, 20![[thin space (1/6-em)]](https://www.rsc.org/images/entities/char_2009.gif) :
:![[thin space (1/6-em)]](https://www.rsc.org/images/entities/char_2009.gif) 1, 40
1, 40![[thin space (1/6-em)]](https://www.rsc.org/images/entities/char_2009.gif) :
:![[thin space (1/6-em)]](https://www.rsc.org/images/entities/char_2009.gif) 1 and 80
1 and 80![[thin space (1/6-em)]](https://www.rsc.org/images/entities/char_2009.gif) :
:![[thin space (1/6-em)]](https://www.rsc.org/images/entities/char_2009.gif) 1. It should be noted that in all the five cases, molar ratio of oleylamine-to-oleic acid and molar ratio of Au precursor-to-Cu precursor salt were always kept constant at 1
1. It should be noted that in all the five cases, molar ratio of oleylamine-to-oleic acid and molar ratio of Au precursor-to-Cu precursor salt were always kept constant at 1![[thin space (1/6-em)]](https://www.rsc.org/images/entities/char_2009.gif) :
:![[thin space (1/6-em)]](https://www.rsc.org/images/entities/char_2009.gif) 1.
1.
Characterization
X-Ray diffraction (XRD) technique was used for identifying phases and average sizes of nanoparticles. XRD profiles were obtained by using the X-Pert PRO, PANalytical X-ray diffractometer operating at 40 kV and 30 mA using a Cu-Kα radiation source. Specimens for the XRD based analysis were prepared by drop drying a dispersion of nanoparticles onto a glass slide. UV-Vis absorption spectrum from the nanoparticles was obtained by using a Lambda 750 Perkin Elmer UV-Vis double beam spectrophotometer employing wavelengths between 250 to 1200 nm and a 1 mm slit. Measurements were made in 0.5 nm steps and 5 scans were accumulated for each specimen. Quartz cuvette with a thickness of 2 mm was used for containing the nanoparticle dispersion for the experiment. A FEI ESEM Quanta scanning electron microscope (SEM) operating at 20 keV and fitted with an energy dispersive spectroscopy (EDS) detector was used for determining the average composition of the nanoparticles. Detailed transmission electron microscopy examinations of the samples including imaging under different modes, diffraction and composition analysis were carried out using a well calibrated FEI make tecnai transmission electron microscope (TEM) under both normal and scanning modes. Samples for the TEM based analysis was prepared by drop drying a highly dilute dispersion of nanoparticles onto an electron transparent carbon coated Ni grid.Results and discussion
Effect of surfactant amount on phase constitution and nanoparticle size
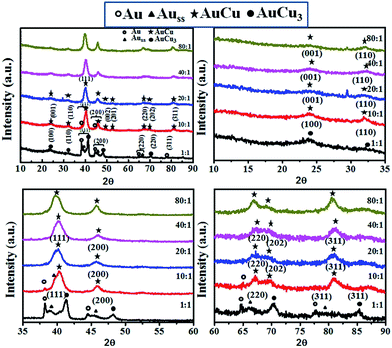
Evolution of phases as a function of surfactant to metal precursor molar ratio can be determined from the XRD profiles shown in Fig. 1(a–d). Fig. 1(a) contains XRD profiles for the full 2-theta range from 10 to 90; Fig. 1(b) contains XRD profiles for the 2-theta range of 10 to 35; Fig. 1(c) contains XRD profiles for the 2-theta range of 35 to 60; Fig. 1(d) contains XRD profiles for the 2-theta range of 60 to 90. The ratio of 1![[thin space (1/6-em)]](https://www.rsc.org/images/entities/char_2009.gif) :
:![[thin space (1/6-em)]](https://www.rsc.org/images/entities/char_2009.gif) 1 surfactant to metal precursor (dispersion 1) leads to nanoparticles of Au, solid solution of Cu in Au and the intermetallic AuCu3. Increasing the molar ratio to 10
1 surfactant to metal precursor (dispersion 1) leads to nanoparticles of Au, solid solution of Cu in Au and the intermetallic AuCu3. Increasing the molar ratio to 10![[thin space (1/6-em)]](https://www.rsc.org/images/entities/char_2009.gif) :
:![[thin space (1/6-em)]](https://www.rsc.org/images/entities/char_2009.gif) 1 yields pure Au and AuCu intermetallic particles. Increasing the ratio further, we observe formation of only intermetallic phase AuCu. The above results allow us to conclude that beyond a critical ratio of surfactant to precursor ratio of 10
1 yields pure Au and AuCu intermetallic particles. Increasing the ratio further, we observe formation of only intermetallic phase AuCu. The above results allow us to conclude that beyond a critical ratio of surfactant to precursor ratio of 10![[thin space (1/6-em)]](https://www.rsc.org/images/entities/char_2009.gif) :
:![[thin space (1/6-em)]](https://www.rsc.org/images/entities/char_2009.gif) 1, it is possible to synthesis AuCu nanoparticles. The composition analysis of the nanoparticles obtained in each case using SEM-EDS is presented in Table S1.†
1, it is possible to synthesis AuCu nanoparticles. The composition analysis of the nanoparticles obtained in each case using SEM-EDS is presented in Table S1.†
Average nanoparticle size obtained from the summation average of sizes of individual nanoparticles in dispersions 2 to 5 are 21 ± 3.2 nm, 17 ± 2.1 nm, 14 ± 2.3 nm, and 24 ± 3.3 nm respectively. Variation in the average size of solid solution AuCu nanoparticles with change in surfactant-to-metal precursor ratio is illustrated in Fig. 2. It is apparent from Fig. 2 that: (a) average size changes with change in the surfactant-to-metal precursor molar ratio and (b) for molar ratios up to 40![[thin space (1/6-em)]](https://www.rsc.org/images/entities/char_2009.gif) :
:![[thin space (1/6-em)]](https://www.rsc.org/images/entities/char_2009.gif) 1 average size of the nanoparticles decreases and beyond it the average size increases again. Particles with average sizes below ∼14 nm cannot be obtained by different surfactant-to-precursor molar ratios. A different synthesis strategy is required to produce AuCu particles smaller than 14 nm and this requires understanding of the mechanism of the formation of the AuCu intermetallic.
1 average size of the nanoparticles decreases and beyond it the average size increases again. Particles with average sizes below ∼14 nm cannot be obtained by different surfactant-to-precursor molar ratios. A different synthesis strategy is required to produce AuCu particles smaller than 14 nm and this requires understanding of the mechanism of the formation of the AuCu intermetallic.
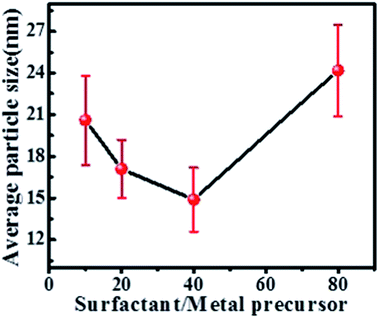 | ||
| Fig. 2 Change in average sizes of as synthesized nanoparticles with surfactant-to-metal precursor ratio. | ||
Mechanism of formation of AuCu intermetallic nanoparticles
In order to develop an understanding of the kinetics of the atomic processes behind the synthesis of AuCu nanoparticles, we have systematically analyzed the reaction products obtained at different temperature intervals. We have selected the molar ratio of 40![[thin space (1/6-em)]](https://www.rsc.org/images/entities/char_2009.gif) :
:![[thin space (1/6-em)]](https://www.rsc.org/images/entities/char_2009.gif) 1 as this has yielded smallest particle size (∼14 nm) in the previous experiments. The samples were extracted from reaction bath at an interval of 20 °C from 75 °C to 260 °C when the bath was heated at a rate of ∼8 °C. The extracted specimens were quenched in ethanol and centrifuged to isolate the nanoparticles.
1 as this has yielded smallest particle size (∼14 nm) in the previous experiments. The samples were extracted from reaction bath at an interval of 20 °C from 75 °C to 260 °C when the bath was heated at a rate of ∼8 °C. The extracted specimens were quenched in ethanol and centrifuged to isolate the nanoparticles.
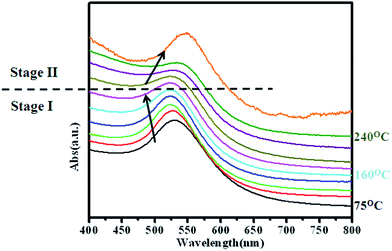
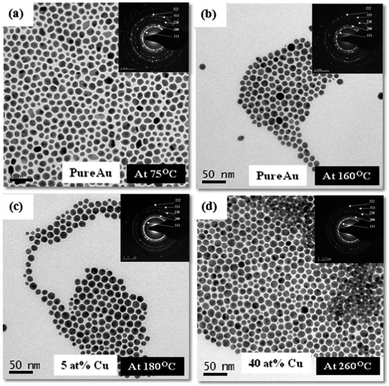
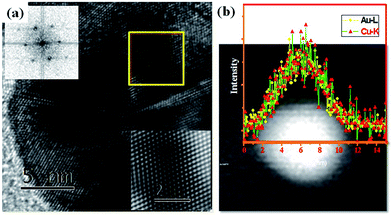
Normalized UV-Vis spectra obtained from the nanoparticles show continuous shift in the absorbance peak position with change in the reaction mixture temperature. For the nanoparticles extracted at temperatures below 160 °C the absorption peak shift towards left (blue shift) while for the nanoparticles extracted at temperatures greater than 160 °C the shifts towards right (red shift) as shown in Fig. 3. Microstructural and compositional analysis of nanoparticles extracted from the reaction mixture was conducted to find the reason for the shifts in the UV-Vis spectrum peak position. TEM bright field images and SAD patterns (as inserts) obtained from the nanoparticles extracted at 75 °C, 160 °C, 180 °C, and 260 °C are shown respectively in Fig. 4(a–d). TEM-EDS compositional analysis of the nanoparticles extracted at 75 °C, and 160 °C revealed only pure Au. Analysis of the SAD patterns using ring ratio technique58 in Fig. 4(a & b) revealed a single phase fcc structure with interplanar spacings corresponding to pure Au phase. With increase in temperature, morphology of nanoparticles progressively changes from an irregular shape to a near spherical shape. Nanoparticles extracted at 75 °C are relatively more irregular shaped while the nanoparticles extracted at 160 °C are rounded (Fig. 4). The mode of size distribution of the nanoparticles decreased with increase in the reaction mixture temperature. These observations strongly indicate that the blue shift (Fig. 3) is primarily due to the surface roughening of pure Au nanoparticles which also leads to a narrowing of size distribution. TEM bright field images and SAD patterns (as insert) obtained from nanoparticles extracted at 180 °C, and 260 °C are shown in Fig. 4(c & d). These observations indicate that an increase in temperature beyond 160 °C produces no noticeable change in the morphology of the nanoparticles. On the other hand, TEM-EDS compositional analysis of nanoparticles revealed an increase in the amount of Cu content in Au nanoparticles to 5 at%, and 40 at% for nanoparticles extracted at 180 °C and 260 °C respectively. SAD patterns in Fig. 4(c & d) reveal diffraction signatures corresponding to a single phase fcc structure and no diffraction evidence for pure Cu or it's oxide phases could be observed. This indicates the formation of AuCu phase with disordered structure. A high resolution TEM image (HRTEM) of a representative nanoparticle extracted after 5 minutes of reflux at 260 °C and a FFT diffraction pattern obtained from the nanoparticle is provided in Fig. 5(a). Continuity of the lattice fringes in the HRTEM image and the single crystalline nature of the FFT pattern confirm that the nanoparticle has single phase solid solution atomic configuration. A STEM-HAADF image of a representative nanoparticle extracted after 5 minutes of reflux at 260 °C and a compositional line profile showing the co-presence of Au and Cu atoms across the nanoparticle diameter is provided in Fig. 5(b). Compositional and structural analysis of nanoparticles extracted at 180 °C, 220 °C and 260 °C temperatures therefore strongly suggest that the red shift (Fig. 3) was primarily due to the incorporation of Cu atoms into Au seed to form Au–Cu solid solution.
The results presented above establish that the formation of AuCu nanoparticle occurred in two successive stages: in the first stage seed nanoparticles of Au evolve and in the second stage Cu atoms diffuse into these seed Au nanoparticles to form Au–Cu alloy nanoparticles. It is apparent that a control over the nucleation and growth process of Au seed nanoparticles and its sizes can be a tool for tuning the size of the AuCu nanoparticles in the final dispersion.
Effect of relative amount of surfactants on nanoparticle size
It was speculated that changing the relative molar amounts of oleylamine and oleic acid in the reaction mixture may alter the size of Au seed nanoparticles owing to the fact that the interaction of these surfactants with Au and Cu zero-valent atoms is not similar.2,13,43,59–61 To examine this, experiments were conducted in which the relative molar ratios of oleylamine-to-oleic acid were varied while the total surfactant-to-precursor molar ratio was kept fixed at 40![[thin space (1/6-em)]](https://www.rsc.org/images/entities/char_2009.gif) :
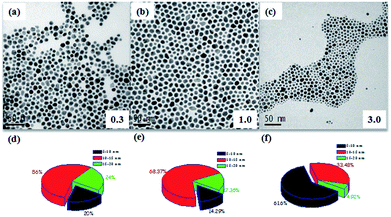
:![[thin space (1/6-em)]](https://www.rsc.org/images/entities/char_2009.gif) 1. Three different molar ratios of oleylamine-to-oleic acid (0.3, 1 and 3) were used to produce dispersion of three different nanoparticles identified respectively as dispersion 6, 7 and 8. Amounts of ingredients of reactants used for producing these dispersions are shown in Table S2.† For all the three cases specimens were again extracted from the reaction mixture at approximately 20 °C temperature interval in the temperature range of 75 °C to 180 °C. Bright field TEM images of nanoparticles extracted at 75 °C from the reaction mixtures containing different molar ratios of oleylamine-to-oleic acid (0.3, 1 and 3) are shown in Fig. 6(a–c). TEM-EDS compositional analysis of nanoparticles extracted at 75 °C revealed the presence of only Au. Size distribution plots for nanoparticles extracted at 75 °C for all the three cases are shown in Fig. 6(d & f). The plots reveal that the percentage of smaller sized Au nanoparticles (5–10 nm range) increased with increase in the oleylamine concentration. This observation indicates that oleylamine concentration can be effective in tuning the size of the Au seed nanoparticles.
1. Three different molar ratios of oleylamine-to-oleic acid (0.3, 1 and 3) were used to produce dispersion of three different nanoparticles identified respectively as dispersion 6, 7 and 8. Amounts of ingredients of reactants used for producing these dispersions are shown in Table S2.† For all the three cases specimens were again extracted from the reaction mixture at approximately 20 °C temperature interval in the temperature range of 75 °C to 180 °C. Bright field TEM images of nanoparticles extracted at 75 °C from the reaction mixtures containing different molar ratios of oleylamine-to-oleic acid (0.3, 1 and 3) are shown in Fig. 6(a–c). TEM-EDS compositional analysis of nanoparticles extracted at 75 °C revealed the presence of only Au. Size distribution plots for nanoparticles extracted at 75 °C for all the three cases are shown in Fig. 6(d & f). The plots reveal that the percentage of smaller sized Au nanoparticles (5–10 nm range) increased with increase in the oleylamine concentration. This observation indicates that oleylamine concentration can be effective in tuning the size of the Au seed nanoparticles.
Towards the synthesis of intermetallic AuCu nanoparticles of smaller (<10 nm) sizes
Two key conclusions that can be derived from the above studies are: (a) size of the Au seed nanoparticles can be reduced by increasing the amount of oleylamine and (b) if Cu precursor salt is reduced in the presence of Au nanoparticles, Cu atoms would diffuse into Au nanoparticles to form AuCu nanoparticles. These findings were then used as a guide to design a new methodology to produce AuCu nanoparticles of still smaller sizes. The process involves separate synthesis of Au nanoparticles using only oleylamine surfactant to derived size range followed by reduction of Cu precursor salt in the presence of these Au nanoparticles in a separate reaction.In the first step of the synthesis process, Au nanoparticles were synthesized under inert atmosphere using modified polyol method using tetracholoroauric acid [HAuCl4], 1,2-hexadecanediol (HDD) and oleylamine dissolved in diphenyl ether solvent. The reaction mixture was heated to a set temperature value (Table S3†) and was kept at this temperature for 20 min followed by cooling to room temperature. In the second step of the process, the extracted Au nanoparticles were added in a solution mixture of copper acetylacetonate [Cu(acac)2], 1,2-hexadecanediol, oleylamine and oleic acid dissolved into diphenyl ether solvent. This reaction mixture was heated to ∼230 °C and refluxed for 5 min under an inert atmosphere followed by cooling to room temperature. The synthesized nanoparticles were finally collected through high speed centrifugation.
Three separate sets of synthesis experiments were conducted. Amounts of reaction ingredients used in each experiment are presented in Table S3.† Table S3† also provides average size of pure Au and Au–Cu nanoparticles synthesized in each step. Average sizes were obtained from the summation average of sizes of several individual nanoparticles. We note that the reflux temperature in the first step changed the size of the Au nanoparticles which eventually facilitated size manipulation for the final Au–Cu alloy nanoparticles. For the same amount of reaction constituents a reflux temperature of 180 °C and 120 °C respectively yielded Au nanoparticles with 8.9 ± 1.5 nm and 5.8 ± 0.9 nm size. It can be observed from Table S3† that the two-pot method yielded AuCu nanoparticles with average sizes of ∼5, 7 and 10 nm which are lower than the minimum average size (∼14 nm) that can be achieved by the single-pot method described earlier. TEM bright field images of AuCu nanoparticles produced from the three sets of experiments mentioned in Table S3† are shown in Fig. 7(a–c). TEM-EDS compositional analysis revealed an equi-atomic average composition for the AuCu nanoparticles in all the three sets.
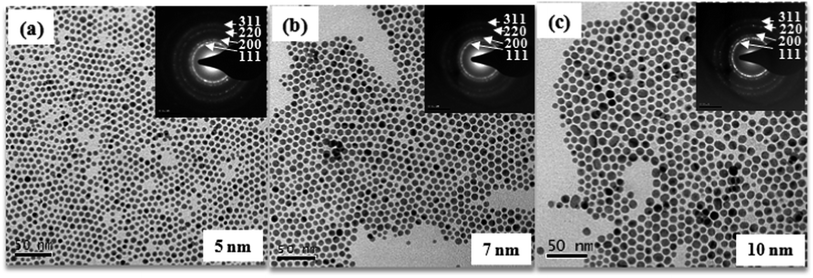 | ||
| Fig. 7 TEM bright field images of (a) 5 nm, (b) 7 nm, and (c) 10 nm Au–Cu nanoparticles produce from three sets of experiments mention in Table S3.† Inset shows SAD patterns from AuCu nanoparticles. | ||
Results obtained from the analysis of nanoparticles produced in the two steps in SET 1 illustrate that the two successive reduction processes indeed produced disordered AuCu nanoparticles. Representative TEM bright field images and SAD patterns (as insert) obtained from nanoparticles produced in first and second step are shown respectively in Fig. 8(a & b). SAD patterns obtained from the nanoparticles produced from the first step reveal diffraction signature corresponding to pure Au phase. SAD patterns obtained from the nanoparticles produced through the second step reveal the presence of single phase fcc structure of Au–Cu solid solution with no diffraction evidence corresponding to the presence of pure Cu phase or its oxides. UV-Vis spectrums obtained from as-synthesized Au and Au–Cu alloy nanoparticles are shown in Fig. 9(a). A relative red shift of the absorbance peak obtained from AuCu nanoparticles as compared to the one obtained from the pure Au nanoparticles supports the formation of single phase Au–Cu alloy nanoparticle. A high-resolution TEM image of representative AuCu nanoparticles obtained after the second step is shown in Fig. 9(b). Continuity of lattice fringes across the nanoparticles in the image confirms the single crystalline nature of nanoparticles. A fast Fourier transform of the lattice periodicity in particle marked ‘A’ is shown as inset in Fig. 9(b). It should be noted that the interplanar spacing of the (111) plane in pure Au and Cu crystal are 2.355 Å and 2.087 Å respectively. From the Vegard's law,49,62 the interplanar spacing of (111) planes for disordered Au–Cu solid solution with equi-atomic composition should be 2.2 Å. The observed single interplanar spacing of 2.2 Å therefore indicates the formation of equiatomic fcc solid solution between Au and Cu atoms in the nanoparticle.
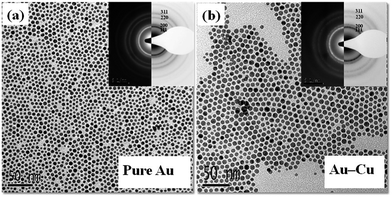 | ||
| Fig. 8 TEM bright field image of as synthesized (a) Au and (b) Au–Cu nanoparticles produced from two step method. Inset shows corresponding SAD patterns. | ||
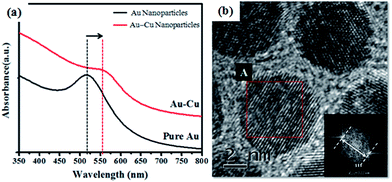 | ||
| Fig. 9 (a) The UV-Vis absorption spectra of as synthesized Au and AuCu nanoparticles and (b) the high-resolution TEM image of AuCu nanoparticles and corresponding FFT of the lattice periodicity. | ||
Conclusions
The present study demonstrates that Cu atoms can diffuse into Au seed nanoparticles to form solid solution Au–Cu nanoparticles using surfactants which not only prevent nanoparticles from agglomerating but also control the process of their nucleation and growth during the synthesis process. The molar amounts of surfactants and their type can be used as a tool to tune nanoparticle sizes and their phases. In a synthesis process where both Au and Cu precursor salts are present in the reaction mixture, the size of AuCu nanoparticles that can be achieved in the final dispersion is sensitive to the ratio of the total molar amount of surfactant-to-metal precursor used with a limit on the minimum size (∼14 nm). An increase in the amount of oleylamine in the reaction mixture decreases the size of the Au seed nanoparticles formed during the early stages of the synthesis process. We have shown that a methodology in which smaller sized Au nanoparticles are synthesized using only oleylamine surfactant followed by reduction of Cu precursor in the presence of these seed nanoparticles in an separate reaction has the potential to produce monodispersed disordered AuCu nanoparticles with sub 10 nm sizes. The variation of sizes could be control within ±1.7 nm.Acknowledgements
The authors acknowledge the electron microscopy facilities available at the Advanced Centre for microscopy and microanalysis (AFMM) Indian Institute of Science, Bangalore. One of the authors (S. K. Sinha) acknowledges the funding from the Council of Scientific and Industrial Research (CSIR), Government of India. C. Srivastava acknowledges the funding received from Nano-mission grant by Department of Science and Technology, Govt. of India.Notes and references
- C. Burda, X. B. Chen, R. Narrayanan and M. A. El-Sayed, Chem. Rev., 2005, 105, 1025–1102 CrossRef CAS PubMed.
- R. Ferrando, J. Jellinek and R. L. Johnston, Chem. Rev., 2008, 108, 845–910 CrossRef CAS PubMed.
- C. L. Barcey, P. R. Ellis and G. J. Hutching, Chem. Soc. Rev., 2009, 38, 2231–2243 RSC.
- D. Wang and Y. Li, Adv. Mater., 2011, 23, 1044–1060 CrossRef CAS PubMed.
- X. Liu, A. Wang, X. Wang, C. Y. Mou and T. Ziang, Chem. Commun., 2008, 27, 3187–3189 RSC.
- (a) K. Kneipp, Y. Wang, H. Kneipp, L. T. Perelman, I. Itzkan, R. R. Dansari and M. S. Feld, Phys. Rev. Lett., 1997, 78, 1667–1670 CrossRef CAS; (b) S. Nie and S. R. Emery, Science, 1997, 275, 1102–1106 CrossRef CAS PubMed.
- Y. Alivov and Z. Y. Fan, Appl. Phys. Lett., 2009, 95, 063504/1–3 CrossRef CAS PubMed.
- P. Brown, K. Takechi and P. V. Kamat, J. Phys. Chem. C, 2008, 112, 4776–4782 CAS.
- B. K. Jeluri, Y. B. Zheng, D. Ahmed, L. Jensen and T. Huang, J. Phys. Chem. C, 2008, 112, 7309–7317 Search PubMed.
- S. Link, M. B. Mohomed and M. A. El-Sayed, J. Phys. Chem. B, 1999, 103, 3073–3077 CrossRef CAS.
- V. I. Belotelov, G. Carotenuto, L. Nicolais, A. Longo, G. P. Pepe, P. Perlo and A. K. Zevezdin, J. Appl. Phys., 2006, 99, 044304/1–9 CrossRef CAS PubMed.
- S. Link, Z. L. Wang and M. A. El-Sayed, J. Phys. Chem. B, 1999, 103, 3529–3533 CrossRef CAS.
- Y. Xia, Y. Xiong, B. Lim and S. E. Skrabalak, Angew. Chem., Int. Ed., 2009, 48, 60–108 CrossRef CAS PubMed.
- J. E. Muñoz, J. Cercantes, R. Esparza and G. Rosas, J. Nanopart. Res., 2007, 9, 945–950 CrossRef.
- C. C. Koch and J. D. Whittenberger, Intermetallics, 1996, 4, 339–355 CrossRef CAS.
- P. Milani and W. A. Deheer, Rev. Sci. Instrum., 1990, 61, 1835–1838 CrossRef CAS PubMed.
- T. Haubold, R. Bohn, R. Birringer and H. Gleiter, Mater. Sci. Eng., A, 1992, 153, 679–683 CrossRef.
- J. C. Pivin, M. A. Garcia, J. Llopis and H. Hofmeister, Nucl. Instrum. Methods Phys. Res., Sect. B, 2002, 191, 794–799 CrossRef CAS.
- B. L. Cushing, V. L. Kolesnichenko and C. O'Connor, Jpn. Chem. Rev., 2004, 104, 3893–3946 CrossRef CAS PubMed.
- A. Roucoux, J. Schulz and H. Patin, Chem. Rev., 2002, 102, 3757–3778 CrossRef CAS PubMed.
- F. Dumestre, B. Chaudret, C. Amiens, M.-C. Fromen, M.-J. Casanove, P. Renaud and P. Zurcher, Angew. Chem., Int. Ed., 2002, 41, 4286–4289 CrossRef CAS.
- S. Sun, C. B. Murray, D. Weller, L. Folks and A. Moser, Science, 2000, 287, 1989–1992 CrossRef CAS.
- I. H. Gul, W. Ahmed and A. Maqsood, J. Magn. Magn. Mater., 2008, 320, 270–275 CrossRef CAS PubMed.
- Y. S. Shon, G. B. Dawson, M. Porter and R. W. Murray, Langmuir, 2002, 18, 3880–3885 CrossRef CAS.
- D. Wang and Y. Li, J. Am. Chem. Soc., 2010, 132, 6280–6281 CrossRef CAS PubMed.
- M. Rajamathi and R. Seshadri, Curr. Opin. Solid State Mater. Sci., 2002, 6, 337–345 CrossRef CAS.
- Y. Sun and Y. Xia, Science, 2002, 298, 2176–2179 CrossRef CAS PubMed.
- Y. Sun, B. T. Mayers and Y. Xia, Nano Lett., 2002, 2, 481–485 CrossRef CAS.
- N. R. Jana, Small, 2005, 1, 875–882 CrossRef CAS PubMed.
- J. Park, K. An, Y. Hwang, J.-G. Park, H.-J. Noh, J.-Y. Kim, J.-H. Park, N.-M. Hwang and T. Hyeon, Nat. Mater., 2004, 3, 891–895 CrossRef CAS PubMed.
- C. B. Murray, S. Sun, W. Gaschler, H. Doyle, T. A. Betley and C. R. Kagan, IBM J. Res. Dev., 2001, 45, 47–56 CrossRef CAS.
- A. R. Tao, S. Habas and P. Yang, Small, 2008, 3, 310–325 CrossRef.
- S. W. Kim, J. Park, Y. Jang, Y. Chung, S. Hwang and T. Hyeon, Nano Lett., 2003, 3, 1289–1291 CrossRef CAS.
- C. Srivastava, D. E. Nikles and G. B. Thomson, J. Appl. Phys., 2008, 104, 104314/1–7 CAS.
- M. Chen, J. P. Liu and S. Sun, J. Am. Chem. Soc., 2004, 126, 8394–8395 CrossRef CAS PubMed.
- V. Nandwana, K. E. Elkins, N. Poudyal, G. S. Chaubey, K. Yano and J. P. Liu, J. Phys. Chem. C, 2007, 111, 4185–4189 CAS.
- L. Colak and G. C. Hadjipanayis, Nanotechnol., 2009, 20, 485602(7) CrossRef PubMed.
- S. Sun, Adv. Mater., 2006, 18, 393–403 CrossRef CAS.
- U. Pal, J. F. S. Ramirez, H. B. Liu, A. Medina and J. A. Ascencio, Appl. Phys. A, 2004, 79, 79–84 CrossRef CAS PubMed.
- A. K. Sra and R. E. Schaak, J. Am. Chem. Soc., 2004, 126, 6667–6672 CrossRef CAS PubMed.
- R. E. Schaak, A. K. Sra, B. M. Leonard, R. E. Cable, J. C. Baur, Y. F. Han, J. Means, W. Teizer, Y. Vasquez and E. S. Funck, J. Am. Chem. Soc., 2005, 127, 3506–3515 CrossRef CAS PubMed.
- A. K. Sra, T. D. Ewers and R. E. Schaak, Chem. Mater., 2005, 17, 758–766 CrossRef CAS.
- W. Chen, R. Yu, L. Li, A. Wang, Q. Peng and Y. Li, Angew. Chem., Int. Ed., 2010, 49, 2917–2921 CrossRef CAS PubMed.
- Y. Liu and A. R. Hight Walker, Angew. Chem., Int. Ed., 2010, 49, 6781–6785 CrossRef CAS PubMed.
- G. Wang, L. Xiao, B. Huang, Z. Ren, X. Tang, L. Zhung and J. Lu, J. Mater. Chem., 2012, 22, 15769–15774 RSC.
- J. L. Rodríguez-López, J. M. Montejano-Carrizales and M. José-Yacamán, Appl. Surf. Sci., 2003, 219, 56–63 CrossRef.
- J. C. Bauer, D. Mullins, M. Li, Z. Wu, E. A. Payzant, S. H. Overbury and S. Dai, Phys. Chem. Chem. Phys., 2011, 13, 2571–2581 RSC.
- D. Kim, J. Resasco, Y. Yu, A. M. Asiri and P. Yang, Nat. Commun., 2014, 5, 4948(1–8) Search PubMed.
- H. Okamoto, D. J. Chakrabarti, D. E. Laughlin and T. B. Massalski, Bull. Alloy Phase Diagrams, 1987, 8, 454–474 CAS.
- H. Yasuda and H. Mori, Z. Phys. D: At., Mol. Clusters, 1994, 31, 131–134 CrossRef CAS.
- N. T. Wilson and R. L. Johnston, J. Mater. Chem., 2002, 12, 2913–2922 RSC.
- B. Pauwel, G. V. Tendeloo, E. Zhurkin, M. Hou, G. Verschoren, L. T. Kuhn, W. Bouwen and P. Lievens, Phys. Rev. B: Condens. Matter Mater. Phys., 2001, 63, 165406/1–10 Search PubMed.
- T. Tadaki, A. Koreeda, Y. Nakata and T. Kinoshita, Surf. Rev. Lett., 1996, 3, 65–69 CrossRef CAS.
- H. Yasuda and H. Mori, Z. Phys. D: At., Mol. Clusters, 1996, 37, 181–186 CrossRef CAS.
- L. Wang and D. D. Johnson, J. Am. Chem. Soc., 2009, 131, 14023–14029 CrossRef CAS PubMed.
- A. U. Nilekar, A. V. Ruben and M. Mavrikakis, Surf. Sci., 2009, 603, 91–96 CrossRef CAS PubMed.
- A. V. Ruben, H. L. Skriver and J. K. Norskov, Phys. Rev. B: Condens. Matter Mater. Phys., 1999, 59, 15990–16000 CrossRef.
- C. Srivastava, Mater. Lett., 2012, 70, 122–124 CrossRef CAS PubMed.
- P. de la Presa, M. Multiger, J. de la Venta, M. A. García and M. L. Ruiz-González, J. Appl. Phys., 2006, 100, 123915/1–6 CrossRef CAS PubMed.
- M. B. Mohamed, K. M. AbouZeid, V. Abdelsayed, A. A. Aljarash and M. S. El-Shall, ACS Nano, 2010, 4, 2766–2772 CrossRef CAS PubMed.
- Z. Huo, C.-K. Tsung, W. Huang, X. Zhang and P. Yang, Nano Lett., 2008, 8, 2041–2044 CrossRef CAS PubMed.
- B. D. Cullity and S. R. Stock, Element of X-Ray Dffraction, Prentice Hall Pub. Inc., 3rd edn, 2001, pp. 339–345 Search PubMed.
Footnote |
| † Electronic supplementary information (ESI) available: Table S1–S3. See DOI: 10.1039/c4ra12059k |
| This journal is © The Royal Society of Chemistry 2015 |

