Experimental study and thermodynamic modeling for purification of extracted algal lipids using an organic/aqueous two-phase system

Hamed Abedini Najafabadia, Gholamreza Pazukib and Manouchehr Vossoughi*ac
aDepartment of Chemical and Petroleum Engineering, Sharif University of Technology, Tehran, Iran. E-mail: vosoughi@sharif.edu; Tel: +98-21-66164140
bChemical Engineering Department, Amirkabir University of Technology (Tehran Polytechnic), Tehran, Iran
cInstitute for Biotechnology and Environment (IBE), Sharif University of Technology, Tehran, Iran

Received 7th October 2014 , Accepted 27th November 2014

First published on 27th November 2014


Abstract

The extraction and purification of lipids from the microalgae Chlorella vulgaris have been investigated. First, a mixture of hexane and ethanol was used to extract lipids from the algal biomass. Ultrasonication was employed to disrupt the cell wall and increase the extraction performance. Under these conditions, over 90% of the fatty acids in the biomass were extracted. Second, a biphasic system was formed by adding water and hexane to the extracted crude oil. In this way, fatty acids were mainly distributed in the organic phase (mostly hexane and ethanol) while most of the contaminants remained in the aqueous phase (mostly water and ethanol). Equilibrium distribution data between the phases were obtained to investigate the fatty acid lost to the aqueous phase during the purification process. The results showed that adding more water and hexane to the extraction mixture leads to a greater phase separation, as well as to higher purification of the extracted lipids. However purification efficiency did not improve very much if hexane and water were added at more than their optimum value. Two thermodynamic models (UNIQUAC and NRTL) were used in order to describe the partitioning behaviour of fatty acids in this system. The results indicated that these models can accurately estimate the fatty acid partition coefficient with average absolute deviation percentage (AAD%) of 8.69 and 9.46 for the UNIQUAC and the NRTL models, respectively. The AAD% of fatty acid recovery yield was 4.91 and 5.60 for the UNIQUAC and the NRTL models, respectively.
1. Introduction

Microalgae are considered as one of the most promising resources for biodiesel production as well as a feedstock for the production of additional biofuels and bioproducts.1–3 However, various technological and economical aspects obstruct the industrial-scale production of microalgal biodiesel. The major upstream obstacles consist of the selection of a robust microalgal strain with optimum lipid content and cultivate it in a suitable large-scale system.4 Furthermore, developing an efficient lipid extraction and purification method from algal biomass is one of the critical steps in the downstream processes.5 Organic solvent extraction is one of the most well-known methods for the extraction of algal oils.6,7 So far, various organic solvents have been used for extraction of lipids from microalgae. It has been found that mixture of non-polar and polar organic solvents will ensure complete extraction of all neutral lipids.8

Since complete dewatering of the microalgal biomass is energy intensive, it will be economically beneficial to extract lipids directly from wet feedstock.9 However, several studies have reported that existence of moisture may decrease the lipid extraction efficiency.10–12 Besides, the residual water will remain in the solvent and may cause problem in the transesterification reaction. Adding an appropriate amount of non-polar organic solvent and water to the extracted mixture will produce organic/aqueous two-phase system. Upon complete biphasic separation, neutral and polar lipids will mainly partition in the organic phase, while the aqueous phase will contain primarily non-lipid contaminants.8 As such, biphasic separation not only eliminates the residual water, but also removes the non-lipid contaminants from the mixture of organic solvents and lipids.13 Despite usefulness to purify the lipids from non-lipid contaminants, the method may lead to loss of lipids in to the aqueous phase.13,14 The degree of lipid loss may vary by the amount of water and solvent added to the extracted mixture. Therefore, a theoretical model that can estimate the lipid loss during the purification process will have significant applications. Thermodynamic modeling is a suitable method for estimation of lipid partitioning during this process. This method was largely used for investigating the partitioning behavior of valuable products such as pharmaceutical and enzymatic compounds in aqueous two-phase system.15–17

In this study, the purification of crude microalgal lipid has been investigated. The main focus is on fatty acids rather than total lipids, since the former is more expected for biodiesel production. Mixture of hexane (as a non-polar organic solvent) and ethanol (as a polar organic solvent) has been used for lipid extraction. In order to purify the extracted lipids, organic/aqueous two-phase system was formed by adding water and hexane to the extraction mixture. The fatty acids concentration in organic and aqueous phases was used to determine the recovery yield and partitioning behavior of fatty acids in the purification process. The UNIQUAC and the NRTL as free energy models were utilized to correlate the fatty acid partition coefficient and recovery yield in the system. The results demonstrated that these models can predict the phase behavior of the system, accurately.

2. Material and method

2.1 Chemicals

The solvents used in this work included hexane (99%, Merck), ethanol (99.5%, Merck) and methanol (99.5%, Merck). Distilled water was employed for washing the extracted lipids and sulfuric acid (95–98%, Merck) was used as catalyst for transesterification reaction. All nutrients used for culture media were laboratory or ACS grade. Methyl heptadecanoate (99%, Sigma-Aldrich) was used as an internal standard for fatty acid quantification.

2.2 Strains cultivation and harvesting

The Chlorella vulgaris CCAP (211/19) was obtained from the Culture Collection of Algae and Protozoa, Ambleside, Cumbria, UK. This species was cultivated using 5 liters (ID, 16 cm; height, 25 cm) photobioreactor in sterilized Bold's Basal Media (BBM)18 for about two weeks, followed by one week of stressing in nitrogen-deprivation medium (N-BBM). The BBM media includes NaNO3 (250 mg L−1), K2HPO4 (75 mg L−1), KH2PO4 (175 mg L−1), CaCl2·2H2O (25 mg L−1), MgSO4·7H2O (75 mg L−1), NaCl (25 mg L−1), KOH (31 mg L−1), Na2EDTA (50 mg L−1), FeSO4·7H2O (4.98 mg L−1), H3BO3 (11.42 mg L−1), ZnSO4·7H2O (17.76 mg L−1), MnCl2·4H2O (2.88 mg L−1), CuSO4·5H2O (3.14 mg L−1), (NH4)6Mo7O24·4H2O (1.74 mg L−1) and CoCl2·6H2O (0.8 mg L−1). The photobioreactor received continuous fluorescence illumination (300–400 μmol m−2 s−1) and its temperature was regulated at 25 °C. Air containing 3% CO2 was supplied to the photobioreactor at the rate of 5 L min−1.

Algal biomass was harvested from the media by centrifugation and the wet biomass was freeze dried for 24 h at −80 °C to complete lyophilization.

2.3 Extraction of microalgal crude oil

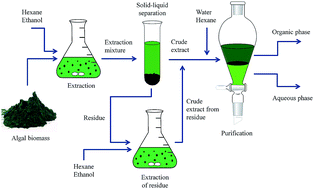
Lipid extraction procedure was shown in Fig. 1. 0.5 g of lyophilized algal biomass was mixed with 5 mL of hexane–ethanol (1/1, v/v) in a conical flask and sonicated at 38 kHz for 20 min in an ice-bath for disrupting the cell walls. The lipids were extracted by agitating the mixture with magnetic stirrer at 180 rpm for about 60 minutes at 25 °C. The resulted mixture then centrifuged for 10 min and the supernatant was collected. The above mentioned extraction process was repeated again on the residual algal biomass until no significant improvement was achieved. The resulted supernatants were collected and mixed together.
image file: c4ra11914b-f1.tif
Fig. 1 Lipid extraction and purification procedure from microalgal biomass.

2.4 Purification of extracted oil

The extracted lipids were purified by forming an organic/aqueous two-phase system, where the purified lipids were mostly transferred to the organic phase. In this experiment (Fig. 1), specific amount of water and hexane was added to the extraction solvent and the obtained mixture was stirred vigorously and left to rest for 24 h at 25 °C to complete separation of two phases with a well defined interface. According to previous investigations,13,14 aqueous phase is mainly composed of water, ethanol and non-lipid contaminants, and organic phase is mainly composed of hexane, ethanol and purified lipids. Once equilibrium was attained, the two phases were separated and their masses were determined. An aliquot of the organic phase was taken for fatty acid determination by gas chromatography mass-spectrometry (GC-MS). The fatty acid in the aqueous phase was determined by a mass balance, taking into account the initial amount of fatty acid in the crude oil.

In each experiment, different amounts of water and hexane were added to the extracted mixture to form biphasic system. Each test was repeated at least three times and the results were expressed as mean ± standard deviation. The fatty acid partition coefficient between the two phases (Kfa) was determined by dividing the fatty acid mass fraction in the organic phase to the fatty acid mass fraction in the aqueous phase:

 
image file: c4ra11914b-t1.tif(1)
where superscripts I and II refer to the organic and aqueous phases, respectively and wfa is mass fraction of fatty acid in each phase. The fatty acid recovery yield (Rfa) was defined as the amount of fatty acid in the organic phase divided by the amount of fatty acid in the crude lipid extract. Fatty acid recovery yield can be easily related to fatty acid partition coefficient:
 
image file: c4ra11914b-t2.tif(2)
where in the above equation mI and mII are mass of organic and aqueous phases, respectively.

2.5 Lipid and fatty acid determination

For determination of total lipids, the extraction solvent was removed using rotary evaporator at the temperature of 50 °C and the vacuum of 200 mmHg. The remaining lipids in the flask were weighed after complete vaporization of the solvent.

The fatty acid content was determined as described in literature.19 In brief, the fatty acids present in the dried solvent extracts were converted into fatty acid methyl esters (FAMEs) using a 3 mL solution of 5% (v/v) H2SO4 in methanol. After extraction with 3 mL hexane, 1 μL of sample was analyzed by GC-MS, essentially as described by Hakim et al.20

Total fatty acid content of the biomass was determined by direct transesterification of the biomass following the method of Lepage and Roy.21

2.6 Thermodynamic modeling

Fatty acid partition coefficient can be obtained from thermodynamic models. According to the fundamental relations of thermodynamic, for two liquid phases at equilibrium the activity of each component in both phases must be equal:
 
aIi = aIIi (3)

Thus:

 
wIiγIi = wIIiγIIi (4)
where γi is activity coefficient of the component i in each phase. Based on eqn (1) and (4), fatty acid partition coefficient can be estimated from fatty acid activity coefficients in the organic and aqueous phases according to the following equation:
 
image file: c4ra11914b-t3.tif(5)

As the fatty acid mass fraction is very small respect to other components in each phase, the partition coefficient can be expressed in dilution form:

 
image file: c4ra11914b-t4.tif(6)

The fatty acid recovery yield can be estimated from the partition coefficient using eqn (2). Two well known local composition based models, the NRTL (Non-random two-liquid)22 and the UNIQUAC (UNIversal QUAsiChemical)23 (see Appendix for the detailed description) were used to express the activity coefficients. These models are based on the theory that mixing of molecules is non-random, thus they can represent realistic picture for the phase behavior of complex systems such as multicomponent vapour–liquid and liquid–liquid equilibrium. Despite these advantages, they faced with some limitations such as large dependency to the system parameters and poor ability in predictive description of systems behavior.

According to Renon and Prausnitz22 α, nonrandomness parameter in the NRTL model has a value between 0.1 and 0.3, which in this study it is considered to be 0.2. The pure component molecular structure parameters (r, q, q′) for UNIQUAC model are reported in Table 1. These parameters for hexane, ethanol and water were obtained from Abrams and Prausnitz.23 All of the fatty acids were considered as one component and its molecular structure parameters were calculated according to the method proposed by Batista et al.,24 considering the mass fraction of fatty acids in the algal oil.

Table 1 Pure component molecular structure parameters (r, q, q′) for UNIQUAC model
Component ri qi qi
Hexane 4.5 3.88 3.86
Ethanol 2.11 1.97 0.92
Water 0.92 1.4 1
Fatty acid 13.25 10.68 10.68


For both the NRTL and the UNIQUAC models interaction parameters between each pairs are considered as the adjustable parameters and are almost determined by correlation of experimental data. It should be noted that in the present study, the interaction parameters of hexane–ethanol, ethanol–water and hexane–water pairs were obtained from the literature25 and reported in Table 2. The experimental data for fatty acid partition coefficients was used to obtain the interaction parameters for the pairs of fatty acid–hexane, fatty acid–ethanol and fatty acid–water. Accordingly, for both the NRTL and the UNIQUAC models there would be six adjustable parameters which should be tuned using experimental data. To make predictive sense in the modeling and also decrease the number of the adjustable parameters, Hansen solubility parameters have been used in evaluating the interaction parameters.26 As such following expression was considered for the interaction parameters:

Table 2 Adjustable parameters for the UNIQUAC and the NRTL models obtained from Macedo et al.,25 Hansen solubility parameters obtained from Hansen.27 1: Hexane, 2: ethanol and 3: water
UNIQUAC parameters NRTL parameters Hansen solubility parameters
Δa12 337.78 Δg12 248.2 δ1 29.8
Δa13 649.69 Δg13 1267.6 δ2 38.11
Δa23 −72.446 Δg23 −514.6 δ3 54.83
Δa21 −80.7117 Δg21 300.2    
Δa31 495.06 Δg31 2054    
Δa32 −380.36 Δg32 154.75    


NRTL model:

 
Δgfa,i = α|δfaδi| + β (7)

UNIQUAC model:

 
Δafa,i = α′|δfaδi| + β (8)
where Δg and Δa are interaction parameters of the NRTL and the UNIQUAC models, respectively. α, β and α′, β′ are the new adjustable parameters for the NRTL and UNIQUAC models, respectively. It should be noted that the number of adjustable parameters were reduced from six to two by using this assumption. δ is Hansen solubility parameters which was obtained from literature27 for each component and reported in Table 2. Subscript fa and i stand for fatty acid and hexane (1), ethanol (2) or water (3), respectively.

To investigate the effectiveness of thermodynamic models, the model proposed by Fajardo et al.13 was also used for estimation of fatty acid partitioning behavior. This model has two adjustable parameters and simply correlates the fatty acid concentration of the organic and aqueous phase using the below equation:

 
image file: c4ra11914b-t5.tif(9)
where C1 and C2 are adjustable parameters of this model. It is obvious that the model has no theoretical background and it does not consider the composition of solvents used in the two-phase system.

The flowchart representing the procedure for tuning the described models is shown in Fig. 2. According to this flowchart, the objective function described below should be minimized to obtain the adjustable parameters of the models:

 
image file: c4ra11914b-t6.tif(10)
where N is the number of experimental data points and superscripts “calc.” and “expt.” stand for calculated and experimental results.


image file: c4ra11914b-f2.tif
Fig. 2 Flowchart representing the modeling procedure.

The comparisons between the experimental and those calculated by the models made through average absolute deviation percentage (AAD%), given by:

 
image file: c4ra11914b-t7.tif(11)

3. Results and discussion

3.1 Extraction of lipids from biomass

In this study, the main interest is on fatty acids instead of total lipids, as the former is more suitable for biodiesel production. The results of fatty acid extraction from the Chlorella vulgaris algal biomass are shown in Fig. 3. The fatty acid extraction yield attained in the first extraction step was 71.9 ± 7.2%. In the second extraction step from the biomass residue, the extraction yield increased up to 90.6 ± 6.3%. The third and fourth extraction steps increased the extraction yield to 92.2 ± 9.4% and 92.7 ± 4.2% respectively. Since using more than two steps did not improve the extraction yield significantly, when using 5 mL hexane and 5 mL ethanol the optimum extraction may take place in two steps. Under these conditions, fatty acid extraction yield of about 91% was achieved. The fatty acid profile of the extracted lipids was shown in Table 3.
image file: c4ra11914b-f3.tif
Fig. 3 The results of fatty acid extraction from the Chlorella vulgaris algal biomass: influence of extraction steps on the extraction yield.
Table 3 Fatty acid composition of Chlorella vurlgaris biomass
Trivial name Fatty acids Composition (% mass)
Myristic acid C14:0 3.12
Palmitic acid C16:0 26.43
Palmitoleic acid C16:1 3.57
Stearic acid C18:1 0.87
Oleic acid C18:2 50.14
Linoleic acid C18:3 12.95
Arachidic acid C20:0 2.12
  Others 0.84


3.2 Purification of extracted lipids

In addition to fatty acids, the crude oil obtained with mixture of polar and non-polar organic solvents contains pigments (carotenoids, chlorophylls, etc.), proteins, amino acids and other contaminants. The purification of the extracted lipids was carried out by adding water and hexane to form a biphasic system.

To investigate the purification process, several tests were performed by adding different amounts of water and hexane to the extraction mixture. Organic/aqueous phase ratio (w/w) for each test as well as the purification results (fatty acid partition coefficient and the fatty acid recovery yield) were reported in Table 4. Adding more hexane and water transferred more fatty acids to the organic phase; consequently, the fatty acid partition coefficients and recovery yield were increased. The reason is that an increase in the water content increased the solution polarity, decreased the miscibility of the two phases and increased the fatty acid recovery yield. On the other hand, by increasing hexane the equilibrium distribution of the fatty acids between the aqueous and the organic phases were displaced to the organic phase. Thus, combination of these effects has led to an increase in the fatty acid partitioning to the organic phase. The results were in a good agreement with previous studies.13,14

Table 4 Influence of adding different amount of hexane–water on the partitioning behavior of fatty acid in organic/aqueous phases. Initial mass of fatty acid in the extraction solution: 0.0297 g
Test no. Hexane (mL) Water (mL) Organic/aqueous phases ratio (w/w), r Kfa Rfa (%)
1 0 0.5 0.42 0.85 ± 0.19 26.4 ± 4.0
2 1 0.75 0.68 1.50 ± 0.31 50.6 ± 4.8
3 2 1 0.75 1.87 ± 0.46 58.4 ± 5.2
4 3 1.5 0.87 2.21 ± 0.48 65.7 ± 3.7
5 4 2 0.94 2.87 ± 0.15 73.0 ± 1.0
6 5 4 1.04 4.75 ± 0.36 83.1 ± 0.4
7 7 5 1.17 5.55 ± 0.41 87.0 ± 4.2
8 10 6 1.41 5.86 ± 0.28 88.9 ± 5.2


It should be noted that according to Table 4, the difference of fatty acid recovery yield between tests 7 and 8 was not significant. This means that fatty acid recovery yield did not improve very much if solvent amounts above stated in test 7 are added to the system. As such, this amount of solvents is the optimum dose for effective recovery yield.

The phase diagram of the system was shown in Fig. 4. The mass of organic and aqueous phases as well as composition of water, hexane and ethanol in the two phases was calculated using the UNIQUAC and the NRTL models according to the procedure described by Sørensen et al.28 As it can be seen, the results of the UNIQUAC and the NRTL models were nearly the same. According to Fig. 4, by adding a little amount of water and hexane (tests 1 and 2) the phase separation could not take place completely and some of the hexane transferred to the aqueous phase. This caused a fatty acid loss to the aqueous phase. On the other hand, by adding more water and hexane (tests 6 to 8) complete phase separation was achieved and almost no hexane was remained in the aqueous phase; as the consequences, fewer fatty acids were lost to the aqueous phase.


image file: c4ra11914b-f4.tif
Fig. 4 Phase diagram of organic/aqueous two-phase system which is estimated using the UNIQUAC and the NRTL models. The numbers on the graph indicated each test number of Table 4.

To investigate the purification efficiency of the proposed method, the mass of fatty acids and lipids recovered from the organic phase were shown in Fig. 5. As it can be observed, the fatty acid/lipid ratio was increased from test 1 to test 7, but no significant improvement was achieved from test 7 to 8. These findings indicated that adding more water and hexane increase the purification efficiency, which result to the increase of fatty acids amount in the extracted lipids. But adding more than specific amount of solvents did not improve the purification results very much.


image file: c4ra11914b-f5.tif
Fig. 5 Fatty acid and lipid recovered per mass of biomass and fatty acid/lipid ratio in organic phase for each test.

Effect of mass ratio of organic/aqueous phases on the fatty acid partitioning behavior was shown in Fig. 6. As can be seen by increasing the organic/aqueous mass ratio the fatty acid partition coefficient and fatty acid recovery was increased.


image file: c4ra11914b-f6.tif
Fig. 6 (a) Fatty acid partition coefficient and (b) fatty acid recovery during purification process which is estimated using the UNIQUAC, the NRTL and the Fajardo et al. models.

The hexane used for the purification step can be easily recovered by evaporation and reused in the process. The heat of vaporization of hexane is 241 kJ L−1 and the cost of electricity needed for this evaporation is 1.65 × 10⁻⁵ $ per kJ.29 So by considering a 30% safety factor the cost for vaporization of hexane is about 5.12 × 10⁻³ $ per L. The average price for algal fatty acid was considered to be 4.1 $ per kg.30 Based on the above assumption, the energy cost/algal fatty acid cost was plotted on Fig. 7. Using more amount of solvent than test 6 increased the energy cost/fatty acid cost. Thus by using solvent amount according to this test, the fatty acid recovery would be optimum both efficiently and economically.


image file: c4ra11914b-f7.tif
Fig. 7 Power cost needed for hexane evaporation per cost of recovered fatty acid for each test.

3.3 Estimation of fatty acid partitioning by using thermodynamic models

Experimental determination of fatty acid recovery yield during purification process for each data point may take a great deal of time and energy. Thermodynamic modeling is a suitable method for estimation of fatty acid partitioning behavior instead of performing experimental tests.

The UNIQUAC and the NRTL models were used to estimate the fatty acid partition coefficient and recovery yield in the biphasic system. The adjustable parameters of these models were tuned using the eight data points reported in Table 4. The results of fatty acid partition coefficient and fatty acid recovery yield were shown in Fig. 6. The model parameters and AAD% for both the UNIQUAC and the NRTL models were reported in Table 5. The results indicated that both models have good accuracy for estimation the partition coefficient (AAD% inferior to 8.69 and 9.46 for the UNIQUAC and the NRTL models, respectively) and recovery yield (AAD% inferior to 4.91 and 5.60 for the UNIQUAC and the NRTL models, respectively) of fatty acids in the organic/aqueous system, however the UNIQUAC equation has slightly better estimation.

Table 5 Adjustable parameters and AAD% of the thermodynamic modelsa
Model Adjustable parameters AAD%
Kfa Rfa (%)
a AAD: average absolute deviation.
UNIQUAC α = −3473.2 8.88 4.47
β = 362.9
NRTL α′ = −17.82 9.47 5.26
β′ = 49.38
Fajardo et al. C1 = 0.252 18.83 8.29
C2 = 2.522


To show the effectiveness of the thermodynamic models, their estimation was compared with the model proposed by Fajardo et al.13 The results indicated that AAD% of this model is 18.83 and 8.29 for fatty acid partition coefficient and fatty acid recovery yield, respectively which is far worse than the estimation of the thermodynamic models.

To investigate the predictive capability of the proposed models, they have been used to predict the partition coefficients and recovery yield of fatty acid in two other data points (Table 6). AAD% for fatty acid partition coefficient prediction was 8.94% and 9.85%, and AAD% for fatty acid recovery yield prediction was 5.20% and 6.16% for the UNIQAUC and the NRTL, respectively. These findings indicated the effectiveness of the proposed models for accurate prediction of the two-phase system in wide range of solvent mixtures.

Table 6 The results of fatty acid partition coefficient and recovery yield prediction using the thermodynamic modelsa
Hexane (mL) Water (mL) Partition coefficient (Kfa) Recovery yield (Rfa (%))
Expt. UNIQUAC NRTL Expt. UNIQUAC NRTL
a AAD: average absolute deviation.
7 3 3.87 3.76 3.67 84.33 82.95 82.61
1 1 1.04 1.22 1.21 41.67 45.65 46.42


4. Conclusions

In this study, a procedure of extraction and purification of lipids from Chlorella vulgaris biomass has been investigated. This procedure consists of two steps: (i) obtaining crude lipids by two-step extraction of the microalgal biomass with equivolume mixture of hexane and ethanol followed by (ii) purification of the crude lipids by washing with mixture of hexane and water. During the extraction process over 90% of the fatty acids in the biomass were extracted. For the purification of extracted lipids, mixture of hexane and water was added to the extraction mixture leading to form an organic/aqueous two-phase system. Several biphasic systems were formed by adding different amount of hexane and water to the extraction mixture, and the amount of lipids and fatty acids in the organic phase were measured.

The results showed that adding more water and hexane enhanced the fatty acid recovery as well as fatty acid/lipid ratio in the organic phase. Nevertheless, the maximum fatty acid recovery yield was 87% and adding more water and hexane did not improve the results significantly.

Two Gibbs free energy models have been employed to estimate the fatty acid partition coefficients and recovery yield during the purification process. The results revealed that these models can accurately estimate the fatty acid partition coefficient with AAD% inferior to 8.69 and 9.46 for the UNIQUAC and the NRTL models, respectively. The AAD% of fatty acid recovery yield was 4.91 and 5.60 for the UNIQUAC and the NRTL models, respectively.

Appendix

Activity coefficient for NRTL and UNIQUAC models

NRTL model:
 
image file: c4ra11914b-t8.tif(A1)
 
image file: c4ra11914b-t9.tif(A2)
 
Gji = exp(−αjiτji) (A3)
where m is number of component in the mixture, Mi is molecular weight of component i, R is universal gas constant T is temperature, αji is nonrandomness parameter and Δgji is energy parameters between component j and i.

UNIQUAC model:

 
ln[thin space (1/6-em)]γi = ln[thin space (1/6-em)]γCombi + ln[thin space (1/6-em)]γResi (A4)
 
image file: c4ra11914b-t10.tif(A5)
 
image file: c4ra11914b-t11.tif(A6)
 
image file: c4ra11914b-t12.tif(A7)
 
image file: c4ra11914b-t13.tif(A8)
 
image file: c4ra11914b-t14.tif(A9)
 
image file: c4ra11914b-t15.tif(A10)
 
image file: c4ra11914b-t16.tif(A11)
 
image file: c4ra11914b-t17.tif(A12)
where z is coordination number and is set to equal to 10 and Δaji is energy parameters between component j and i. r, q and q′ are pure component molecular structure constants.

Notes and references

  1. Y. C. Sharma, B. Singh and J. Korstad, Green Chem., 2011, 13, 2993–3006 RSC.
  2. F. Shi, P. Wang, Y. Duan, D. Link and B. Morreale, RSC Adv., 2012, 2, 9727–9747 RSC.
  3. Y. Chisti, Biotechnol. Adv., 2007, 25, 294–306 CrossRef CAS PubMed.
  4. I. Rawat, R. Ranjith Kumar, T. Mutanda and F. Bux, Appl. Energy, 2013, 103, 444–467 CrossRef CAS PubMed.
  5. R. Halim, B. Gladman, M. K. Danquah and P. A. Webley, Bioresour. Technol., 2011, 102, 178–185 CrossRef CAS PubMed.
  6. H.-Y. Shin, J.-H. Ryu, S.-Y. Bae, C. Crofcheck and M. Crocker, Fuel, 2014, 130, 66–69 CrossRef CAS PubMed.
  7. P. Kumari, C. R. K. Reddy and B. Jha, Anal. Biochem., 2011, 415, 134–144 CrossRef CAS PubMed.
  8. R. Halim, M. K. Danquah and P. A. Webley, Biotechnol. Adv., 2012, 30, 709–732 CrossRef CAS PubMed.
  9. G. Yoo, W.-K. Park, C. W. Kim, Y.-E. Choi and J.-W. Yang, Bioresour. Technol., 2012, 123, 717–722 CrossRef CAS PubMed.
  10. C.-Z. Liu, S. Zheng, L. Xu, F. Wang and C. Guo, Appl. Energy, 2013, 102, 971–974 CrossRef CAS PubMed.
  11. J.-Y. Lee, C. Yoo, S.-Y. Jun, C.-Y. Ahn and H.-M. Oh, Bioresour. Technol., 2010, 101, S75–S77 CrossRef CAS PubMed.
  12. P. D. Patil, V. G. Gude, A. Mannarswamy, S. Deng, P. Cooke, S. Munson-McGee, I. Rhodes, P. Lammers and N. Nirmalakhandan, Bioresour. Technol., 2011, 102, 118–122 CrossRef CAS PubMed.
  13. A. R. Fajardo, L. E. Cerdán, A. R. Medina, F. G. A. Fernández, P. A. G. Moreno and E. M. Grima, Eur. J. Lipid Sci. Technol., 2007, 109, 120–126 CrossRef CAS.
  14. E. M. Grima, A. R. Medina, A. G. Giménez, J. A. Sánchez Pérez, F. G. Camacho and J. L. García Sánchez, J. Am. Oil Chem. Soc., 1994, 71, 955–959 CrossRef.
  15. M. G. Freire, A. R. R. Teles, J. N. Canongia Lopes, L. P. N. Rebelo, I. M. Marrucho and J. A. P. Coutinho, Sep. Sci. Technol., 2011, 47, 284–291 CrossRef.
  16. G. Pazuki, M. Vossoughi and V. Taghikhani, J. Chem. Eng. Data, 2009, 55, 243–248 CrossRef.
  17. S. Shahriari, V. Taghikhani, M. Vossoughi, A. A. Safe kordi, I. Alemzadeh and G. R. Pazuki, Fluid Phase Equilib., 2010, 292, 80–86 CrossRef CAS PubMed.
  18. H. W. Nichols, Handbook of Phycological Methods: Culture Methods and Growth Measurements, Cambridge University Press, Cambridge, 1973, pp. 7–24 Search PubMed.
  19. P. P. Lamers, C. C. van de Laak, P. S. Kaasenbrood, J. Lorier, M. Janssen, R. C. De Vos, R. J. Bino and R. H. Wijffels, Biotechnol. Bioeng., 2010, 106, 638–648 CrossRef CAS PubMed.
  20. M. Hakim, H. Abedini Najafabadi, G. Pazuki and M. Vossoughi, Ind. Eng. Chem. Res., 2013, 53, 855–864 CrossRef.
  21. G. Lepage and C. C. Roy, J. Lipid Res., 1984, 25, 1391–1396 CAS.
  22. H. Renon and J. M. Prausnitz, AIChE J., 1968, 14, 135–144 CrossRef CAS.
  23. D. S. Abrams and J. M. Prausnitz, AIChE J., 1975, 21, 116–128 CrossRef CAS.
  24. E. Batista, S. Monnerat, K. Kato, L. Stragevitch and A. J. A. Meirelles, J. Chem. Eng. Data, 1999, 44, 1360–1364 CrossRef CAS.
  25. W. Arlt, Liquid-Liquid Equilibrium Data Collection, ed. M. E. A. Macedo, P. Rasmussen and J. M. Sørensen, DECHEMA Chemistry Data Series, Frankfurt, 1979, vol. V, part 3, p. 364 Search PubMed.
  26. A. Vetere, Fluid Phase Equilib., 2004, 218, 33–39 CrossRef CAS PubMed.
  27. C. M. Hansen, Hansen solubility parameters: a user's handbook, CRC Press, Florida, 2nd edn, 2007, Appendix A, Table A.1 Search PubMed.
  28. J. M. Sørensen, T. Magnussen, P. Rasmussen and A. Fredenslund, Fluid Phase Equilib., 1979, 3, 47–82 CrossRef.
  29. E. Molina Grima, E. H. Belarbi, F. G. Acién Fernández, A. Robles Medina and Y. Chisti, Biotechnol. Adv., 2003, 20, 491–515 CrossRef CAS.
  30. J. N. Rogers, J. N. Rosenberg, B. J. Guzman, V. H. Oh, L. E. Mimbela, A. Ghassemi, M. J. Betenbaugh, G. A. Oyler and M. D. Donohue, Algal Res., 2014, 4, 76–88 CrossRef PubMed.

This journal is © The Royal Society of Chemistry 2015
Click here to see how this site uses Cookies. View our privacy policy here.