
A supramolecular probe for colorimetric detection of Pb2+ based on recognition of G-quadruplex†
Hongbo Chenab,
Hongxia Sun*b,
Xiufeng Zhang*a,
Xiaoran Suna,
Yunhua Shib and
Yalin Tang*b
aCollege of Chemistry Engineering, Hebei United University, Tangshan, Hebei 063009, PR China. E-mail: zhangxf@heuu.edu.cn
bNational Laboratory for Molecular Sciences, Center for Molecular Sciences, State Key Laboratory for Structural Chemistry of Unstable and Stable Species, Institute of Chemistry Chinese Academy of Sciences, Beijing 100190, PR China. E-mail: hongxsun@iccas.ac.cn; tangyl@iccas.ac.cn
First published on 28th November 2014
Abstract
A colorimetric probe of Pb2+ has been designed based on the mechanism that a supramolecular probe selectively recognized the Pb2+-induced conformational transition of G-quadruplexes. The probe exhibited high sensitivity and selectivity towards Pb2+, which enabled it to be practically used in detection of the Pb2+ level in a freshwater system.
Lead (Pb) is a major heavy-metal pollutant in the environment and has a seriously adverse effect on human health. Many problems including chronic mental and physical developmental issues in babies and children, renal disease, and hypertension in adults have been found to be intimately related to the poisoning action of lead.1 Therefore, the detection of Pb2+ in environmental and biological samples is of considerable importance. Accordingly, it has attracted significant attention to detect Pb2+ below the defined toxic level. Towards this goal, plenty of techniques have been used in the detection of Pb2+.2 In the past few years, many highly sensitive and selective Pb2+ probes have been designed and constructed, most of which are based on Pb2+-specific functional DNA molecules such as RNA-cleaving DNAzyme.3 Nevertheless, these probes depend on complicated equipment and expensive technology, which has limited their practical use.
Recently, there is great interest in using G-quadruplex to design nucleic acid-based Pb2+ probes.4 G-quadruplex is a four-stranded secondary structure stacked by G-quartets connected by Hoogsteen-type base pairing, which is generally stabilized by monovalent metal cations such as K+ and Na+ in solution.5 However, there are some specific G-quadruplexes like the G-quadruplexes formed by PS2.M, pw17, and T30695 showing specifically affinity to Pb2+, which were then utilized to develop Pb2+ sensors.6 These G-quadruplex-based Pb2+ sensors exhibited high selectivity and sensitivity. However, the measurement is also dependent on costly instruments. To conveniently monitor Pb2+, a simple and fast approach is still in great demand.
In our previous studies, we have designed a series of ion probes based on the cyanine dye aggregates recognizing G-quadruplex structures,7 which exhibited great advantages in simple operation and low requirement for equipment. Encouraged by these performances, further we made great effort to design a Pb2+ sensor by using the cyanine dye aggregates of 3,3′-di(3-sulfopropyl)-4,5,4′,5′-dibenzo-9-methylthiacarbocyanine triethylammonium salt (MTC). MTC assembles to form J-aggregates by the short-range noncovalent interaction forces such as van der Waals and π–π stacking interactions in aqueous solution,8 which was identified by a strong bathochromic effect in the absorption spectra of MTC (Fig. S1†). The aggregates are extremely sensitive to the PS2.M G-quadruplex structures. With recognition of the PS2.M G-quadruplex structures, MTC shows a significant change in absorption spectra. This feature allows us to utilize MTC as a colorimetric probe to monitor the conformational transition of the PS2.M G-quadruplexes induced by Pb2+ and realize the quantitate detection of Pb2+ (Scheme 1).
 | ||
| Scheme 1 The structure of MTC and the schematic illustration for the mechanism of sensing Pb2+ by using MTC and PS2.M G-quadruplex. | ||
Three G-quadruplexes (PS2.M, pw17, and T30695) are known to specially respond to Pb2+.6 Their G-quadruplex conformations in the solution with K+ or Pb2+ are different, all of which exhibited more antiparallel feature in the solution with Pb2+ compared with that in the solution with K+.6 It has been found that MTC showed a much weaker affinity towards the antiparallel G-quadruplex structures.9 Thus we speculate that MTC will show a decreased affinity with Pb2+ inducing the conformational transition of these three G-quadruplexes. To validate the speculation, the absorption spectra of MTC with increasing amounts of different G-quadruplexes were determined. Without G-quadruplexes present, MTC in buffer solution exhibited a sharp absorption band around 658 nm, which belonged to J-aggregate. With titration of three G-quadruplexes that were induced by K+, MTC exhibited a sharp decrease of the absorbance at 658 nm while an increase of the absorbance at 580 nm (Fig. 1a and S2†), corresponding to the transition from J-aggregate to monomer of MTC.10 The results supported the high affinity of MTC towards the K+-induced G-quadruplexes. However, with addition of the Pb2+-induced G-quadruplexes, slight changes of the absorbance at 580 nm were observed (Fig. 1b and S2†), meaning a weaker affinity of MTC towards the Pb2+-induced G-quadruplexes. Comparing the absorbance at 580 nm of MTC without and with 40 μM Pb2+, we found that the absorbance of MTC exhibited the most difference in presence of PS2.M (Fig. 1c), which means that PS2.M–MTC is more sensitive to Pb2+.
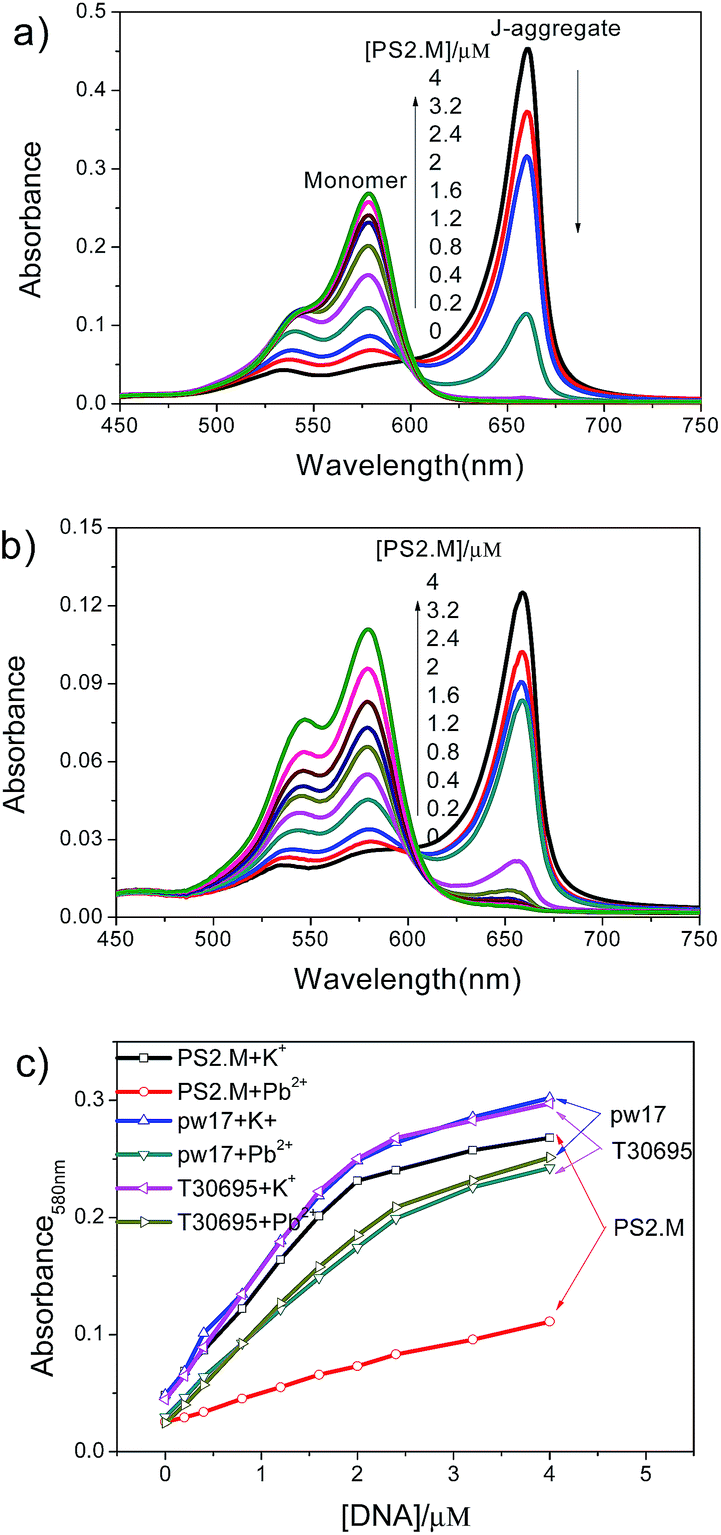 | ||
| Fig. 1 The absorption spectra of 4 μM MTC with increasing PS2.M (a) in absence of Pb2+ and (b) in the presence of 40 μM Pb2+ in 10 mM Tris buffer solution (pH 7.2) with 10 mM K+. (c) Plots of the absorbance at 580 nm versus the concentrations of different G-quadruplexes. | ||
It is reported that Pb2+-stabilized G-quadruplexes have shorter M–O and O–O bonds than K+-stabilized G-quadruplexes,11 and Pb2+ can competitively bind to the K+-stabilized G-quadruplexes and then replace K+, resulting in transition of the G-quadruplex conformations. As shown in Fig. 2a, PS2.M exhibited the CD spectral feature of parallel G-quadruplex structure in the presence of K+.12 The parallel G-quadruplex binds to MTC with high affinity, making MTC to exhibit a strong monomer band in absorption spectra (Fig. 2b). On addition of Pb2+, PS2.M was induced to form antiparallel G-quadruplex according to the CD spectra,13 which had weak affinity towards MTC, and thus the absorbance of MTC monomers obviously decreased. The absorbance of MTC monomers with Pb2+ has a good linear correlation within the range of 0 to 5 μM Pb2+. These results provide a rationale for utilizing MTC as a probe to analyze Pb2+ quantitatively using colorimetric means.
 | ||
| Fig. 2 (a) The CD spectra of 2 μM PS2.M G-quadruplex with increasing [Pb2+] in 10 mM Tris buffer solution (pH 7.2) with 10 mM K+ with 4 μM MTC present. (b) The absorption spectra of 4 μM MTC with increasing [Pb2+] in 10 mM Tris buffer solution (pH 7.2) with 10 mM K+ and 2 μM PS2.M. The insert is the plots of the absorbance at 580 nm versus [Pb2+]. | ||
To find the optimal condition for Pb2+ detection, the concentration of K+ as well as the molar concentration ratio between MTC and PS2.M has been further studied. The absorption spectra of MTC in the presence of PS2.M were first measured with titration of K+. In the absence of K+, G-quadruplex structures should not form and MTC will exist in the aggregate state owing to the weak affinity between MTC and single-stranded DNA. This speculation can be supported by the spectra of Fig. 3a, which exhibited a maximum absorbance at 530 nm, belonging to MTC H-aggregate.9,10 With increasing the concentration of K+, there is an obvious enhancement of the absorbance at 580 nm (Fig. 3a), meaning the transition of MTC from H-aggregate to monomer. The reason for this transition is due to the formation of PS2.M G-quadruplex structure which shows a high affinity to MTC monomer. The enhancement of the absorbance at 580 nm was saturated when the concentration of K+ was more than 1 mM which was in accordance the complete formation of G-quadruplex structure.14 Based on the above results, more than 1 mM K+ was used to construct the Pb2+ probe.
 | ||
| Fig. 3 (a) The absorption spectra of 4 μM MTC with increasing K+ in the buffer solution containing 2 μM PS2.M, and the insert shows the relationship between absorbance at 580 nm and [K+]. (b) The absorption spectra of 4 μM MTC with different concentrations of PS2.M at 580 nm in 10 mM Tris–K+ (pH 7.2). | ||
The effect of the molar concentration ratio between MTC and PS2.M was evaluated by measuring the absorbance at 580 nm of MTC with increasing Pb2+ in the presence of variant concentrations of PS2.M. Fig. 3b depicts a larger change of MTC absorbance versus trace Pb2+ under the condition with a lower [PS2.M]/[MTC], meaning a higher sensitivity will be obtained when the probe has a lower [PS2.M]/[MTC]. However, we should note that a much lower [PS2.M]/[MTC] will also cause a narrow detection range.
The sensitivity of the Pb2+ sensor has been evaluated according to the above optimal condition. In the low concentration of PS2.M, the probe is more sensitive to Pb2+. The state of MTC is mainly monomers when the concentration of PS2.M is 0.5 μM, responding to the positive band at 580 nm. The absorption intensity has a sharp decrease accompany with the increasing concentration of Pb2+ at 580 nm. Fig. 4 shows the intensity change of against the concentration of Pb2+ from 0 μM to 5 μM, showing a perfect linear response towards Pb2+. There is a clear trend that the spectra intensity decreases with increasing concentration of Pb2+ at 580 nm. The limit of quantitative determination for Pb2+ should be 1.4 nM according to the 3σ/slope rule (σ represents the standard deviation of the blank samples, which is 0.0648, while the slope is 0.139 according to the inset figure in Fig. 4a.), which provided a comparable sensitivity towards Pb2+ relative to other fluorescence sensors of Pb2+.15
 | ||
| Fig. 4 The absorption spectra of 0.5 μM PS2.M and 4 μM MTC in 10 mM Tris buffer solution with 1 mM K+ (pH 7.2) to analyze different concentrations of Pb2+. The insert shows linear correlation of the absorbance change with logarithmic concentrations of Pb2+. | ||
The selectivity of this probe of Pb2+ detection is evaluated by testing the absorbance of MTC in the presence of other common metal ions including Hg2+, Ni2+, Mn2+, Co2+, Cd2+, Cu2+, Ca2+, Mg2+, Fe3+ and Zn2+. It is reported that Hg2+ has potential influence on the precise detection of Pb2+ because Hg2+ can combine to thymine into the formation of T–Hg2+–T base pairs.16 PS2.M contains a few of T residues, thereby it is possible that Hg2+ will affect the PS2.M G-quadruplex structures. To overcome this problem, we choose SCN− as a chelator to avoid the interference of Hg2+ according to the strategy that previous reported.17 Fig. 5 shows the change of absorbance of MTC for analyzing different metal ions in the presence of 5 mM SCN−, the concentration of which is high enough to eliminate the possible interference of Hg2+. The concentration of metal ions is 5 μM, only Pb2+ causes a sharp decrease. The result indicates that the probe has a better selectivity towards Pb2+ over other common metal ions.
 | ||
| Fig. 5 Selectivity assays based on the MTC/PS2.M complex in 10 mM Tris buffer solution (pH 7.4) with the assistance of masking agent KSCN (5 mM). All the metal ions were used at the concentration of 5 μM (A0 and A stand for the absorbance at 580 nm in the absence and presence of metal ions). | ||
The response of the MTC–DNA probe system to Pb2+ is quick. The time-dependent absorbance measurement was done once Pb2+ was injected in. MTC exhibited a sharp decrease of the absorbance at 580 nm after Pb2+ was added in (Fig. 6). The absorbance reached the minimum value within 8 minutes according to the time appeared in the inflection points, meaning the probe has the performance of quick measurement.
 | ||
| Fig. 6 The absorbance at 580 nm of MTC with time after addition of Pb2+ in the presence of PS2.M. | ||
To demonstrate the application of the probe in real example, we apply MTC to analyze the lake water. The water samples are centrifuged two times through centrifugal machine. We use the recovery of Pb2+ added in lake water to evaluate the accuracy of the probe. 10% lake water was titrated into the probe solution to detect the recovery. The results are shown in Table 1. It is found that the recovery is high with the Pb2+ concentrations from 0.45 to 9.95 μM, which suggests that our designed G-quadruplexes-based probe can be applied to the detection of Pb2+ in lake water with a high accuracy.
Conclusions
In summary, we have design a G-quadruplex-based supramolecular colorimetric probe with high sensitivity and selectivity for Pb2+ detection. In the presence of K+, PS2.M was induced to form parallel G-quadruplex structure, whereas Pb2+ could competitively bind to PS2.M and induce PS2.M to form an antiparallel G-quadruplex structure. MTC exhibited great changes in its absorption spectra following the conformational transition of PS2.M G-quadruplexes owing to the different affinity of MTC towards the parallel and antiparallel G-quadruplex structures. The mechanism made colorimetric detection of Pb2+ be feasible by using MTC and PS2.M G-quadruplexes. The probe has been proved to show a high sensitivity with the detection limit of 1.4 nM and a high selectivity towards Pb2+ over other common metal ions. The excellent performance enabled the probe to be applied to analyze the Pb2+ in lake water. Compared to those fluorescence and electrochemical probes, the MTC supramolecular colorimetric probe exhibited great advantages in simple operation and low requirement for equipment, implying a promising application.Acknowledgements
This research was supported under Major National Basic Research Projects (973) (Grant no. 2011CB606104), the National Natural Science Foundation of China (grant numbers 31200576 and 21443011), Chinese Academy of Sciences (Grant no. KJCX2-EW-N06-01), open project program of Beijing National Laboratory for Molecule Sciences, and National Natural Science Foundation of Hebei Province (no. B2012401026).Notes and references
- H. Needleman, Annu. Rev. Med., 2004, 55, 209–222 CrossRef CAS PubMed; M. Riess and J. Halm, J. Gen. Intern. Med., 2007, 22, 1212 CrossRef PubMed.
- C. Huang and C. Ding, Anal. Chim. Acta, 2011, 699, 198 CrossRef CAS PubMed; G. Pelossof, R. Tel-Vered and I. Willner, Anal. Chem., 2012, 84, 3703 CrossRef PubMed.
- J. Liu and Y. Lu, J. Am. Chem. Soc., 2004, 126, 12298 CrossRef CAS PubMed; Y. Xiang, A. Tong and Y. Lu, J. Am. Chem. Soc., 2009, 131, 15352 CrossRef PubMed.
- T. Li, E. K. Wang and S. J. Dong, Anal. Chem., 2010, 82, 1515 CrossRef CAS PubMed; H. Z. He, K. H. Leung, H. Yang, D. S. H. Chan, C. H. Leung, J. Zhou, A. Bourdoncle, J. L. Mergny and D. L. Ma, Biosens. Bioelectron., 2013, 41, 871 CrossRef PubMed.
- J. R. Williamson, M. K. Raghuraman and T. R. Cech, Cell, 1989, 59, 871 CrossRef CAS; T. Li, E. K. Wang and S. J. Dong, J. Am. Chem. Soc., 2009, 131, 15082 CrossRef PubMed.
- F. Li, Y. Feng, C. Zhao and B. Tang, Chem. Commun., 2011, 47, 11909 RSC; T. Li, S. J. Dong and E. K. Wang, Chem.–Asian J., 2009, 4, 918 CrossRef CAS PubMed; P. Travascio, P. K. Witting, A. G. Mauk and D. Sen, J. Am. Chem. Soc., 2001, 123, 1337 CrossRef PubMed.
- H. X. Sun, J. F. Xiang, W. Gai, Y. Liu, A. J. Guan, Q. F. Yang, Q. Li, Q. Shang, H. Su, Y. L. Tang and G. Z. Xu, Chem. Commun., 2013, 49, 4510 RSC; H. X. Sun, J. F. Xiang, W. Gai, Q. Shang, Q. Li, A. J. Guan, Q. F. Yang, Y. Liu, Y. L. Tang and G. Z. Xu, Analyst, 2012, 137, 5713 RSC.
- J. H. Furhop and J. Koenig, Membranes and Molecular Assemblies: the Synkinetic Approach, Royal Society of Chemistry, Cambridge, 1994 Search PubMed.
- Q. F. Yang, J. F. Xiang, S. Yang, Q. Li, Q. J. Zhou, A. J Guan, L. Li, Y. X. Zhang, X. F. Zhang, H. Zhang, Y. L. Tang and G. Z. Xu, Anal. Chem., 2010, 82, 9135 CrossRef CAS PubMed.
- H. X. Sun, J. F. Xiang, Q. F. Yang, Q. Shang, Q. J. Zhou, Y. X. Zhang, G. Z. Xu and Y. L. Tang, Appl. Phys. Lett., 2011, 98, 031103 CrossRef PubMed.
- F. W. Kotch, J. C. Fettinger and J. T. Davis, Org. Lett., 2000, 2, 3277 CrossRef CAS PubMed.
- R. Jin, B. L. Gaffney, C. Wang, R. A. Jones and K. J. Breslauer, Proc. Natl. Acad. Sci. U. S. A., 1992, 89, 8832 CrossRef CAS.
- D. M. Gray, J. D. Wen, C. W. Gray, R. Repges, C. Repges, G. Raabe and J. Fleischhauer, Chirality, 2008, 20, 431 CrossRef CAS PubMed.
- N. V. Hud and J. Plavec, in Quadruplex Nucleic Acids, ed. S. Neidle and S. Balasubramanian, 2006, p. 100 Search PubMed.
- T. Li, S. J. Dong and E. K. Wang, J. Am. Chem. Soc., 2010, 132, 13156 CrossRef CAS PubMed; L. Q. Guo, D. D. Nie, C. Y. Qiu, Q. S. Zheng, H. Y. Wu, P. R. Ye, Y. L. Hao, F. F. Fu and G. N. Chen, Biosens. Bioelectron., 2012, 35, 123 CrossRef PubMed; D. P. Zhang, L. Yin, Z. H. Meng, A. C. Yu, L. H. Guo and H. L. Wang, Anal. Chim. Acta, 2014, 812, 161 CrossRef PubMed.
- M. Zhang, H. N. Le, P. Wang and B. C. Ye, Chem. Commun., 2012, 48, 10004 RSC; M. Zhang, H. N. Le, X. Q. Jiang and B. C. Ye, Chem. Commun., 2013, 49, 2133 RSC.
- T. Li, S. J. Dong and E. K. Wang, Anal. Chem., 2009, 81, 2144 CrossRef CAS PubMed; T. Li, B. Li, S. J. Dong and E. K. Wang, Chem. Commun., 2009, 3551 RSC.
Footnote |
| † Electronic supplementary information (ESI) available: Details of materials, methods, and Fig. S1–S3. See DOI: 10.1039/c4ra11395k |
| This journal is © The Royal Society of Chemistry 2015 |