Enhanced multi-phonon Raman scattering and nonlinear optical power limiting in ZnO:Au nanostructures†
R. Udayabhaskara,
B. Karthikeyan*a,
P. Sreekanthb and
Reji Philip*b
aDepartment of Physics, National Institute of Technology, Tiruchirappalli 620 015, India. E-mail: bkarthik@nitt.edu
bUltrafast and Nonlinear Optics Lab, Light and Matter Physics Group, Raman Research Institute, Bangalore 560080, India. E-mail: reji@rri.res.in; Fax: +91-0431-2500133; Tel: +91-0431-2503612
First published on 15th January 2015
Abstract
We report the synthesis of ZnO:Au hetero structures, their Raman scattering and optical power limiting efficiencies. ZnO:Au nanostructures with flower-like morphology were obtained by the self-assembly of ZnO nano entities using Au nanoparticles as seeds. Compared to ZnO nanostructures, ZnO:Au nanocomposites show enhanced UV emission and decrease in green emission. Increases in the intensities of Raman bands and multiphonon Raman bands of nano ZnO are observed substantially in the nanocomposites. Raman results further indicate that lattice vibrations of semiconductors are sensitive to the presence of metal nanoparticles. Open aperture Z-scan measurements carried out at 532 nm using 5 ns laser pulses reveal metal nanoparticle induced changes in the optical limiting properties of the nanocomposites.
Introduction
Hybrid composite nanomaterials with multiple/novel properties find applications in the areas of opto-electronics, catalysis, sensing and medicine.1–8 Semiconductor/noble metal nanocomposite materials have received substantial attention from the research community because of their wide range of applications.9–11 The requirements for technological applications can be met by designing semiconductor/metal nanocomposites with enhanced optical, electrical and sensing properties. Hetero ZnO/metal nanostructures with multiple/novel properties can be obtained by combining semiconducting ZnO nanomaterials with metal nanoparticles (NP). Being a wide and direct band gap (∼3.37 eV) material with a large exciton binding energy (60 meV) and efficient light emission, semiconducting ZnO is a promising candidate for opto-electronics,12,13 solar-cells,14 sensors,15 catalysis16,17 and biological18 applications.19,20 Among metals, noble metal NPs showing surface plasmon resonance (SPR) associated with the collective oscillation of their conduction band electrons exhibit absorption in the visible range. Noble metal NPs such as Ag and Au possess strong optical absorption at ∼430 nm and ∼530 nm by their plasmon resonances, respectively. Gold NPs with size related optical and electrical properties find applications in various technologies.21 Au NPs present in the ZnO system will strongly influence UV and green emissions of ZnO by their surface plasmons.22–24 Hybrid nanostructures consisting of Au and ZnO (ZnO:Au nanocomposites) with novel properties can be tailored for use in applications such as photo-catalysis,25 biosensors26 and solar cells.27,28 Since the presence of metal NPs can lead to enhanced Raman scattering from the surrounding medium, noble metal NPs are promising candidates for SERS (surface enhanced Raman scattering) substrates.29As a tool for trace-level molecule detection, SERS has received substantial attention from the scientific and technological community. Two mechanisms that contribute to the SERS phenomenon are electromagnetic and chemical enhancements. The local field of metal NPs is maximized when the excitation wavelength falls near the SPR. Local field enhancement in the vicinity of metal NPs is the origin of electromagnetic enhancement, while electron transfer between metal and medium/surface molecules leads to chemical enhancement. Chemical and biomolecular sensors based on (semiconductor/metal) ZnO:Au NPs utilizing the SERS mechanism have been investigated.30–33 In general, semiconducting/metal nanocomposites will show enhanced Raman scattering from the semiconducting system. The presence of metal NPs, whose SPR lies in the visible region, will greatly influence the nonlinear optical behavior of semiconductor NPs as well. ZnO is a wide band gap semiconductor, and is well known for its nonlinear optical properties.34–38
In the present work we show that the presence of gold NPs during the synthesis of nano ZnO leads to the formation of ZnO:Au nanocomposites with a flower-like morphology. The SPR band of Au affects the properties of ZnO:Au nanocomposites significantly. For instance, compared to ZnO nanostructures, ZnO:Au nanocomposites show enhanced UV emission and suppressed green emission. Raman scattering of ZnO shows a substantial enhancement in ZnO:Au nanocomposites due to local field enhancement. Nonlinear light transmission studies performed using open aperture Z-scan at 532 nm, employing 5 ns laser pulses, reveal an enhanced optical limiting behaviour in the nanocomposites. The results are analyzed and discussed.
Experimental
For the synthesis of ZnO:Au nanocomposites, initially a seed solution of gold NPs is synthesized by reducing chloroauric acid of known concentration using trisodium citrate and sodium borohydride. In a typical reaction, 200 mL (0.3 mM) aqueous solution of gold chloride and trisodium citrate are added to 100 mM, 6 mL aqueous solution of sodium borohydride (here after in the text this final solution is referred as solution 1). The growth process of Au NPs in citrate reduction process usually includes the rapid formation of nuclei followed by coalescence or Ostwald ripening (results in bigger particles), and finally the consumption of the remaining Au(III) species, resulting in particles of even larger size. Two seed solutions of gold NPs are thus prepared, having growth times of 1 hour and 2 hours respectively. In another flask 120 mL, 11 mM ethanol (solvent) solution of zinc nitrate and CTAB is prepared (solution 2). Now, 50 mL of gold solution (solution 1) of 1 hour growth time is added to 50 mL of solution 2, into which 50 mL, 100 mM sodium hydroxide solution is added in drops. The precipitate is collected, washed with ethanol followed by double distilled water, and dried in hot air oven at 60 °C for 4 hours. In a similar manner, gold solution with 2 hours growth time is used for preparing another ZnO:Au nanocomposite sample. For reference studies pure ZnO (without gold content) is prepared by mixing solution 2 with sodium hydroxide solution. The samples are given code names ZAu0, ZAu1 and ZAu2, which indicate pure ZnO, nanocomposite prepared using gold solution of 1 h growth time and nanocomposite prepared using gold solution of 2 h growth time, respectively.X-ray diffraction (XRD) of the prepared samples in the 20–80° diffraction angle range (2θ) have been recorded using a Rigaku Dmax 2000 XRD instrument. Optical absorption spectra in the 300–900 nm range were measured on a Perkin Elmer UV-Visible spectrophotometer. Photoluminescence (PL) measurements of the samples (water suspensions) were carried out in a spectrofluorometer (Fluoromax, HORIBA JobinYvon) at an excitation wavelength of 330 nm. A micro Raman spectrometer (Jobin-Yvon, 514.5 nm, 5 mW excitation by Argon ion laser) was used for Raman scattering measurements. A Nd:YAG laser (Continuum, Minilite) emitting 5 ns pulses (FWHM) at the second harmonic wavelength of 532 nm, run in single-shot mode, was used for the nonlinear optical studies.
Results and discussion
XRD studies
The crystalline nature and purity of the as-synthesized ZnO:Au hybrids were examined using X-ray diffraction (XRD). Fig. 1 shows XRD patterns of pure ZnO as well as hybrids synthesized using the two different Au seed solutions. Diffraction signals are readily identified against the (indexed) standard Bragg reflections of hexagonal wurtzite structured ZnO. In comparison, diffraction patterns of ZnO:Au nanocomposites show additional diffraction peaks at 38.2°, 44.4° and 64.7° corresponding to the (111), (200) and (220) Bragg reflections from the face centered cubic phase of Au. The average crystallite size (D) has been estimated using Scherrer's formula as
 | (1) |
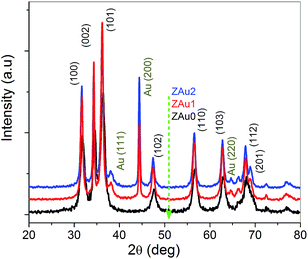 | ||
| Fig. 1 XRD patterns of pure ZnO (ZAu0), and ZnO:Au nanocomposites prepared using gold solutions of 1 h (ZAu1) and 2 h (ZAu2) growth times. | ||
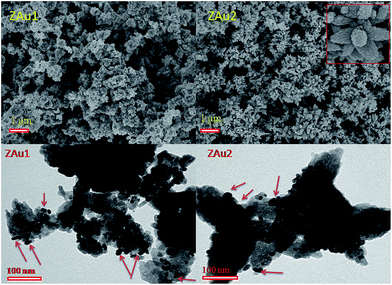
Morphological properties of the ZnO:Au nanocomposites can be determined from Field Emission Scanning Electron Microscopy (FESEM) and transmission electron microscopy (TEM) images (Fig. 2). A flower-like morphology is observed in ZAu2 sample, while ZAu1 shows irregular formations (early stages of flower-like morphology). TEM images depict the presence of nearly spherical, small gold NPs either over the surface of the ZnO nanostructures or attached with them. The gold NPs are bigger in ZAu2. The observed size increase of gold NPs with growth time is supported by optical absorption studies as well (given in the next section). For reference SEM image of pure ZnO (without gold content), which shows irregular, agglomerated morphology is provided in ESI (Fig. ES1†). From SEM and TEM images it is evident that the nanostructures are formed by the aggregation of nano entities. During the synthesis of ZnO the presence of Au NPs influences the aggregation of nano entities and induces morphology changes, which results in flower-like assemblies when Au NPs are bigger in size.
Optical absorption studies
Absorption spectra of the prepared samples are given in Fig. 3. The band at ∼363 nm arises from excitonic absorption of ZnO nanostructures (ZAu0). The ZnO:Au nanocomposite exhibits strong absorption in the UV and visible regions, which arises from excitonic and surface plasmon absorptions of nano ZnO and gold NPs respectively. The UV band (excitonic) gets shifted to the higher wavelength side in the presence of Au NPs in ZAu1 and ZAu2, which can be attributed to the morphological changes happening in the samples as seen from the SEM and TEM micrographs. The plasmon peak of ZAu2 shows a red shift from the usual plasmon peak position of gold NPs (which is around ∼532 nm), and shows a broad dual band nature. The plasmon peak for metal nanoparticles is governed by the relation39| λp = [4π2c2meffε0/Ne2]1/2 | (2) |
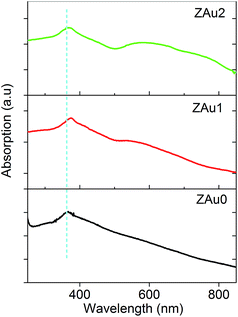 | ||
| Fig. 3 Optical absorption spectra of ZnO and ZnO:Au nanocomposites. The broad band in the higher wavelength range which is more prominent in ZAu1 and ZAu2 arises from surface plasmons. | ||
Photoluminescence studies
Emission characteristics of pure ZnO and ZnO:Au nanocomposites are compared in Fig. 4. PL spectra of ZAu0 shows two relatively strong peaks in the UV and visible spectral regions respectively. By comparison with ZAu0 sample, luminescence from ZAu1 and ZAu2 samples show stronger UV emission and weaker visible emission. The strong UV emission seen in all the samples which centers around 374 nm can be attributed to the recombination of excitons while the emission seen in the visible region centered around 550 nm can be attributed to oxygen vacancies.42 UV emission is enhanced and deep level emission is suppressed (not completely quenched) in the nanocomposites, while a strong deep level emission is observed in the pure ZnO sample. The observed changes in the PL spectra can be attributed to the presence of Au NPs (in contact with ZnO) and the interaction between Au surface plasmons and the incoming electromagnetic field of the incident 330 nm excitation light. Local field enhancement close to the Au NPs can enhance the excitation and emission rates of ZnO.43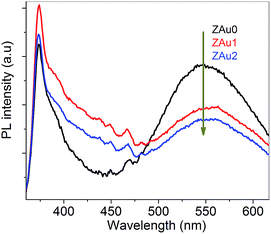 | ||
| Fig. 4 Photoluminescence spectra of ZnO and ZnO:Au nanocomposites obtained with 330 nm excitation at room temperature. | ||
The reasons for the observed enhanced UV emission and decreased visible emission in the present ZnO:Au nanocomposites are the following: deep level emission in the visible region falls in the SPR region of Au NPs, and the interface between Au NPs and ZnO allows the transfer of electrons by plasmon coupling. Thus electrons in the defect levels favourable for visible emission (which falls in the SPR range of Au NP's) get transferred to Au NP.39 This transfer will reduce/suppress visible emission from ZnO. On the other hand the presence of the metal–metal oxide interface in ZnO:Au nanocomposites leads to plasmon–exciton coupling and favours the transfer of electrons from Au to the conduction band of ZnO.44 This coupling results in the enhancement of UV emission in ZnO:Au nanocomposites.31 The presence of broad green band emission in ZAu1 and ZAu2 shows that a good number of oxygen vacancies are present even after nanocomposite formation, which favours deep level emission.41
Raman studies
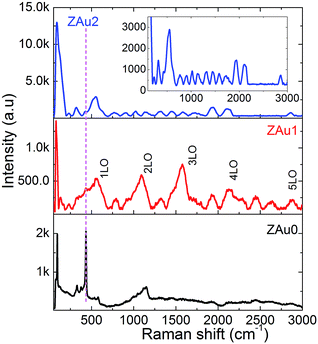
Fig. 5 presents room temperature Raman spectra measured in the spectral range of 60–3000 cm−1. By the predictions of group theory, wurtzite ZnO with two formula units per primitive cell belongs to the C46v space group. For ZnO, the E2Low, E2High, A1 and E1 longitudinal optical (LO) modes, A1 and E1 transverse optical (TO) modes, and modes related to second order processes (e.g. 2E2Low, E2High–E2Low etc.) are Raman active. Apart from these, silent modes (B1Low, 2B1Low) and local lattice vibration or disorder induced scattering related modes also will be observed.45 A prominent peak which appears at ∼95 cm−1 in the Raman spectrum of pure ZnO is the fundamental E2Low mode which is associated with the vibration of Zn atoms in the ZnO lattice. Another strong band that appears at ∼435 cm−1 is the E2High mode which corresponds to the vibration of O atoms in the ZnO lattice. Weak bands appearing at ∼140, ∼204 and ∼330 cm−1 are related to local lattice vibrations, 2E2Low, and E2High–E2Low, respectively. The band appearing at ∼378 cm−1 corresponds to the A1(TO) mode and the mode corresponding to E1(TO) gets mixed with the lower side of the E2High mode. Small humps appearing at ∼530 cm−1 and ∼580 cm−1 correspond to 2B1Low silent mode and quasi-1LO mode, respectively. The broad band seen between 900–1200 cm−1 results from the overlapping of 2TO and 2LO bands, which appear at ∼980 and ∼1150 cm−1, respectively. The low resolution of Raman peaks in the remaining range of the Raman spectrum makes further assignment difficult.Compared to the Raman spectrum of pure ZnO, the Raman bands are better resolved in ZAu1 and ZAu2. This enhanced Raman scattering can be attributed to the presence of Au NPs in close proximity to ZnO nanostructures. Raman spectra of the nanocomposites consist of spectral peaks that are related to quasi(nLO) modes of ZnO at ∼565, ∼1130, ∼1695, ∼2260 and ∼2825 cm−1, which are not resolved/observed in pure ZnO (ZAu0). The peaks at ∼1320 and ∼1450 cm−1 in the ZnO:Au nanocomposites correspond to the three-phonon Raman scattering processes, namely A1(TO) + A1(LO) + E2High and E1(TO) + A1(LO) + E2High, respectively. This type of three phonon scattering, multiple-LO phonon scattering and intensity enhancement in the spectral range of 1100–2000 cm−1 have been previously observed in seed-like ZnO nanostructures aggregated with nano entities.46 Morphology changes with observed multi-LO phonon modes and intensity enhancement in the presence of Au NPs resembles SERS like behavior with enhanced Raman scattering from ZnO. Surface-enhanced Raman scattering (SERS) can be understood in terms of two enhancement mechanisms: electromagnetic and chemical. Local field enhancement in the surroundings of metal NPs at the excitation wavelength is the origin for the former, while the latter originates from electron transfer between semiconductor and metal NPs. Liu et al.47 has studied about SERS of wurtzite-type GaN and ZnO crystalline samples covered with Ag-NPs. They observed intense enhancement in longitudinal optical phonons which was interpreted by a proposed model based on a resonant Raman scattering process assisted by metal-induced gap states (MIGS) at the Ag/GaN and Ag/ZnO interfaces.
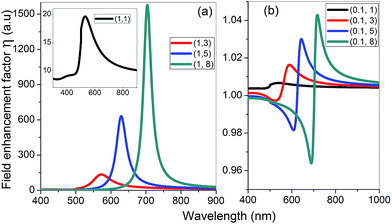
Concerning the field enhancement, when the incident wavelength is close to the SPR of the metal NPs, a large electromagnetic field will surround the surface of metal NPs, exciting many vibrational modes of the semiconducting system in contact to high amplitude. The electromagnetic influence of gold and silver NPs can be described by various approaches. These include analytical methods derived from Mie theory for spheres, quasistatic (Gans) model for spheres and spheroids, and numerical methods like discrete dipole approximation (DDA), finite difference time domain (FDTD) method, and finite element method (FEM).48–55 Tanabe et al.56 has discussed the dependence of field enhancement on parameters such as wavelength, distance from the NP/nanoshell, surrounding medium, and the core and shell diameters, based on classical electromagnetic field theory in the quasistatic limit using empirical wavelength-dependent dielectric constants. When a homogeneous, isotropic metal sphere is placed in a medium under static electric field ( ), it will experience an induced charge on its surface due to the difference in dielectric constants between the metal sphere and the medium.
The field enhancement factor at point r (distance from the center of the sphere) is defined as
 | (3) |
 | (4) |
 is the electric field outside the sphere, 'a' is the radius of the sphere, ε1 = ε′1 + iε′′1 is the wavelength-dependent dielectric constant of the sphere, and εm is the dielectric constant of the surrounding medium (ZnO in the present case). Fig. 6 shows the calculated field enhancement factor η around the gold NP in ZnO medium for two values of a/r (ratio of the radius of the metal sphere to the distance to the observation point). The dielectric constant of ZnO is size dependent. Yang et al.57 has observed a decrease of dielectric constant from 6.4 to 2.7 in ZnO nanowires, while the dielectric constant of bulk ZnO is 8.66. Calculated field enhancement factors for different dielectric constant values of the medium (εm = 1, 3, 5 and 8) are given in Fig. 6.
Apart from this, if oscillating dipoles in the molecules of surrounding medium emit radiation, it may also be enhanced by the metal NPs. This leads to an E4 enhancement of the field at the metal particle surface. The enhancement factor (EF) can be written as58
 | (5) |
From eqn (3) it is clear that η varies as (a/r)6, depending critically on the distance from the metal particle. η depends on the dielectric constant of the surrounding medium, but is independent of the particle size. We simulated the square of electric field magnitude (Fig. ES2†) around the gold NP for (x-polarized) incident light of wavelength 514 nm using a simulation tool developed by Tejerina et al.59 (available at http://nanohub.org). The simulations use the spherical particle model based on Mie theory.
In fact, the separated but adjacent Au particles lead to cumulative contribution to the local field. Thus, the presence of local electric field can induce scattering by Raman inactive, and can enhance scattering intensity of Raman active optical phonons. Based on the above observations and calculations, it is plausible that the observed enhanced Raman scattering, observation of multiphonon and higher order Raman modes from ZnO results mostly from the large field enhancement caused by the randomly distributed Au NPs. Moreover, interaction between the external field and metal NPs with free carries which are in contact with metal oxide NPs will increase the metal oxide–metal interaction cross-section, resulting in chemical enhancement of Raman signal.60 The prepared samples show strong multiphonon scattering even in the presence of enhanced luminescence, which usually hides the features of Raman scattering, strongly suggesting that the observed enhancement and multiphonon scattering result from the local field associated with the metal NPs.
Nonlinear optical properties
Local field enhancement can give rise to substantial optical nonlinearities in metal NP based systems. Fig. 7 shows the nonlinear optical transmission measured for the samples at 532 nm, using 5 ns laser pulses. The data fits well to an effective three-photon absorption (3 PA) process in the case of ZAu0 and ZAu1 samples. This type of optical limiting nonlinearity has been reported previously for semiconductors.61–64 The corresponding transmission equation is given by65
 | (6) |
 | ||
| Fig. 7 Intensity dependent optical transmission of pure ZnO (ZAu0) and ZnO:Au nanocomposites (ZAu1, ZAu2), calculated from the open aperture Z-scan curves of the samples (given in insets) measured using 532 nm, 5 ns laser pulses (incident laser energy of 150 μJ). Tnorm. is the normalized transmittance. Circles are data points while solid lines are numerical fits based on eqn (6) (for ZAu0 and ZAu1) and eqn (8) (for ZAu2). | ||
We found that the data for ZAu2 does not fit well to the above 3 PA type equation. Rather, it fits better to a model in which the nonlinearity includes effective two-photon absorption (2 PA) and saturable absorption (SA). The corresponding nonlinear absorption coefficient is given by66
 | (7) |
 | (8) |
To further elucidate the contribution of nano entities' aggregation which results in flower-like assemblies in ZAu2 sample, high power sonication (using 150 W sonicator for 4 h) is used to break the aggregates. The optical and nonlinear optical properties of the post-treated ZAu2 sample (ZAu2-M) are studied and provided as ESI.† SEM image of the ZAu2-M depicts spherical granules in an agglomerated form (Fig. ES3†). Energy-dispersive X-ray spectroscopy (EDX) analysis confirms the presence of Au in the composite. Optical absorption spectra of ZAu2-M sample (Fig. ES4†) exhibits absorption bands related to ZnO and Au NPs (SPR) in the UV and visible regions, respectively. High power sonication leads to breaking of aggregates and also detaches Au NPs from the surface of the ZnO. This leads to the shape variation in the SPR band of Au NP in the ZAu2-M sample when compared with ZAu2 sample. PL spectra of ZAu2-M sample (water suspension) exhibits strong UV emission and suppressed green emission (Fig. ES5†). The electrons in the defect levels favorable for visible emission (which falls in the SPR range of Au NP's) get transferred to Au NP leading to suppressed green region emission. Z-scan data for ZAu2-M sample fits better to a model in which the nonlinearity includes effective two-photon absorption (2 PA) and saturable absorption (SA). The corresponding best-fit values of β and Is are found to be 10.0 × 10⁻¹¹ m W−1 and 4.5 × 10¹² W m−2, respectively. These values are in the same order of magnitude as those obtained for ZAu2 sample, which signifies that the effect of aggregation of nano entities in ZAu2 sample is nominal on the optical and nonlinear optical properties of the ZAu2 sample.
Conclusion
Au seed mediated ZnO:Au nanostructures with flower-like morphology have been prepared by the self-assembly of ZnO nano entities. The surface plasmon absorption band of Au NPs influences luminescence from ZnO, resulting in enhanced UV emission and decreased green emission in ZnO:Au nanocomposites compared to pure ZnO. Raman scattering from ZnO is enhanced in the nanocomposites, which contain randomly distributed Au NPs. This enhancement is associated to the large local field enhancement experienced in the vicinity of the noble metal NPs. Open aperture Z-scan measurements indicate that the optical limiting behavior seen in pure ZnO (ZAu0) is due to effective three-photon absorption, while the stronger limiting seen in ZAu1 and ZAu2 has contribution from free carrier absorption taking place in Au NPs. ZAu2 sample which contains the largest Au NPs, shows the presence of absorption saturation related to the surface plasmon resonance of Au. Being efficient optical limiters, these nanocomposites can have potential applications in the protection of sensitive detectors and human eyes from harmful laser radiation.References
- U. Banin, Y. Ben-Shahar and K. Vinokurov, Chem. Mater., 2014, 26, 97–110 CrossRef CAS.
- H. Yu, M. Chen, P. M. Rice, S. X. Wang, R. L. White and S. Sun, Nano Lett., 2005, 5, 379–382 CrossRef CAS PubMed.
- J. S. Lee, E. V. Shevchenko and D. V. Talapin, J. Am. Chem. Soc., 2008, 130, 9673–9675 CrossRef CAS PubMed.
- Z. Bao, L. Chen, M. Weldon, E. Chandross, O. Cherniavskaya, Y. Dai and J. B. H. Tok, Chem. Mater., 2002, 14, 24–26 CrossRef CAS.
- A. Dawson and P. V. Kamat, J. Phys. Chem. B, 2001, 105, 960–966 CrossRef CAS.
- X. Li, G. Chen, L. Yang, Z. Jin and J. Liu, Adv. Funct. Mater., 2010, 20, 2815–2824 CrossRef CAS.
- G. Korotcenkov, B. K. Cho, L. Gulinab and V. Tolstoy, Sens. Actuators, B, 2009, 138, 512–517 CrossRef CAS PubMed.
- L. Liu, P. Miao, Y. Xu, Z. Tian, Z. Zou and G. Li, J. Photochem. Photobiol., B, 2010, 98, 207–210 CrossRef CAS PubMed.
- X. Yin, W. Que, D. Fei, F. Shen and Q. Guo, J. Alloys Compd., 2012, 524, 13–21 CrossRef CAS PubMed.
- V. Subramanian, E. E. Wolf and P. V. Kamat, J. Am. Chem. Soc., 2004, 126, 4943–4950 CrossRef CAS PubMed.
- P. Sangpour, F. Hashemi and A. Z. Moshfegh, J. Phys. Chem. C, 2010, 114, 13955–13961 CAS.
- U. Ozgur, Y. I. Alivov, C. Liu, A. Teke, M. A. Reshchikov, S. Dogan, V. Avrutin, S. J. Cho and H. Morkoc, J. Appl. Phys., 2005, 98, 041301 CrossRef PubMed.
- M. H. Huang, S. Mao, H. Feick, H. Yan, Y. Wu, H. Kind, E. Weber, R. Russo and P. Yang, Science, 2001, 292, 1897–1898 CrossRef CAS PubMed.
- Q. Zhang, C. S. Dandeneau, X. Zhou and G. Cao, Adv. Mater., 2009, 21, 4087–4108 CrossRef CAS.
- T. Y. Tseng, Solid State Phenom., 2012, 185, 1–4 CrossRef CAS.
- Q. Wan, T. H. Wang and J. C. Zhao, Appl. Phys. Lett., 2005, 87, 083105 CrossRef PubMed.
- A. Kolmakov and M. Moskovits, Annu. Rev. Mater. Res., 2004, 34, 151 CrossRef CAS.
- J. W. Rasmussen, E. Martinez, P. Louka and D. G. Wingett, Expert Opin. Drug Delivery, 2010, 7, 1063–1077 CrossRef CAS PubMed.
- C. Klingshirn, Phys. Status Solidi B, 2007, 244, 3027 CrossRef CAS.
- U. Ozgur, D. Hofstetter and H. Morkoc, Proc. IEEE, 2010, 98, 1255–1268 CrossRef CAS.
- M. C. Daniel and D. Astruc, Chem. Rev., 2004, 104, 293–346 CrossRef CAS PubMed.
- T. Chen, G. Z. Xing, Z. Zhang, H. Y. Chen and T. Wu, Nanotechnology, 2008, 19, 435711 CrossRef CAS PubMed.
- Q. Wang, B. Y. Geng and S. Z. Wang, Environ. Sci. Technol., 2009, 43, 8968–8973 CrossRef CAS PubMed.
- L. L. Sun, D. X. Zhao, Z. M. Song, C. X. Shan, Z. Zhang, B. H. Li and D. Z. Shen, J. Colloid Interface Sci., 2011, 363, 175–181 CrossRef CAS PubMed.
- M. K. Lee and H. F. Tu, J. Electrochem. Soc., 2008, 155, D758–D762 CrossRef CAS PubMed.
- Y. Wei, Y. Li, X. Liu, Y. Xian, G. Shi and L. Jin, Biosens. Bioelectron., 2010, 26, 275–278 CrossRef CAS PubMed.
- V. Dhas, S. Muduli, W. Lee, S. H. Han and S. Ogale, Appl. Phys. Lett., 2008, 93, 243108 CrossRef PubMed.
- T. Bora, H. H. Kyaw, S. Sarkar, S. K. Pal and J. Dutta, Beilstein J. Nanotechnol., 2011, 2, 681–690 CrossRef CAS PubMed.
- A. M. Schwartzberg, C. D. Grant, A. Wolcott, C. Talley, T. Huser, R. Bogomolni and J. Z. Zhang, J. Phys. Chem. B, 2004, 108, 19191–19197 CrossRef CAS.
- L. Chen, L. Luo, Z. Chen, M. Zhang, J. A. Zapien, C. S. Lee and S. T. Lee, J. Phys. Chem. C, 2010, 114, 93–100 CAS.
- G. Shan, S. Wang, X. Fei, Y. Liu and G. Yang, J. Phys. Chem. B, 2009, 113, 1468–1472 CrossRef CAS PubMed.
- W. Song, Y. Wang, H. Hu and B. Zhao, J. Raman Spectrosc., 2007, 38, 1320–1325 CrossRef CAS.
- C. Wen, F. Liao, S. Liu, Y. Zhao, Z. Kang, X. Zhang and M. Shao, Chem. Commun., 2013, 49, 3049–3051 RSC.
- J. He, Y. Qu, H. Li, J. Mi and W. Ji, Opt. Express, 2005, 13, 9235 CrossRef CAS.
- L. Irimpan, V. P. N. Nampoori and P. Radhakrishnan, Chem. Phys. Lett., 2008, 455, 265–269 CrossRef CAS PubMed.
- L. Irimpan, V. P. N. Nampoori, P. Radhakrishnan, B. Krishnan and A. Deepthy, J. Appl. Phys., 2008, 103, 033105 CrossRef PubMed.
- C. S. S. Sandeep, R. Philip, R. Satheeshkumar and V. Kumar, Appl. Phys. Lett., 2006, 89, 063102 CrossRef PubMed.
- M. G. Vivas, T. Shih, T. Voss, E. Mazur and C. R. Mendonca, Opt. Express, 2010, 18, 9628 CrossRef CAS PubMed.
- G. Shan, L. Xu, G. Wang and Y. Liu, J. Phys. Chem. C, 2007, 111, 3290–3293 CAS.
- X. Wang, C. J. Summers and Z. L. Wang, Appl. Phys. Lett., 2005, 86, 013111 CrossRef PubMed.
- W. Q. Zhang, Y. Lu, T. K. Zhang, W. Xu, M. Zhang and S. H. Yu, J. Phys. Chem. C, 2008, 112, 19872–19877 CAS.
- X. Li, Y. Zhang and X. Ren, Opt. Express, 2009, 17, 8735–8740 CrossRef CAS.
- M. Lee, T. G. Kim, W. Kim and Y. Sung, J. Phys. Chem. C, 2008, 112, 10079–10082 CAS.
- M. D. L. R. Peralta, U. Pal and R. S. Zeferino, ACS Appl. Mater. Interfaces, 2012, 4, 4807–4816 Search PubMed.
- R. Cusco, E. A. Llado, J. Ibanez and L. Artús, Phys. Rev. B: Condens. Matter Mater. Phys., 2007, 75, 165202 CrossRef.
- S. S. Lo, D. Huang, C. H. Tu and D. J. Jan, J. Raman Spectrosc., 2009, 40, 1694–1697 CrossRef CAS.
- C. Y. Liu, M. M. Dvoynenko, M. Y. Lai, T. H. Chan, Y. R. Lee, J. K. Wang and Y. L. Wang, Appl. Phys. Lett., 2010, 96, 033109 CrossRef PubMed.
- J. Zhao, A. O. Pinchuk, J. M. Mcmahon, S. Li, L. K. Ausman, A. L. Atkinson and G. C. Schatz, Acc. Chem. Res., 2008, 41, 1710–1720 CrossRef CAS PubMed.
- A. E. DePrince and R. J. Hinde, Nanoscale Res. Lett., 2010, 5, 592–596 CrossRef CAS PubMed.
- Z. Jian, Z. Junwu and L. Jianjun, Plasmonics, 2010, 5, 311–318 CrossRef.
- H. X. Xu, Phys. Lett. A, 2003, 312, 411–419 CrossRef CAS.
- Y. S. Hu, J. Jeon, T. J. Seok, S. Lee, J. H. Hafner, R. A. Drezek and H. Choo, ACS Nano, 2010, 4, 5721–5730 CrossRef CAS PubMed.
- C. E. Talley, J. B. Jackson, C. Oubre, N. K. Grady, C. W. Hollars, S. M. Lane, T. R. Huser, P. Nordlander and N. J. Halas, Nano Lett., 2005, 5, 1569–1574 CrossRef CAS PubMed.
- T. Sakano, Y. Tanaka, R. Nishimura, N. N. Nedyalkov, P. A. Atanasov, T. Saiki and M. Obara, J. Phys. D: Appl. Phys., 2008, 41, 235304 CrossRef.
- H. Xu, J. Aizpurua, M. Kall and P. Apell, Phys. Rev. E: Stat. Phys., Plasmas, Fluids, Relat. Interdiscip. Top., 2000, 62, 4318–4324 CrossRef CAS.
- K. Tanabe, J. Phys. Chem. C, 2008, 112, 15721–15728 CAS.
- Y. Yang, W. Guo, X. Wang, Z. Wang, J. Qi and Y. Zhang, Nano Lett., 2012, 12, 1919–1922 CrossRef CAS PubMed.
- P. L. Stiles, J. A. Dieringer, N. C. Shah and R. P. V. Duyne, Annu. Rev. Anal. Chem., 2008, 1, 601–626 CrossRef CAS PubMed.
- B. Tejerina, L. Ausman and T. Takeshita, Nanosphere Optics Lab Field Simulator, https://nanohub.org/resources/nsoptics3D, DOI:10.4231/d3ff3m064, 2014.
- H. Grebel, Nonlinear Optics: Materials, Fundamentals and Applications, Technical Digest (CD) Optical Society of America, 2004 Search PubMed.
- J. He, W. Ji, J. Mi, Y. Zheng and J. Y. Ying, Appl. Phys. Lett., 2006, 88, 181114 CrossRef PubMed.
- G. Xing, W. Ji, Y. Zheng and J. Y. Ying, Appl. Phys. Lett., 2008, 93, 241114 CrossRef PubMed.
- B. Karthikeyan, C. S. S. Sandeep, R. Philip and M. L. Baesso, J. Appl. Phys., 2009, 106, 114304 CrossRef PubMed.
- B. Karthikeyan, C. S. S. Sandeep, T. Pandiyarajan, P. Venkatesan and R. Philip, Appl. Phys. Lett., 2009, 95, 023118 CrossRef PubMed.
- R. L. Sutherland, Handbook of Nonlinear Optics, Dekker, New York, 1996 Search PubMed.
- M. R. Parida, C. Vijayan, C. S. Rout, C. S. S. Sandeep and R. Philip, Appl. Phys. Lett., 2012, 100, 121119 CrossRef PubMed.
- R. Philip, P. Chantharasupawong, H. Qian, R. Jin and J. Thomas, J. Nanosci. Lett., 2012, 12, 4661–4667 CrossRef CAS PubMed.
Footnote |
| † Electronic supplementary information (ESI) available. See DOI: 10.1039/c4ra11204k |
| This journal is © The Royal Society of Chemistry 2015 |

