Synthesis of porous MgAl2O4 spinel and its superior performance for organic dye adsorption

Junying Tian, Peng Tian, Guiling Ning*, Hongchang Pang, Qiang Song, Hang Cheng and Haixia Fang
State Key Laboratory of Fine Chemicals, School of Chemical Engineering, Dalian University of Technology, 2 Linggong Road, Dalian 116012, P. R. China. E-mail: ninggl@dlut.edu.cn; Fax: +86-0411-84986065; Tel: +86-0411-84986065

Received 23rd September 2014 , Accepted 10th December 2014

First published on 10th December 2014


Abstract

A porous MgAl2O4 spinel (MAS) has been synthesized via a facile hard template process with further calcination, in which a hierarchical Mg5(OH)2(CO3)4·4H2O template with a high surface area was used as a hard template and magnesium source, and AlCl3·6H2O was used as an alumina source. The as-prepared samples were characterized by X-ray diffraction (XRD), Fourier transform infrared spectroscopy (FTIR), scanning electron microscopy (SEM), energy dispersive X-ray (EDX), thermogravimetry analysis (TGA) and N2 adsorption–desorption. The MAS samples showed superior adsorption performance, including rapid adsorption rate, excellent adsorption capacity and good reusability for removal of Congo red (CR) from aqueous solution. The superior performance could be ascribed to the strong interaction between the MAS samples and CR, as well as the hierarchical porous structure and the high specific surface area of the samples. The maximum adsorption capacity of the MAS samples for CR was nearly 845 mg g−1, which is higher than most of the previously reported adsorbents. The CR removal process was found to follow the pseudo-second-order rate equation and the Sips adsorption model.

1. Introduction

Nowadays, dyes and organic waste have become among the main pollution sources of ground water and surface water.1 Many of them are human carcinogens, whereas they have been widely used in industry. Therefore, the remaining organic dyes must be removed before they are mixed up with any water resource. Adsorption has been recognized as one popular treatment method to remove organic dyes from colored effluents because of the simplicity, high efficiency and low cost of the adsorbent.2–7 Nevertheless, the application of traditional adsorbent is affected by several restrictions, such as limited adsorption capacity, low adsorption rate and poor reusability. Therefore, preparation of the adsorbent with high adsorption capacity and good reusability has become the focus of recent research.

Magnesium aluminate (MgAl2O4) spinel (MAS) has been extensively used as a dye adsorbent, catalyst or catalyst support, an active element in humidity sensors and an excellent transparent ceramic material for high-temperature arc-enclosing envelops, because of its unique properties, such as high melting point (2135 °C), low dielectric constant, chemical inertness, excellent optical properties, good mechanical strength, low thermal expansion and good catalytic properties.8–17 For many of its applications, especially as a dye adsorbent, catalyst support and catalysts by itself, high specific surface area is greatly desired. Several chemical synthetic methods such as chemical coprecipitation14,15,18–20 and sol–gel processes,8,21–24 have been used to synthesize MAS materials with high surface area. In despite of these successes, the experimental parameters in chemical coprecipitation or sol–gel processes are often entangled, making it difficult to control the shape, morphology, and structure of the micro/nanostructured materials, and hard to synthesize the micro/nanostructured materials in large scale.

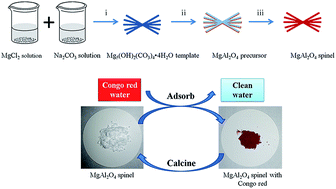
Recently, several metallic oxides have been prepared successfully by magnesium carbonate hard template route in our studies.3,25–27 The route is facile, inexpensive, and easily scaled-up. In this present work, MAS hierarchical structures with high surface area were prepared by a hard template process with further calcination, in which Mg5(OH)2(CO3)4·4H2O (MCH) template with hierarchical structure was used as hard template as well as magnesium source, and AlCl3·6H2O was used as alumina source. Congo red, an azo anionic dye and a known human carcinogen, is widely used in dyeing, paper, rubber, and plastics industries, and commonly used as a model pollutant to investigate the dye removal ability of adsorbents.4,5,28–32 Furthermore, as a representative demonstration for dye adsorption, MAS was used to adsorb CR. The as-obtained MAS powder possessed a high adsorption capacity (840 mg g−1) and good reusability. The properties of as-prepared MAS, including the simple preparation, high adsorption rate, ultrahigh adsorption capacity and good reusability, make it be potential for application in environmental remediation.

2. Experimental

2.1 Preparation of MAS powder

All reagents used during the process were AR, unless otherwise noted. Schematic diagram of the synthesis of the MAS samples is exhibited in Scheme 1. In the first step, the aqueous MgCl2·6H2O solution (50 ml, 1 M) and aqueous Na2CO3 solution (100 ml, 0.5 M) were heated to 80 °C. Then, the hot MgCl2·6H2O solution was added into vigorously stirred hot Na2CO3 solution (in a 250 ml beaker). After 1 min, the stirring was stopped and the solution was maintained at 80 °C for 1 h to form the Mg5(OH)2(CO3)4·4H2O (MCH) template (XRD pattern of the MCH template is shown in Fig. S1, ESI). After that, the template was collected, filtered off, washed with water and ethanol three times respectively, and dried in a blast drying oven at 60 °C for 8 h.
image file: c4ra11032c-s1.tif
Scheme 1 Schematic diagram of the formation of MAS samples.

In the second step, 0.466 g MCH template was dispersed in 100 ml NaOH solution (0.3 M). Then 120 ml AlCl3·6H2O solution (0.1 M) was added to the liquid dropwise under vigorous stirring at room temperature. The formed material was collected, filtered off, washed with water and ethanol three times respectively, and dried in a blast drying oven at 60 °C for 8 h, resulting a precursor (MA precursor). In the third step, as prepared MA precursor was calcined in air at temperature of 700–1100 °C, for 4 h, to obtain the MAS sample.

In order to compare, a bulk MAS sample (B-MAS) was prepared by a coprecipitation process. Firstly, 10 ml aqueous MgCl2·6H2O solution (1 M) and 20 ml aqueous AlCl3·6H2O solution (1 M) were mix in a 400 ml baker, then, 160 ml NaOH solution (0.5 M) was added into the vigorously stirred mixed solution. After 1 min, the stirring was stopped. And the precipitation was collected, filtered off, washed with water and ethanol three times respectively, and dried in a blast drying oven at 60 °C for 8 h. Furthermore, precipitation was calcined in air at temperature of 700 °C for 4 h, to obtain the B-MAS sample.

2.2 Characterization

The crystalline phases of the as-prepared samples were identified by X-ray powder diffraction (XRD, Rigaku-DMax 2400) in reflection mode (Cu-Kα radiation) at scanning rate of 0.02 S−1 in the 2θ from 5 to 80°. Scanning electron microscope (SEM, JEOL-6360LV, operated at 20 kV) was used to observe the morphology, and Energy Dispersive X-ray (EDX) analysis was conducted during SEM. A Mettler TG/SDTA851e thermogravimetric analyzer was employed to accomplish the thermogravimetry analysis (TGA) of samples at a heating rate of 10 °C min−1 in air. An ASAP 2020 physisorption apparatus was used to measure adsorption–desorption isotherms of the samples at 77 K (temperature of liquid nitrogen). The specific surface area and the total specific volume of the pores were calculated by the BET method and BJH method, respectively. A JASCO FT/IR-4100 spectrometric analyzer was employed to measure the Fourier transform infrared (FTIR) spectra of the samples.

2.3 Evaluation of adsorptive property and reusability

For adsorption tests, 0.1 g of as-obtained MAS powder, which was prepared by calcinating MA precursor at different temperatures, was added to 200 ml of the aqueous solution of Congo red (CR) at different initial concentrations and pH. Then the mixture was stirred continuously at room temperature. At different adsorption times, 8.0 ml of the mixture was collected and separated. The absorbance of the CR solutions were measured on UV-visible spectrophotometer (Hitachi, U-4100), and the concentrations of the solutions were evaluated by the Beer's law. A series of solutions of defined concentration were used to explore the relationship between the CR concentration and absorbance at λ = 490 nm. The absorbance vs. concentration graphs for different concentration ranges were plotted respectively (Fig. S2, ESI), and unknown concentration was calculated from the corresponding equations. Detail information of the CR was listed in the Table S1 (ESI).

After adsorption, the adsorbent was collected, filtered off, washed with ethanol two times, and dried in a blast drying oven at 60 °C for 8 h. Then, the adsorbent was calcined in air at temperature of 700 °C for 1 h, to obtain the regeneration powder (marked 2-MAS). This process was conducted again on the 2-MAS powder to obtain the second regeneration powder (marked 3-MAS), again. The crystalline phases and the surface area of as-obtained MAS powder, 2-MAS powder and 3-MAS powder were compared. Moreover, adsorptive property of them was evaluated.

3. Result and discussion

3.1 Characterization of MAS

The XRD patterns for MAS with different calcining temperature are shown in Fig. 1. All the diffraction peaks can be indexed to cubic spinel-structured MgAl2O4 (JCPDS Card no. 77-1203). The crystallization of the spinel phase can be clearly observed at 700 °C. And diffraction peaks become stronger with the increasing calcining temperature. This indicates that the spinel phase has formed in the calcined sample at 700 °C–1100 °C. The EDX pattern of MAS sample calcined at 1100 °C shown in Fig. S3 (ESI) reveals that the chemical compositions of as-prepared sample are consistent with the MgAl2O4 spinel.
image file: c4ra11032c-f1.tif
Fig. 1 Powder XRD patterns of MAS with different calcining temperatures (700–1100 °C) and reference MAS (JCPDS Card no. 77-1203).

The nitrogen adsorption–desorption isotherms for the samples of MAS prepared at 700 °C to 1100 °C are shown in Fig. 2 (700 °C and 1100 °C) and Fig. S4 (800 °C, 900 °C and 1000 °C, ESI). The isotherms can be classified as type II and H3 type hysteresis for all samples (according to the IUPAC classification). The isotherm curves showed that micropores (<2 nm), mesopores (2–50 nm), and macropores (>50 nm) coexisted in the as-prepared MAS, suggesting that the structures of as-obtained MAS samples were hierarchical and porous. The results for the specific surface area and total specific volume of the pores (at P/Po = 0.95) are shown in Table 1. The specific surface area and total specific volume of the pores of the samples decreased with the calcination temperature, because of the shrink of the samples at the high calcination temperature. Several previous works have prepared MAS samples with higher surface area,8,33–35 even then, the specific surface area of as-prepared samples are high, and our synthesis route is not inferior to many of them base on the hierarchical porous structure of prepared samples and affordable of the route (cheap raw material and mild synthesis conditions).


image file: c4ra11032c-f2.tif
Fig. 2 N2 adsorption/desorption isotherms of samples calcined at 700 and 1100 °C.
Table 1 The results for the surface area and total specific volume of as-prepared MAS samples
Calcination temperature °C Surface area m2 g−1 Total specific volume cm3 g−1
700 127.9 0.84
800 111.9 0.713
900 99.1 0.717
1000 72.3 0.619
1100 30.5 0.254


In order to obtain information of forming process of MAS, SEM and IR spectra were used to detect the features of MCH template, MA precursor and MAS sample. Meanwhile, TG analysis was used to probe weight loss of MA precursor in the calcinations process. The SEM images of the MCH template, MA precursor and MAS sample calcined at 1100 °C are shown in Fig. 3. As can be seen, the hierarchical structure of the MCH template has been retained in the MA precursor and MAS sample. The particles were hierarchical, porous and made up of a number of microsheets, which was consistent with the high specific surface area of the samples.


image file: c4ra11032c-f3.tif
Fig. 3 SEM images of the MCH template (a and b), MA precursor (c and d) and MAS sample calcined at 1100 °C (e and f).

IR spectra of the MCH template, MA precursor and MAS calcined at 700 °C are shown in Fig. 4a. The broad OH band around 3400 cm−1, and the H2O vibration around band 1630 cm−1 existed in all cases, because the MCH template and MA precursor had hydroxyl and the high surface area of these samples results in adsorption of water from the atmosphere. It is noteworthy that, there were bands at 1115 cm−1, 1428 cm−1 and 1482 cm−1 associating with stretching of the CO32− groups, and weak bands at 794 cm−1, 855 cm−1 and 885 cm−1 associating with bending of the CO32− groups in the MCH template,36,37 while there was not any band at the same wavenumbers in the other samples. It indicated that the MCH template may had transformed to Mg(OH)2 in the strong alkaline solution of the preparation process. For the MA precursor, the transmittance bands noted at 532 cm−1, 778 cm−1 and 993 cm−1 correspond to the bending and stretching modes of the Al–O and Mg–O.38 Moreover, the characteristic absorption peaks at 689 cm−1 and at 528 cm−1 of MAS were attributed to the AlO6 groups, which built up the MAS and indicated the formation of MAS powders.9


image file: c4ra11032c-f4.tif
Fig. 4 (a) IR spectra for MCH template, MA precursor and MAS calcined at 700 °C. (b) TG curves for as-prepared MA precursor.

TG analysis was used to investigate the thermal behavior of as-prepared MA precursor and the results are shown in Fig. 4b. The weight lose below 200 °C was mainly attribute to the removal of the water of the precursor, including bound water and adsorbed water. The weight losses near at 240 and 360 °C were about 10% and 6%, which fitted with the dehydroxylation of Al(OH)3 and Mg(OH)2, respectively. It indicated that the great weight loss ratios near at 240 °C and 360 °C were mainly due to dehydroxylation of Al(OH)3 and Mg(OH)2, respectively.

XRD pattern, SEM images and N2 adsorption/desorption isotherms of the bulk MAS (B-MAS) were shown in the Fig. S5 (ESI). As can be proved, the B-MAS had cubic spinel-structured phase, bulk morphology and porous structure. The specific surface area of the B-MAS was 73.2 m2 g−1, which was less than the specific surface area of the MAS samples calcined at 700 °C.

3.2 Adsorption study

It is likely that the as-prepared MAS powder would be powerful to remove organic pollutants from waste water, because of its hierarchical porous structure and high specific surface area. Here, Congo red (CR), a dye frequently used in the textile industry, was selected as a model to study the capture ability of the MAS powder to absorb the organic pollutant. When the initial concentration of CR in water was 300 mg l−1, the UV-Vis absorption curves and photos of CR aqueous solution within different time are shown in Fig. 5. It can be seen that the as-synthesized MAS powder (0.5 g l−1) could remove about 89% and 99% of the CR from the aqueous solution at room temperature in 5 min and 120 min, respectively. The patterns of the MAS samples before and after adsorption are shown in the Fig. S6 (ESI). As can be seen, main diffraction peaks of the MAS samples can be indexed to cubic spinel-structured MgAl2O4 (JCPDS Card no. 77-1203). And the diffraction peaks of the MAS powder became much weaker after adsorption. Moreover, some diffraction peaks of compounds of magnesium hydroxides and aluminium hydroxides appeared after adsorption. This indicated that the MAS samples were hydrolyzed into metal hydroxides in the water. Because the point of zero charge (PZC) of the MAS sample was around 11.8,39 in neutral solution the MAS surface was positively charged, while the Congo red was negatively charged. Thus, the CR was easily adsorbed on the surface of the MAS due to the electrostatic attraction. In addition, the pH value of the solution was nearly invariant, which indicated that the metal hydroxides produced in the adsorption were stable.
image file: c4ra11032c-f5.tif
Fig. 5 (a) Absorption spectra and (b) photographs of 200 ml CR aqueous solution (300 mg l−1) in the presence of 100 mg of MAS powder in different time.

Influence of some conditions, including adsorption time, initial concentration, initial pH and calcined temperature of the MAS, was investigated to explore the characteristics of the adsorption process. Adsorption property of the MAS powder for CR were characterised in ambient temperature and a dosage of 0.5 g MAS powder per litre solution. Moreover, the conditions about MAS powder (calcination at 700 °C), the initial concentration (300 mg l−1) and pH value (7) of the CR solution were fixed for further ingestigation of other variable parameters. The time profile of CR adsorption at different initial concentrations with 0.5 g l−1 of the MAS powder is shown in Fig. 6a. Obviously, the adsorption rates of the MAS powder were extremely rapid during the first 5 min, and the adsorption process nearly reached equilibrium within 30 min under all concentrations. This indicated that the MAS powder was high efficiency for the removal of CR in aqueous solution. Fig. 6b shows the change tendency of adsorption capacity varying with the initial concentration. Strikingly, the adsorption capacities increased with the initial CR concentrations. It is because that higher concentration can provide greater driving force to prompt the CR diffusion to the MAS samples. As can be seen, when the initial concentration was greater than 450 mg l−1, the increase of adsorption capacity became slow. This indicated that the adsorption was close to saturation when the initial concentration is 450 mg l−1, and the max adsorption capacity of the MAS samples was nearly 840 mg g−1. Fig. 6c shows the influence of the initial pH on the CR adsorption of the MAS powder. At pH ranging from 5 to 10, the adsorption capacity was nearly invariant. With further increase of pH to 11.0, the adsorption capacity of the MAS powder decreased slightly. As well known, the MAS samples had a positive potential in a wide range of pH from 2.0 to 10, with a point of zero charge (PZC) around pH 11.8.34 Thus, the positively charged CR was easily adsorbed on the surface of the MAS due to the electrostatic attraction. However, the absorption capacities of the MAS samples were still very high when the initial solution pH was beyond 12. It indicates that other interactions between the MAS samples and CR may exist during the adsorption. The interaction may be the coordination effect of magnesium ions and aluminium ions with amine groups and sulfo groups of Congo red. According to some previous reports, the coordination effect existed in the CR adsorption process when magnesia and alumina were used as absorbent.5,40,41 The absorption capacity of the MAS powder calcined at different temperature is shown in the Fig. 6d. As can be seen, absorption capacities of the MAS powders decreased with the calcined temperature. The weaker electrostatic attraction resulted by more stable phase, and lower specific surface area of the absorbents with the increasing temperature leaded to the decrease of absorption capacity. It is worth noting that the decrease of the adsorption capacity from 700 °C to 800 °C was more obvious than the decrease at other temperatures. The crystallinity of the MAS calcined at 800 °C was much higher than that calcined at 700 °C, which resulted in much weaker hydrolysis and electrostatic attraction. Thus, more obvious decrease of the adsorption capacity appeared from 700 °C to 800 °C.


image file: c4ra11032c-f6.tif
Fig. 6 Adsorption capacity of the MAS powder for CR removal with the changes of (a) the contact time, (b) the initial concentration, (c) initial pH and (d) calcined temperature.

To explore the mechanism of the adsorption process, the pseudo-first-order, pseudo-second-order kinetic and intraparticle diffusion models were used to investigate the kinetics of CR adsorption on the MAS powder, respectively:

 
image file: c4ra11032c-t1.tif(1)
 
image file: c4ra11032c-t2.tif(2)
 
qt = k3t1/2 + C (3)
where qe and qt (mg g−1) are the amounts of CR adsorbed at equilibrium and at any time t (min), respectively. k1 (min−1) and k2 (g mg−1 min−1) are the pseudo-first-order and pseudo-second-order rate constants, respectively. k3 (mg g−1 min−1/2) is the intraparticle diffusion rate constant and C (mg g−1) is the constant. The kinetic parameters and the correlation coefficients (R2) are summarized in Table S2 (ESI). As can be obtained from Fig. 7 and Table S2, all the experimental data can match well to the pseudo-second-order model with high correlation coefficients (R2 > 0.9998). Moreover, the values of qe,cal (qe obtained by calculation) were very close to the values of qe,exp (qe obtained by experiment). In contrast, the correlation coefficients for the pseudo-first-order model and intraparticle diffusion model were relatively lower, and the qe,cal of the pseudo-first-order model was more different with the qe,exp. In conclusion, it is suitable to use the pseudo-second-order model to describe the adsorption process of CR on the as-prepared MAS powder. This indicated that the “surface reaction” was a predominant factor and controlling stage for the CR removal.42


image file: c4ra11032c-f7.tif
Fig. 7 The pseudo-second-order kinetics plots of CR adsorption on the as-prepared MAS powder.

Fig. 8 shows the adsorption isotherms of CR on the as-prepared MAS powder at different initial concentrations. This adsorption process was analyzed using the Langmuir, Freundlich and Sips isotherm models, respectively.

 
image file: c4ra11032c-t3.tif(4)
 
qe = KfCe1/n (5)
 
image file: c4ra11032c-t4.tif(6)
where qm (mg g−1) is monolayer adsorption capacity, b is the Langmuir equilibrium constant (l mg−1), Kf is roughly an indicator of the adsorption capacity, n is the adsorption intensity, Ks is the Sips equilibrium constant (l mg−1), and γ is the Sips parameter. The related parameters and the correlation coefficients (R2) are summarized in Table S3 (ESI). The adsorption data were found to fit better to the Sips model, with R2 value of 0.9738, than to the Langmuir and Freundlich models, with R2 value of 0.6995 and 0.4958 respectively, suggesting the monolayer and nonuniform adsorption of CR on as-prepared MAS powder. The nonuniform distribution of the Mg2+ and Al3+ on the surface of the MAS spinel caused the nonuniformity of the absorbent, which further leaded to nonuniform chemical adsorption.


image file: c4ra11032c-f8.tif
Fig. 8 Adsorption isotherm curves for the adsorption of CR on the as-prepared MAS powder.

The change in free energy ΔG0 (kJ mol−1) for the adsorption process in the natural condition was estimated by using the following equation:

 
ΔG0 = −RT[thin space (1/6-em)]ln[thin space (1/6-em)]Ks (7)
where T is the natural adsorption temperature (298.15 K), R is the ideal gas constant (8.314 J mol−1 K−1). The value of the ΔG0 estimated was 15.81 kJ mol−1. The negative ΔG0 indicated that CR adsorption on the MAS samples was spontaneous and feasible in the natural temperature.

Nowadays, many porous adsorbents have been proposed as candidates for the removal of CR, however, their adsorption capacities are normally below 500 mg g−1. The adsorption capacity of as-prepared MAS powder and some other adsorbent previously used for removal of CR in aqueous solution is compared in Table 2. Obviously, the adsorption capacity of as-prepared MAS powder was higher than bulk MAS powder because the MAS powder had higher specific surface area. Moreover, adsorption capacity of MAS powder was higher than many other adsorbents. Strong interaction between the MAS powder and CR was the main reason for this fact.

Table 2 Comparisons of CR adsorption capacities of different adsorbents
Adsorbent Specific surface area m2 g−1 Removal capacity (mg g−1) References
MAS sample 127.9 845.5 This work
Bulk MAS sample 73.2 322 This work
Mesoporous MgO architectures 94 689.7 4
MgO nanoplates 198 131.3 28
Spindle-like γ-Al2O3 149 176.7 29
Nanorod-like γ-Al2O3 158 83.8 30
NiO nanospheres 222 440 31
Urchin-like α-FeOOH 96.9 275 32


Based on the above analysis, the adsorption of the CR solution mainly depends on the electrostatic attraction, as well as the coordination effect of the aluminium ions and magnesium ions with amine groups and the sulfo groups of the Congo red. Moreover, the powerful ability of as-prepared MAS samples to absorb CR was mainly owed to their strong interactions with the CR and their advantageous structure, including high specific surface area, large pore volume and uniquely hierarchical morphology.

Reusability is one of the most significant properties of the absorbent, and reusability of as-prepared MAS powder was evaluated. The XRD patterns for MAS calcined at 700 °C, 2-MAS and 3-MAS samples are shown in Fig. S7 (ESI). As can be seen, the crystal phase and crystallinity of three samples were similar. It reveals that the crystal phase and crystallinity of the samples can be maintained in the cyclic process. Fig. S8 (ESI) shows the N2 adsorption/desorption isotherms of 2-MAS and 3-MAS samples. The isotherms can be classified as type II and H3 type hysteresis for both samples (according to the IUPAC classification), which were the same as the MAS sample calcined at 700 °C. The values of surface area for the 2-MAS and 3-MAS samples were 166.2 m2 g−1 and 149.0 m2 g−1 respectively, which were higher than the MAS sample calcined at 700 °C (127.9 m2 g−1). It is likely that the process of CR burned produced some pores in the samples resulting in increasing surface area of the samples. Meanwhile, the framework of the sample may be destroyed slightly in the calcinations, which can be used to explain the phenomenon that surface area of the 3-MAS sample was lower than the 2-MAS sample.

The time profile of CR adsorption at 400 mg l−1 initial concentrations with 0.5 g l−1 of the MAS, 2-MAS and 3-MAS powder is shown in Fig. 9. The adsorption rates of three samples were all rapid and the adsorption capacities of them declined successively, because the active sites of the absorbents decreased in the calcinations process. However, decrement of the adsorption capacity was little, and the adsorption capacity of the 3-MAS was nearly 720 mg g−1 in the CR solution (400 mg l−1), which was still high. In conclusion, the combined superiority of the simple preparation, high adsorption rate, ultrahigh adsorption capacity and good reusability makes as-prepared MAS powder potential for application in environmental remediation.


image file: c4ra11032c-f9.tif
Fig. 9 Adsorption capacity of the MAS, 2-MAS and 3-MAS samples for CR removal with the changes of the contact time.

4. Conclusion

In summary, we have demonstrated a simple route to prepare porous MgAl2O4 powder with Mg5(OH)2(CO3)4·4H2O as a hard template. The as-prepared MAS samples had hierarchical porous structure and large surface area. The MAS powder was high efficiency for the removal of CR in aqueous solution and the adsorption properties were systematically investigated. The kinetics and isotherm of adsorption process were proved to fit the pseudo-second-order kinetics and Sips isotherm models, respectively. The as-prepared MAS powder is potential for application in environmental remediation for its superior performance of removal organic dye.

Acknowledgements

This work was supported by National Natural Science Foundation of China (21276046, 21406032 and 21406045), the Fundamental Research Funds for the Central Universities of China (DUT13RC(3)043 and DUT14RC(3)040), the Ministry of Education Science and technology research projects and High-Tech R&D projects in Magnesium Industry of Liaoning Province in China.

Notes and references

  1. G. Crini, Bioresour. Technol., 2006, 97, 1061–1085 CrossRef CAS PubMed.
  2. A. Mahapatra, B. G. Mishra and G. Hota, Ceram. Int., 2013, 39, 5443–5451 CrossRef CAS PubMed.
  3. P. Tian, J. W. Ye, G. L. Ning, W. T. Gong, N. Xu, Q. S. Zhang and Y. Lin, RSC Adv., 2012, 2, 10217–10221 RSC.
  4. L. H. Ai, H. T. Yue and J. Jiang, Nanoscale, 2012, 4, 5401–5408 RSC.
  5. P. Tian, X. Y. Han, G. L. Ning, H. X. Fang, J. W. Ye, W. T. Gong and Y. Lin, ACS Appl. Mater. Interfaces, 2013, 5, 12411–12418 CAS.
  6. D. Pant, A. Singh, G. Van Bogaert, S. Irving Olsen, P. Singh Nigam, L. Diels and K. Vanbroekhoven, RSC Adv., 2012, 2, 1248–1263 RSC.
  7. H. Pang, W. Wang, Z. Yan, H. Zhang, X. Li, J. Chen, J. Zhang and B. Zhang, RSC Adv., 2012, 2, 9614–9618 RSC.
  8. G. D. Nuernberg, E. L. Foletto, L. F. Probst, C. E. Campos, N. L. Carreño and M. A. Moreira, Chem. Eng. J., 2012, 193, 211–214 CrossRef PubMed.
  9. I. Ganesh, Int. Mater. Rev., 2013, 58, 63–112 CrossRef CAS PubMed.
  10. W. Z. Li, L. Kovarik, D. H. Mei, J. Liu, Y. Wang and C. Peden, Nat. Commun., 2013, 4, 2481(8) Search PubMed.
  11. Y. Liu, S. Wang, D. N. Gao, T. J. Sun, C. X. Zhang and S. D. Wang, Fuel Process. Technol., 2013, 111, 55–61 CrossRef CAS PubMed.
  12. R. Feng, H. A. Al-Megren, M. C. Al-Kinany, M. J. Rood and Z. F. Yan, J. Porous Mater., 2013, 20, 571–577 CrossRef CAS.
  13. G. B. Nuernberg, E. L. Foletto, L. Probst, N. Carreno and M. A. Moreira, J. Mol. Catal. A: Chem., 2013, 370, 22–27 CrossRef CAS PubMed.
  14. E. L. Foletto, S. L. Jahn and R. Moreira, Sep. Sci. Technol., 2009, 44, 2132–2145 CrossRef CAS.
  15. B. Ismail, S. T. Hussain and S. Akram, Chem. Eng. J., 2013, 219, 395–402 CrossRef CAS PubMed.
  16. N. Hadian and M. Rezaei, Fuel, 2013, 113, 571–579 CrossRef CAS PubMed.
  17. A. Laobuthee, S. Wongkasemjit, E. Traversa and R. M. Laine, J. Eur. Ceram. Soc., 2000, 20, 91–97 CrossRef CAS.
  18. J. Li, T. Ikegami, J. Lee, T. Mori and Y. Yajima, Ceram. Int., 2001, 27, 481–489 CrossRef CAS.
  19. M. F. Zawrah, H. Hamaad and S. Meky, Ceram. Int., 2007, 33, 969–978 CrossRef CAS PubMed.
  20. M. M. Rashad, Z. I. Zaki and H. El-Shall, J. Mater. Sci., 2009, 44, 2992–2998 CrossRef CAS PubMed.
  21. C. Păcurariu, I. Lazău, Z. Ecsedi, R. Lazău, P. Barvinschi and G. Mărginean, J. Eur. Ceram. Soc., 2007, 27, 707–710 CrossRef PubMed.
  22. G. Ye, G. Oprea and T. Troczynski, J. Am. Ceram. Soc., 2005, 88, 3241–3244 CrossRef CAS PubMed.
  23. T. Shiono, H. Ishitomi, Y. Okamoto and T. Nishida, J. Am. Ceram. Soc., 2000, 83, 645–647 CrossRef CAS PubMed.
  24. Y. Yuan, S. R. Zhang and W. You, J. Sol-Gel Sci. Technol., 2004, 30, 223–227 CrossRef CAS.
  25. P. Tian, J. Ye, N. Xu, W. Gong, Q. Zhang, Y. Lin and G. Ning, Chem. Commun., 2011, 47, 12008–12010 RSC.
  26. Q. S. Zhang, J. W. Ye, P. Tian, X. Y. Lu, Y. Lin, Q. Zhao and G. L. Ning, RSC Adv., 2013, 3, 9739–9744 RSC.
  27. X. Y. Han, P. Tian, H. C. Pang, Q. Song, G. L. Ning, Y. H. Yu and H. X. Fang, RSC Adv., 2014, 4, 28119–28125 RSC.
  28. J. Hu, Z. Song, L. Chen, H. Yang, J. Li and R. Richards, J. Chem. Eng. Data, 2010, 55, 3742–3748 CrossRef CAS.
  29. W. Cai, J. Yu and M. Jaroniec, J. Mater. Chem., 2010, 20, 4587–4594 RSC.
  30. W. Cai, Y. Hu, J. Chen, G. Zhang and T. Xia, CrystEngComm, 2012, 14, 972–977 RSC.
  31. T. Zhu, J. S. Chen and X. W. D. Lou, J. Phys. Chem. C, 2012, 116, 6873–6878 CAS.
  32. B. Wang, H. Wu, L. Yu, R. Xu, T. Lim and X. W. David Lou, Adv. Mater., 2012, 24, 1111–1116 CrossRef CAS PubMed.
  33. E. H. Walker Jr, J. W. Owens, M. Etienne and D. Walker, Mater. Res. Bull., 2002, 37, 1041–1050 CrossRef.
  34. J. Guo, H. Lou, H. Zhao, X. Wang and X. Zheng, Mater. Lett., 2004, 58, 1920–1923 CrossRef CAS PubMed.
  35. O. R. Evans, A. T. Bell and T. D. Tilley, J. Catal., 2004, 226, 292–300 CrossRef CAS PubMed.
  36. T. Selvamani, A. Sinhamahapatra, D. Bhattacharjya and I. Mukhopadhyay, Mater. Chem. Phys., 2011, 129, 853–861 CrossRef CAS PubMed.
  37. C. M. Janet, B. Viswanathan, R. P. Viswanath and T. K. Varadarajan, J. Phys. Chem. C, 2007, 111, 10267–10272 CAS.
  38. H. B. Bafrooei and T. Ebadzadeh, Ceram. Int., 2013, 39, 8933–8940 CrossRef CAS PubMed.
  39. T. Kadosh, Y. Cohen, Y. Talmon and W. D. Kaplan, J. Am. Ceram. Soc., 2012, 95, 3103–3108 CrossRef PubMed.
  40. Y. Wang, W. Li, X. L. Jiao and D. R. Chen, J. Mater. Chem. A, 2013, 1, 10720–10726 CAS.
  41. J. Fei, Y. Cui, X. Yan, W. Qi, Y. Yang, K. Wang, Q. He and J. Li, Adv. Mater., 2008, 20, 452–456 CrossRef.
  42. C. Y. Han, H. Y. Li, H. P. Pu, H. L. Yu, L. Deng, S. Huang and Y. M. Luo, Chem. Eng. J., 2013, 217, 1–9 CrossRef CAS PubMed.

Footnote

Electronic supplementary information (ESI) available: EDX, powder XRD pattern and N2 adsorption/desorption isotherms of as-prepared MAS samples, and kinetics parameter and isotherm parameters for the adsorption of Congo red on MAS powder. See DOI: 10.1039/c4ra11032c

This journal is © The Royal Society of Chemistry 2015
Click here to see how this site uses Cookies. View our privacy policy here.