DOI:
10.1039/C4RA10995C
(Paper)
RSC Adv., 2015,
5, 11697-11713
Imidazolium-based ionic liquids as modulators of corrosion inhibition of SDS on mild steel in hydrochloric acid solutions: experimental and theoretical studies†
Received
23rd September 2014
, Accepted 7th January 2015
First published on
7th January 2015
Abstract
The inhibition performance of six cationic ionic liquids (ILs); 1-ethyl-3-methylimidazolium chloride (EMIm Cl), 1-butyl-3-methylimidazolium chloride (BMIm Cl), 1-butyl-3-methylimidazolium hexafluorophosphate (BMIm PF6), 1-butyl-3-methylimidazolium tetrafluoroborate (BMIm BF4), 1-butyl-3-methylimidazolium bromide (BMIm Br), and 1-hexyl-3-methylimidazolium chloride (HMIm Cl) and their mixtures with an anionic surfactant, sodium dodecyl sulfate (SDS), was investigated using electrochemical impedance spectroscopy (EIS), potentiodynamic polarization (PDP), atomic force microscopy (AFM), dynamic light scattering (DLS), Fourier transform infrared spectroscopy (FT-IR) and quantum chemical calculations. Using these ILs, which differ in counter ion or chain length, allowed investigation of counter ion types and tail length effects on inhibition efficiency. The results show that formation of a three-dimensional hydrogen bond network between imidazolium rings and their counter ions can effect the corrosion behavior on mild steel. Among the studied ILs, HMIm Cl exhibited the best inhibition efficiency. Moreover, the theoretical quantitative structure activity relationship (QSAR) methods were used to predict the inhibition efficiency. Solutions of ILs/SDS mixtures showed good inhibition properties compared to solutions of individual surfactant and ILs, due to strong adsorption on the metal surface and formation of a protective film. In ILs/SDS mixed systems, the attractive electrostatic interaction between them is an advantage for vesicle or wormlike micelle formation, leading to an increase in inhibition efficiency. It is clear from the DLS results that the average aggregate size appears to increase with increasing chain length. The interaction between ILs/SDS on the metal surface (in the solid–liquid interface) was analyzed on the basis of regular solution theory. The results demonstrated that attractive interactions between ILs and SDS were strong in the solid–liquid interface. The flow effect was studied using a rotating disc electrode (RDE). The results confirmed that aggregates formed of ILs/SDS interaction are not stable and separated from the surface under flow condition. Metal surface characterization was performed using AFM and FT-IR. Potentiodynamic polarization investigations indicated that the studied inhibitors were mixed type inhibitors. Adsorption of the inhibitors on the mild steel surface obeyed the Langmuir adsorption isotherm. Furthermore, adsorption (ΔG0ads) free energy in mixtures decreased compared to single ones.
1. Introduction
Acid solutions are usually utilized in different industries like acid pickling, industrial acid improvement, acid descaling and oil well acidizing.1–3 Inhibitors protect the metal against an acid attack effectively. There are a range of organic inhibitors which tend to decrease the corrosion rate of different metals in acidic solutions.4,5 The data show that almost all organic inhibitors act through adsorption on the metal surface. Most of the used efficient inhibitors have heteroatoms such as N, O, S and multiple bonds in their molecules through which they are adsorbed on the metal surface.6–8 The results show that adsorption depends on molecular structure of the studied inhibitors, surface charge density and zero charge potential of metals.9,10 ILs have attracted significant attention in recent years.11,12 The interest in ILs stems from their potential as ‘green solvents’ as a result of chemical and nonflammability thermal stability, low vapor pressure, solvent transport and high ionic conductivity.13,14 Common ILs are conformed by an organic cation (i.e. ammonium, imidazolium, pyrrolidinium, phosphonium, piperidinium, sulfonium) along with a complex anion (i.e. bromide, chloride, hexafluorophosphate, tetrafluoroborate).15 Configuration of ILs consists of an amphiphilic group with a long-chain hydrophobic tail and a hydrophilic polar head. The molecular configuration is able to form micelles and lowering interfacial tension of aggressive media, which results in an enhancement in surface wetting and adsorption.14–17 These properties have a useful effect on exposed surfaces and may be responsible of the corrosion inhibition of metals. Imidazolium compounds are studied to show corrosion resistant behavior on copper,8,14,18,19 mild steel1,4 and aluminum.8 In the structure of the imidazolium bases, the atoms of the imidazolium ring and the –C![[double bond, length as m-dash]](https://www.rsc.org/images/entities/char_e001.gif) N– group can form a big π bond.8,20 The electron of the imidazolium bases enter unoccupied orbitals of iron and π* orbital can also accept the electrons of d orbitals of iron to form feedback bonds, resulting in high inhibition efficiency. Recently, Hua et al.8 have investigated the acid corrosion inhibition process of mild steel in 1 M HCl by 1-butyl-3-methylimidazolium chlorides (BMIC) and 1-butyl-3-methylimidazolium hydrogen sulfate ([BMIm]HSO4). They showed that both inhibitors enhanced the inhibition efficiency with increasing inhibitor concentration and the efficiency of the two inhibitors are in the order [BMIm]HSO4 > BMIC. The electron donating groups on the imidazolium base structure (such as; Cl and S), increases the electron density on the nitrogen of the –C
N– group can form a big π bond.8,20 The electron of the imidazolium bases enter unoccupied orbitals of iron and π* orbital can also accept the electrons of d orbitals of iron to form feedback bonds, resulting in high inhibition efficiency. Recently, Hua et al.8 have investigated the acid corrosion inhibition process of mild steel in 1 M HCl by 1-butyl-3-methylimidazolium chlorides (BMIC) and 1-butyl-3-methylimidazolium hydrogen sulfate ([BMIm]HSO4). They showed that both inhibitors enhanced the inhibition efficiency with increasing inhibitor concentration and the efficiency of the two inhibitors are in the order [BMIm]HSO4 > BMIC. The electron donating groups on the imidazolium base structure (such as; Cl and S), increases the electron density on the nitrogen of the –C![[double bond, length as m-dash]](https://www.rsc.org/images/entities/char_e001.gif) N– group, causing inhibition efficiency. In particular, S atom is found to have excellent capability of offering free electrons. Therefore, [BMIm]HSO4 is more effective than BMIC in inhibiting the corrosion of mild steel in HCl. In another work, Ebenso et al.4 studied the effectiveness of newly synthesized ILs according to their length on the corrosion of mild steel in 1.0 M HCl. Electrochemical impedance spectroscopy measurements of these compounds at a given concentration followed the sequence 1-hexyl-3-methylimidazolium bis(trifluoromethyl-sulfonyl) imide ([HMIm][NTf2]) > 1-butyl-3-methylimidazolium bis(trifluoromethyl-sulfonyl) imide ([BMIm][NTf2]) > 1-propyl-3-methylimidazolium bis(trifluoromethyl-sulfonyl) imide ([PMIM][NTf2]), this performance may be attributed to the adsorbability of the ILs studied, which primarily due to the increasing adsorption at the metal surface with increasing molecular size and therefore molecular mass. Up to now, alone surfactants and ILs have been used as corrosion inhibitors. However, a few works have been carried out on inhibition of steel corrosion in acid solutions using of mixed systems. It is well-known that the critical micelle concentration (CMC) and even the structure of micelle are changed in the presence of ILs particularly in imidazolium-based ILs.21–23 Thus, investigation of imidazolium-based ILs/surfactant mixed systems gets more important since the self-assembly behavior of a surfactant can be optimized with ILs in order to be used in particular systems. Most of these ILs influence surfactant self-assembly systems through the formation of a three-dimensional hydrogen bond network along with electrostatic and hydrophobic interactions.21,22 Thus, we focused on using ILs as additive on self-assembly of an ionic surfactant and applying them as corrosion inhibitors in acid solutions. Hence, in the present study, we investigated the inhibition and adsorption behaviors of ionic liquid comprised of ethyl, butyl and hexyl chain in combinations with different counter-ions and also, their binary mixtures with different concentrations of sodium dodecyl sulfate (SDS). Using ILs with different alkyl chains and counterions, the effects of alkyl tail length and counterion on the inhibitor role of these selected ILs in corrosion processes were investigated. Techniques applied include the electrochemical measurements, atomic force microscopy (AFM), dynamic light scattering (DLS), Fourier transform infrared spectroscopy (FT-IR). Moreover, using density functional theory (DFT) calculations the structural and electronic characteristics of ILs have been developed to predict the anticorrosive capability of ILs with the QSAR approach. The main purpose of this research is to maximize the inhibitor adsorption onto mild steel while minimizing the aqueous inhibitor concentration by using ILs/SDS mixed systems. Moreover, the regular solution theory was used to predict the nature and strength of interactions between the surfactant and ionic liquid on the metal surface.
N– group, causing inhibition efficiency. In particular, S atom is found to have excellent capability of offering free electrons. Therefore, [BMIm]HSO4 is more effective than BMIC in inhibiting the corrosion of mild steel in HCl. In another work, Ebenso et al.4 studied the effectiveness of newly synthesized ILs according to their length on the corrosion of mild steel in 1.0 M HCl. Electrochemical impedance spectroscopy measurements of these compounds at a given concentration followed the sequence 1-hexyl-3-methylimidazolium bis(trifluoromethyl-sulfonyl) imide ([HMIm][NTf2]) > 1-butyl-3-methylimidazolium bis(trifluoromethyl-sulfonyl) imide ([BMIm][NTf2]) > 1-propyl-3-methylimidazolium bis(trifluoromethyl-sulfonyl) imide ([PMIM][NTf2]), this performance may be attributed to the adsorbability of the ILs studied, which primarily due to the increasing adsorption at the metal surface with increasing molecular size and therefore molecular mass. Up to now, alone surfactants and ILs have been used as corrosion inhibitors. However, a few works have been carried out on inhibition of steel corrosion in acid solutions using of mixed systems. It is well-known that the critical micelle concentration (CMC) and even the structure of micelle are changed in the presence of ILs particularly in imidazolium-based ILs.21–23 Thus, investigation of imidazolium-based ILs/surfactant mixed systems gets more important since the self-assembly behavior of a surfactant can be optimized with ILs in order to be used in particular systems. Most of these ILs influence surfactant self-assembly systems through the formation of a three-dimensional hydrogen bond network along with electrostatic and hydrophobic interactions.21,22 Thus, we focused on using ILs as additive on self-assembly of an ionic surfactant and applying them as corrosion inhibitors in acid solutions. Hence, in the present study, we investigated the inhibition and adsorption behaviors of ionic liquid comprised of ethyl, butyl and hexyl chain in combinations with different counter-ions and also, their binary mixtures with different concentrations of sodium dodecyl sulfate (SDS). Using ILs with different alkyl chains and counterions, the effects of alkyl tail length and counterion on the inhibitor role of these selected ILs in corrosion processes were investigated. Techniques applied include the electrochemical measurements, atomic force microscopy (AFM), dynamic light scattering (DLS), Fourier transform infrared spectroscopy (FT-IR). Moreover, using density functional theory (DFT) calculations the structural and electronic characteristics of ILs have been developed to predict the anticorrosive capability of ILs with the QSAR approach. The main purpose of this research is to maximize the inhibitor adsorption onto mild steel while minimizing the aqueous inhibitor concentration by using ILs/SDS mixed systems. Moreover, the regular solution theory was used to predict the nature and strength of interactions between the surfactant and ionic liquid on the metal surface.
2. Materials and methods
2.1. Materials
1-Ethyl-3-methylimidazolium chlorides (EMIm Cl), 1-butyl-3-methylimidazolium chlorides (BMIm Cl), 1-hexyl-3-methylimidazolium chlorides (HMIm Cl), 1-butyl-3-methylimidazolium hexafluorophosphate (BMIm PF6), 1-butyl-3-methylimidazolium tetrafluoroborate (BMIm BF4), 1-butyl-3-methylimidazolium bromide (BMIm Br) were synthesized22,24 (the characterization data for the synthesized ILs are given in ESI file, S1†), hydrochloric acid (HCl) and sodium dodecyl sulfate (SDS) were purchased from Merck Company and used without purification. The mild steel sheets (its composition: 0.081 wt% C, 0.020 wt% Si, 0.40 wt% Mn, 0.0098 wt% P, 0.0094 wt% S, 0.056 wt% Al, 0.031 wt% Ni, 0.0061 wt% Co, 0.028 wt% Cu and remainder was iron) of 1 × 1 cm were abraded with a series of emery paper (220–600–800–1000–1200–2000 grades) and then washed with deionized water and acetone.
2.2. Methods
2.2.1 Electrochemical measurements (EIS, PDP and RDE).
Electrochemical experiments were carried out in a conventional three-electrode cell with a platinum counter electrode (CE) and an Ag/AgCl reference electrode. Impedance measurements (EIS) were performed at open circuit potential (Eocp) with the AC voltage amplitude 10 mV in the frequency range from 100 kHz to 10 mHz. All of measurements were carried out with potentiostat/Galvanostat EG & G model 273 connected to a personal computer. The potential of potentiodynamic polarization (PDP) curves was scanned from −250 mV vs. OCP, to 250 mV vs. OCP at a sweep rate of 0.5 mV s−1. The OCP time was 60 min for our experimentation. A rotating disk electrode (RDE) is a hydrodynamic working electrode used in a three-electrode system. The electrode rotates during experiments, inducing a flux of analyte to the electrode. These working electrodes are used in electrochemical studies when investigating reaction mechanisms related to the redox chemistry. The active geometrical surface area of a steel disk electrode was 0.12 cm2. All rotating tests were done in HCl solution like the other samples with the same concentration.
2.2.2 Corrosion tests (AFM and ATR-FTIR).
Fourier Transform Infrared (FTIR) measurements were carried out on a Nicolet iS10 FTIR spectrometer at room temperature. FTIR was used to study the surface after immersion in solution for a specific time using the Attenuated Total Reflectance (ATR) technique. Also, immersion corrosion analysis of mild steel samples in the acidic solutions with and without the optimal concentration of the inhibitors was performed using atomic force microscopy (AFM, Veeco, CP-Research).
2.2.3 Ionic liquid solution analysis (DLS and tensiometry measurements).
Tensiometry measurements were made with a Krüss K12 tensiometer under atmospheric pressure by the ring method. The platinum ring was thoroughly cleaned and flame-dried before each measurement. Zetasizer Nano (Malvern, MRK825-02, UK) was also employed for dynamic light scattering (DLS).
2.2.4 Theoretical/computational approaches (DFT and QSAR).
All quantum chemical calculations were performed using density functional theory (DFT) at the B3LYP level of theory with 6-31G(d) basis set. This level of theory is a popular method which has been commonly used for corrosion studies. The quantum chemical calculations were done in both gas and aqueous phases. Tomasi's polarized continuum model (PCM) was used for better approach of the experimental results obtained in aqueous solution. All optimizations were done in gas phase using the Gaussian03 program. The solvent effects were taken into consideration by using the PCM model incorporated in the Gaussian03 program.4 To conclude the most stable geometry of the inhibitors molecules, the minimum energy has been evaluated starting with molecular mechanics optimization of the conformers generated using Gaussian03 program. Also, the theoretical quantitative structure activity relationship (QSAR) modeling was performed to study the corrosion inhibiting efficiency of some ILs. It is a standard computational tool to connect the inhibition properties of a compound to its structural, physiochemical, or conformational properties represented by multiple chemical descriptors.4,25,26
3. Results and discussions
3.1. Electrochemical impedance spectroscopy measurements (EIS) and theoretical investigations
The corrosion behavior of mild steel in acidic solution was investigated by the EIS in the absence and presence of pure ILs; EMIm Cl, BMIm Cl and HMIm Cl in various concentrations at 25 °C. The Nyquist plots of mild steel in inhibited and uninhibited acidic solutions of the inhibitors are shown in Fig. 1 (the Bode plots are in ESI file, S2†). It is obvious the impedance value in the pure HCl solution was smaller than that of with ionic liquid present.
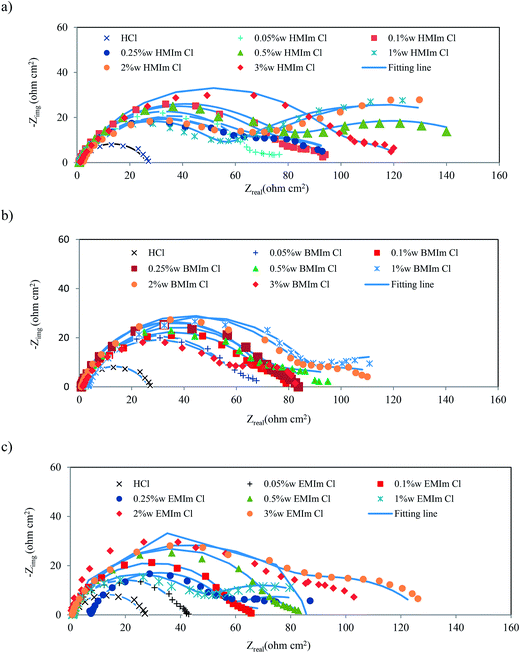 |
| | Fig. 1 Nyquist plots for mild steel in 2 M HCl solution containing of (a) HMIm Cl, (b) BMIm Cl and (c) EMIm Cl (Bode plots are in ESI file†). | |
After the addition of the ILs, it is clear that the impedance modulus of the system is gradually increased by increasing concentration of inhibitor. It shows that the development of a protective film on mild steel surface and the corrosion of surface was successfully decreased by the inhibitor. Also, it is evident that the Nyquist diagrams are not perfect semi-circles in most concentrations; deviations of this kind are often referred to as the frequency dispersion of interfacial impedance.4 This event can be related to the change on the morphology of the electrode surface resulting from interfacial phenomena or surface roughness.4 In these cases, Nyquist plots are composed of two time constant. Also, the Bode plot exhibits two distinct capacitive time constants. The first time constant at high frequencies is related to the charge transfer resistance (Rct), which can be ascribed to the electron transfer reactions occurring in the mild steel/ILs solution interface, and the other one at low frequencies can be described to the film resistance (Rf), which corresponds to the adsorption of ILs. The corresponding corrosion resistance is equivalent to the sum of the charge-transfer and layer resistance, R = Rct + Rf. The impedance results can be explained by the equivalent circuit shown in Fig. 2a. This circuit takes into account the inhomogeneity at the solid–liquid interface, where Rs is the solution resistance, Rct represents the charge transfer resistance, Rf represents the film resistance, CPE1 and CPE2 represent constant phase elements to replace the double layer capacitance (Cdl) and the film capacitance (Cf), respectively.12,27 Double-layer capacitance (Cdl) is defined as:27
where
Y0 is the magnitude of the CPE,
ωmax is the frequency at which the imaginary part of impedance has a maximum (rad s
−1) and
n is the
Cdl exponent. The same relation is for the film capacitance (
Cf) and the corresponding capacitance is equivalent to the sum of them, 1/
C = 1/
Cdl + 1/
Cf. The impedance diagrams show only a capacitive loop that arises from the time constant of the electrical double layer and charge transfer resistance in SDS and blank solutions (
Fig. 2b).
 |
| | Fig. 2 Electrical equivalent circuit diagram used for modeling steel/solution interface in 2 M HCl solution in (a) with ILs and their mixtures and (b) in SDS and blank solutions. | |
By adding the ILs, aggregates are formed to start and change the process of adsorption and desorption on the surface and cause to deviate of perfect semi-circle. Table 1 shows the impedance parameters obtained from these investigations. The inhibition efficiency (IEE) and surface converge (θ) derived from the charge transfer resistance is calculated by:28,29
| |  | (3) |
where
R0 and
R are corrosion resistances in the absence and presence of the inhibitor, respectively.
Table 1 indicates that the
R or IE
E values are increased while
C values decreased by addition of the inhibitor concentration. According to the
Table 1, at low ionic liquid concentration, an increase in
R is pointed to the adsorption of ILs on mild steel. This adsorption is due to the electrostatic interaction between ILs and the solid surface.
Table 1 Electrochemical parameters of impedance, potentiodynamic polarization results and the corrosion inhibition efficiencies of different pure ILs concentration in 2 M HCl at 298 K
| 2 M HCl+ |
R
a (Ω cm2) |
C (mF cm−2) |
IEE% |
i
corr (µA cm−2) |
IEP% |
E (mV) |
b
c (mV dec−1) |
b
a (mV dec−1) |
|
The values in parentheses are the parameters of the second time constant.
|
|
x wt% Hmim Cl
|
| Blank |
26 |
5.680 |
— |
678 |
— |
−409 |
160 |
91 |
| 0.05 |
62(15) |
0.300 |
67 |
230 |
66 |
−458 |
135 |
112 |
| 0.1 |
79(20) |
0.330 |
73 |
180 |
73 |
−492 |
145 |
128 |
| 0.25 |
72(36) |
0.286 |
76 |
163 |
76 |
−473 |
188 |
112 |
| 0.5 |
92(81) |
0.198 |
85 |
132 |
79 |
−405 |
243 |
124 |
| 1 |
53(162) |
0.196 |
88 |
109 |
84 |
−460 |
114 |
93 |
| 2 |
66(145) |
0.216 |
87 |
130 |
82 |
−489 |
166 |
143 |
| 3 |
109(13) |
0.246 |
78 |
141 |
80 |
−435 |
141 |
76 |
![[thin space (1/6-em)]](https://www.rsc.org/images/entities/char_2009.gif) |
|
x wt% BMIm Cl
|
| Blank |
26 |
5.680 |
— |
678 |
— |
−409 |
160 |
91 |
| 0.05 |
60(12) |
0.353 |
64 |
275 |
59 |
−425 |
220 |
137 |
| 0.1 |
73(10) |
0.323 |
68 |
230 |
66 |
−452 |
147 |
108 |
| 0.25 |
71(12) |
0.295 |
68 |
188 |
72 |
−437 |
112 |
82 |
| 0.5 |
76(24) |
0.234 |
74 |
165 |
75 |
−454 |
124 |
103 |
| 1 |
87(37) |
0.297 |
79 |
143 |
79 |
−476 |
123 |
108 |
| 2 |
81(28) |
0.280 |
76 |
186 |
72 |
−465 |
136 |
114 |
| 3 |
62(21) |
0.311 |
68 |
205 |
69 |
−432 |
152 |
96 |
![[thin space (1/6-em)]](https://www.rsc.org/images/entities/char_2009.gif) |
|
x wt% EMIm Cl
|
| Blank |
26 |
5.680 |
— |
678 |
— |
−409 |
160 |
91 |
| 0.05 |
38(6) |
0.510 |
40 |
379 |
44 |
−428 |
159 |
102 |
| 0.1 |
59(10) |
0.484 |
62 |
235 |
65 |
−460 |
128 |
99 |
| 0.25 |
61(15) |
0.299 |
65 |
211 |
69 |
−441 |
129 |
80 |
| 0.5 |
75(10) |
0.245 |
69 |
203 |
70 |
−442 |
119 |
87 |
| 1 |
59(44) |
0.152 |
74 |
180 |
73 |
−463 |
106 |
106 |
| 2 |
86(27) |
0.257 |
76 |
162 |
72 |
−437 |
130 |
92 |
| 3 |
81(26) |
0.203 |
75 |
157 |
69 |
−446 |
113 |
84 |
Inhibition efficiency increased with increasing concentration up to reach an optimal concentration. As the ionic liquid concentration was further increased, the corrosion rate remained approximately constant due to the saturation of the ionic liquid adsorbed layer and further increase in the concentration contributes only to the formation of hydrogen bonding of imidazolium ring with their counterions as well as with water molecules in solution.21,22 The same results were achieved in our previous works.30,31 The adsorption of ILs molecules and its size and shape on the surface are controlled by length of the hydrophobic tails and interaction charged head groups.32 It is understood that the higher chain length results in higher inhibition efficiency in ILs with the same head group. The chain length compatibility changes film properties such as aggregate lifetime, surface tension and etc.33,34 In our systems, we studied ILs with different chain lengths, the effect of chain length compatibility are very important. Inhibition efficiency of ILs in mild steel is mainly determined by the equilibrium of the hydrophobic effect of the hydrophobic tails and the electrostatic interaction of the head groups. The difference on the corrosion rate in the presence of HMIm Cl, BMIm Cl and EMIm Cl in the same concentrations can be justified by the above explanation. Furthermore, the IE of these compounds within the same concentration follows the sequence HMIm Cl > BMIm Cl > EMIm Cl, this behavior may be attributed to the adsorbability of the inhibitors studied, which chiefly due to the increasing adsorption at the metal surface with increasing molecular size. Similar results were also obtained by Hua et al.8,20 during their study on the corrosion inhibition of aluminum in HCl by some alkylimidazolium derivatives. Their measurements showed that the inhibition efficiency increased with increasing in the inhibitor concentration and the efficiency of these inhibitors was in the order of O(octyl)MIC > H(hexyl)MIC > B(butyl)MIC.8,20 Such as inorganic salts, imidazolium-based ILs are compounds which contain two parts, the imidazolium cation inions and the counter ionic.22,35 The effects of different counter ions with a similar cationic portion were investigated as well. Impedance measurements of the mild steel were performed in the presence of different concentrations of BMIm PF6, BMIm BF4, BMIm Br and BMIm Cl. According to the Fig. 3 and Table 2, corrosion rate decreases by increasing ionic liquid concentration and also in the presence of ILs with the same chain length but different counter ions follows the pattern; BMIm PF6 > BMIm BF4 > BMIm Br > BMIm Cl.
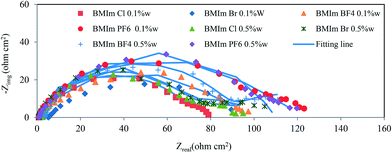 |
| | Fig. 3 Nyquist plots for mild steel in 2 M HCl solution containing of pure ILs with different counter ions. | |
Table 2 Electrochemical parameters of impedance, potentiodynamic polarization results and the corrosion inhibition efficiencies of different ILs concentration with different counterions in 2 M HCl at 298 K
| 2 M HCl+ |
R
a (Ω cm2) |
C (mF cm−2) |
IEE% |
i
corr (µA cm−2) |
IEP% |
E (mV) |
b
c (mV dec−1) |
b
a (mV dec−1) |
|
The values in parentheses are the parameters of the second time constant.
|
|
x wt% BMIm Cl
|
| Blank |
26 |
5.680 |
— |
678 |
— |
−409 |
160 |
91 |
| 0.1 |
73(10) |
0.323 |
68 |
230 |
66 |
−452 |
147 |
108 |
| 0.5 |
76(24) |
0.234 |
74 |
165 |
75 |
−454 |
124 |
103 |
![[thin space (1/6-em)]](https://www.rsc.org/images/entities/char_2009.gif) |
|
x wt% BMIm Br
|
| Blank |
26 |
5.680 |
— |
678 |
— |
−409 |
160 |
91 |
| 0.1 |
59(16) |
0.304 |
65 |
190 |
72 |
−478 |
132 |
110 |
| 0.5 |
82(18) |
0.278 |
74 |
167 |
75 |
−465 |
118 |
110 |
![[thin space (1/6-em)]](https://www.rsc.org/images/entities/char_2009.gif) |
|
x wt% BMIm BF
4
|
| Blank |
26 |
5.680 |
— |
678 |
— |
−409 |
160 |
91 |
| 0.1 |
82(35) |
0.311 |
77 |
128 |
81 |
−474 |
125 |
94 |
| 0.5 |
82(30) |
0.246 |
77 |
103 |
84 |
−465 |
117 |
117 |
![[thin space (1/6-em)]](https://www.rsc.org/images/entities/char_2009.gif) |
|
x wt% BMIm PF
6
|
| Blank |
26 |
5.680 |
— |
678 |
— |
−409 |
160 |
91 |
| 0.1 |
98(28) |
0.274 |
79 |
92 |
86 |
−471 |
130 |
99 |
| 0.5 |
102(22) |
0.221 |
79 |
105 |
84 |
−467 |
125 |
82 |
The increase in inhibition efficiencies of organic compounds in the presence of some anions has been reported by some authors attributed to a synergistic effect.36–39 It is consideration that the anions can increase adsorption of the organic cations in solution by creating intermediate bridges between the metal surface and the positive end of the ILs.40 Thus, corrosion inhibition synergism arising from increased surface coverage is resulted from ion-pair interactions between the organic cations and the anions. According to the Scheme 1 (the most stable geometry is achieved using Gaussian03 program), the counter ions and cation parts are adsorbed on the metal surface. Due to the strong interaction of imidazolium cations with the counter ions and formation of hydrogen bond network between imidazolium ring and their counter ions, a multi layer of inhibitor molecules is formed on the steel surface of steel which results in higher inhibition efficiency.
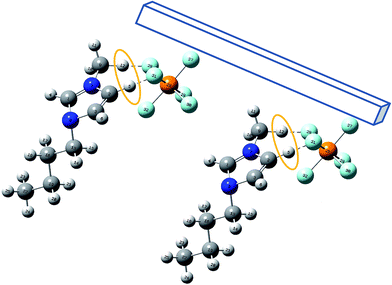 |
| | Scheme 1 The adsorption mode of ionic liquid onto the steel surface. | |
In this study, the ionic radii of anions are in sequence of PF6− > BF4− > Br− > Cl−, and hence the synergistic effects of studied anions increase in above sequence. There are various reports on hydrogen bonding ability of hydrogen atoms of imidazolium ring with their counter ions as well as with water molecules.21,22,41,42 PF6− and BF4− are the larger anions and bind stronger than smaller anions (Br− and Cl−) resulting in the better protection of mild steel. Also, in BMIm PF6, P atom is found to a donating group and is more efficient than other ILs in inhibiting the corrosion of mild steel in HCl. According to our previous studies,21–23 the cationic part of ILs has a stronger effect on the mixture of these compounds with surfactants neglecting the counter ion. Thus, we have focused on the influence of hydrocarbon tail on ILs/SDS mixtures.
We studied the effect of ILs with different chain length and the same cationic part and counter ion on the improvement of SDS corrosion inhibition. According to the Table 3 and Fig. 4 (and ESI file, S3†), an increase in inhibition efficiency was obtained in the cases of ILs/SDS mixtures in comparison with SDS used alone as the inhibitor. The optimum concentration (1 wt%) of ILs added to the different concentrations of SDS was obtained using EIS as explained above. The ILs/SDS mixtures provided higher inhibition efficiency compared to pure SDS.
Table 3 Electrochemical parameters of impedance, potentiodynamic polarization results and the corrosion inhibition efficiencies of SDS and ILs (1 wt%)/SDS mixtures in 2 M HCl at 298 K
| 2 M HCl+ |
R
a (Ω cm2) |
C (mF cm−2) |
IEE% |
i
corr (µA cm−2) |
IEP% |
E (mV) |
b
c (mV dec−1) |
b
a (mV dec−1) |
|
The values in parentheses are the parameters of the second time constant.
The values are obtained from our previous work.34
|
|
x mM SDS
b
|
| 0.01 |
33 |
4.450 |
21 |
481 |
29 |
−417 |
29 |
117 |
| 0.05 |
34 |
4.960 |
24 |
409 |
40 |
−425 |
141 |
96 |
| 0.1 |
35 |
4.123 |
26 |
399 |
41 |
−434 |
117 |
93 |
| 0.25 |
38 |
2.562 |
31 |
342 |
49 |
−445 |
147 |
84 |
| 0.5 |
42 |
1.471 |
38 |
201 |
70 |
−439 |
123 |
96 |
| 1 |
53 |
1.704 |
51 |
148 |
78 |
−436 |
141 |
74 |
![[thin space (1/6-em)]](https://www.rsc.org/images/entities/char_2009.gif) |
|
HMIm Cl (1 wt%) + SDS (x mM)
|
| 0.01 |
62(16) |
0.339 |
66 |
405 |
64 |
−410 |
252 |
132 |
| 0.05 |
72(20) |
0.176 |
72 |
310 |
72 |
−422 |
224 |
106 |
| 0.1 |
123(40) |
0.219 |
84 |
142 |
79 |
−465 |
133 |
119 |
| 0.25 |
147(65) |
0.190 |
87 |
112 |
83 |
−472 |
119 |
104 |
| 0.5 |
99(106) |
0.171 |
87 |
80 |
88 |
−450 |
148 |
88 |
| 1 |
115(80) |
0.189 |
86 |
99 |
85 |
−473 |
130 |
107 |
![[thin space (1/6-em)]](https://www.rsc.org/images/entities/char_2009.gif) |
|
BMIm Cl (1 wt%) + SDS (x mM)
|
| 0.01 |
63(27) |
0.426 |
71 |
283 |
58 |
−453 |
250 |
114 |
| 0.05 |
78(17) |
0.401 |
72 |
241 |
64 |
−452 |
138 |
110 |
| 0.1 |
82(24) |
0.289 |
75 |
194 |
71 |
−435 |
145 |
93 |
| 0.25 |
119(38) |
0.547 |
83 |
167 |
75 |
−436 |
126 |
85 |
| 0.5 |
107(30) |
0.241 |
81 |
86 |
87 |
−454 |
106 |
78 |
| 1 |
109(12) |
0.194 |
78 |
154 |
77 |
−446 |
135 |
94 |
![[thin space (1/6-em)]](https://www.rsc.org/images/entities/char_2009.gif) |
|
EMIm Cl (1 wt%) + SDS (x mM)
|
| 0.01 |
40(31) |
0.302 |
63 |
242 |
48 |
−419 |
144 |
86 |
| 0.05 |
74(20) |
0.239 |
72 |
188 |
59 |
−437 |
132 |
88 |
| 0.1 |
91(39) |
0.194 |
80 |
160 |
76 |
−426 |
122 |
123 |
| 0.25 |
82(39) |
0.217 |
78 |
143 |
79 |
−461 |
134 |
94 |
| 0.5 |
114(16) |
0.277 |
80 |
91 |
86 |
−460 |
104 |
85 |
| 1 |
117(5) |
0.252 |
78 |
107 |
84 |
−455 |
129 |
101 |
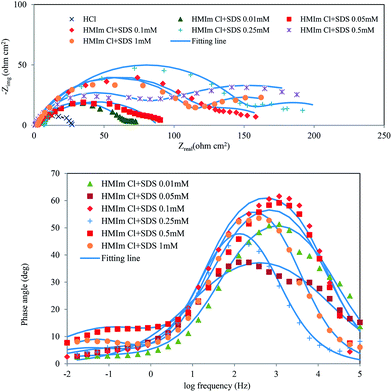 |
| | Fig. 4 Nyquist and Bode plots for mild steel in 2 M HCl solution containing of HMIm Cl (1 wt%)/SDS mixtures (Nyquist and Bode plots for mixtures of BMIm Cl and EMIm Cl with SDS are in ESI file†). | |
As the SDS concentration was increased in the HMIm Cl/SDS system, an increase in resistance values was found. These values are higher than surfactant alone. The same results were reported for BMIm Cl/SDS and EMIm Cl/SDS systems. ILs/SDS mixtures can form aggregates in low concentrations; because of attractive electrostatic interactions between their two oppositely charged polar groups. The impedance of mixed systems can be explained by the equivalent circuit shown in Fig. 2a. Dynamic light scattering (DLS) was used to obtain the average size of the aggregates within SDS (0.5 mM) in water/HCl (2 M)/ILs (1 wt%) systems (Fig. 5). No aggregates were found in HMIm Cl (1 wt%)/water/HCl system. Consistent with the observed result in the present work, previous studies were found no aggregates for HMIM Cl17 or formed micelle in higher concentration than (1 wt%).17,21
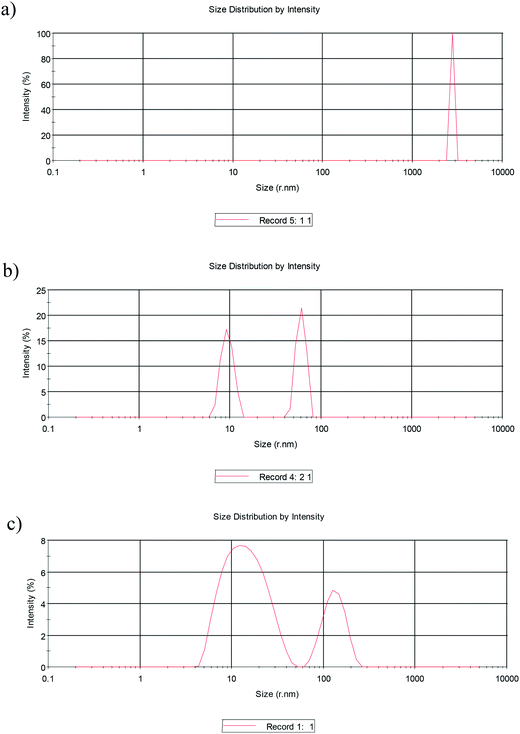 |
| | Fig. 5 Size distribution of (a) SDS in HMIm Cl/water/HCl, (b) SDS in BMIm Cl/water/HCl, (c) SDS in EMIm Cl/water/HCl. | |
Considering the DLS diagrams, it is clear that the average aggregate size appears to increase with increasing chain length. The results confirmed that the interactions involving IL ions and the surfactant are very strong and causes to large aggregates. These aggregates form not only under the influence of electrostatic interaction between head groups but also as a consequence of hydrophobic interactions between alkyl chains of IL and SDS. A more dramatic increase in the aggregate size was observed in HMIm Cl as compared to BMIm Cl and EMIm Cl due to longer chain length and more interaction. The results are in agreement with our previous work.23 According to the DLS results, in the case of the HMIm Cl/water system, the presence of a hexyl chain on the HMIm+ allows it to align with the tail part of SDS and form larger aggregates, whereas, in the case of BMIm Cl and EMIm Cl, the butyl and ethyl chains can't align with the tail part of SDS as well as HMIm Cl. Therefore, this difference in the alkyl chain of HMIm Cl, BMIm Cl and EMIm Cl is responsible for the different size changes and different behaviors of the ILs in the inhibition efficiency. When the ILs/SDS reaches critical aggregate concentration, the monomer activity becomes constant and further increase in the concentration contributes only to the micellization in solution. Since, the maximum efficiency occurs at the critical aggregate concentration of the mixed systems. The results are in agreement with the critical aggregate concentration values for these systems obtained using the tensiometry technique (Fig. 6).
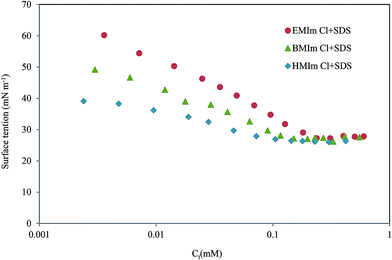 |
| | Fig. 6 Surface tension vs. total concentration in 2 M HCl solution at 298 K. | |
We also used the rotating disc electrode (RDE) to investigate the stability of systems studied. The corrosion inhibition studies in electrolyte flow situations are of significant importance. Research on the use of corrosion inhibitors for corrosion control has almost exclusively been done under static conditions, and not much has been done under flow conditions. The aim of this part is to expand the previous study to the case of inhibition of mild steel under flow conditions. For optimized concentrations of ILs (1 wt%)/SDS (0.5 mM) mixtures, electrochemical measurements were carried out with the rotating electrode. Experiments were performed within the RDE rotation in 350 and 700 rpm. A rotating disk electrode (RDE) gives the arrangement that allows the electrolyte to get transported first perpendicularly to the electrode surface, and then to flow over the surface in a circular–parallel pattern. The RDE configuration also permits for excellent control of the electrolyte hydrodynamics, and is frequently used in electrode kinetics/mass-transport electrochemical studies. Reynolds number (Re) for the RDE was calculated using the following equation,
| |  | (4) |
where
r is the radius of the RDE electrochemically-active surface area (cm),
ω is the angular velocity (rad s
−1) and
v is the electrolyte kinematic viscosity (cm
2 s
−1). The Reynolds numbers are 1953 and 3907 for 350 and 700 rpm, respectively. Since the Reynolds number for the transition from laminar to turbulent flow is
Re > 10
5, the low Reynolds numbers show that EIS experiments were made in the laminar flow regime. At high rotations, inhibitors can't adsorb well on the solid surface and effect on IE. As shown in
Fig. 7, using rotating electrode reduces inhibition efficiency between 20–35%. According to the previous section, ILs/SDS mixtures modify the size and morphology of aggregates so that larger aggregate like vesicles or wormlike micelles can be formed rather than spherical micelles.
23
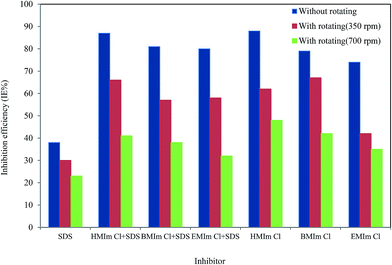 |
| | Fig. 7 Plot of inhibition efficiency vs. SDS (0.5 mM), ILs (1 wt%)/SDS (0.5 mM) and ILs (1 wt%) in Re = 0, Re = 1953 and Re = 3907. | |
Under flow condition (Fig. 7), these large aggregates are not very stable and separating from the surface. Then, the mixtures can protect the mild surface but not as well as pure ionic liquids.
3.2. Tafel polarization measurements
The potentiodynamic polarization curves for mild steel in 2 M HCl solution after immersion time of 90 min in the absence and presence of various concentrations of HMIm Cl, BMIm Cl, EMIm Cl and their mixtures with SDS are shown in Fig. 8 (and ESI file, S4†). Under the experimental conditions achieved, the cathodic branch represents the hydrogen evolution reaction, while the anodic branch represents the iron dissolution reaction.
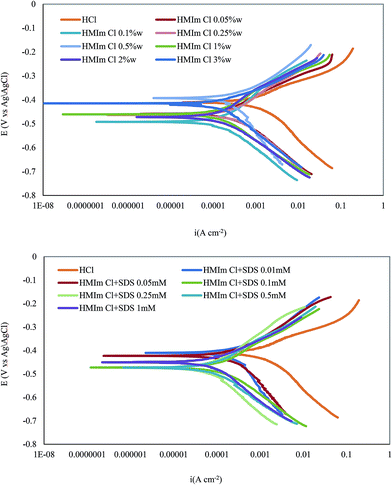 |
| | Fig. 8 Potentiodynamic polarization curves for mild steel in 2 M HCl solution without and with different concentrations of HMIm Cl and HMIm Cl (1 wt%)/SDS mixtures at 298 K (potentiodynamic polarization curves for BMIm Cl, EMIm Cl and their mixtures with SDS are in ESI file†). | |
The anodic dissolution of iron occurs according to the following steps:12,43
| | | (FeCl−)ads ⇆ (FeCl)ads + e− | (6) |
| | | (FeCl)ads → (FeCl+) + e− | (7) |
The cathodic hydrogen evolution follows the steps:12,43
| | | (FeH+)ads + e− → (FeH)ads | (10) |
| | | (FeH)ads + H+ + e− → Fe + H2 | (11) |
The FeCl− adsorbed competed with chloride anion in the anodic branch and then the species (FeCl−)ads interact with ILs cations to form monomolecular layers as a complex on the mild steel surface. These layers preserve the surface from attack by chloride ions. Also, the protonated imidazolium molecules are adsorbed at cathodic sites in competition with hydrogen ions that resulting in reduce hydrogen evolution.15 Polarization curves indicate that all used inhibitors have inhibition effect on both cathodic and anodic reactions of the corrosion process. Therefore, these compounds can be classified as mixed type inhibitors with a chiefly cathodic action.3,15,44
Moreover, potentiodynamic polarization curve relatively shifts to more negative direction in the presence of inhibitor and this effect is more evident at ILs with higher chain length, which signifies that the compounds involve cathodic reaction more than anodic reaction.12 However, in most cases, the displacement in Ecorr is <85 mV, therefore, studied inhibitors can be defined as a mixed-type ones. Similar results have been also reported elsewhere for other compounds.12,15 Electrochemical corrosion parameters such as corrosion potential (Ecorr), cathodic and anodic Tafel slops (ba, bc) and corrosion current density (icorr), obtained by extrapolation of Tafel lines, are collected in Tables 1 and 3. The inhibition efficiency (IEP) at different inhibitor concentrations was calculated from the following equation:33
| |  | (13) |
where
icorr and
i′corr are uninhibited and inhibited corrosion current densities, respectively. It can be observed from
Tables 1 and
3 that IE
P% increased with increase in the inhibitor concentration until it reaches a maximum value. These results also confirm the findings obtained from EIS measurements. As described in the previous section, the protective behavior of ILs and ILs/SDS can be explained by adsorption of inhibitors on the metal surface. At low concentration, the monomers are individually adsorbed on the surface with a low coverage percentage. As concentration increases, the amount adsorbed increases leading to a higher degree of coverage and consequently higher corrosion inhibition. At higher concentration, the efficiency is reduced or constant. This behavior may be due to saturation of the adsorbed layer. The results obtained from the polarization measurements are in good agreement with those achieved from the EIS method. An increase in inhibition efficiency was also obtained in the cases of ILs with higher chain length in comparison with lower one. According to the
Table 3 and polarization measurements, the efficiency of ILs/SDS system is higher than alone surfactant and ILs especially at high concentrations of SDS. This behavior is due to the electrostatic interaction between surfactant and ILs. The values of the Tafel slopes (
ba,
bc) changed with the addition of ILs alone and in combination with SDS. This indicates that the inhibitor affected both of these reactions. These results demonstrate that ILs exhibit both cathodic and anodic inhibition effects and acts as a mixed-type inhibitor in 2 M HCl.
45
3.3. Theoretical/computational approaches
Quantum chemical calculations were also carried out to observed whether there is a relation between the molecular structures of studied inhibitors and their inhibition effects.46,47 Density function theory (DFT) has been used to study the characteristics of the inhibitor/surface mechanism and to describe the structural nature of the inhibitor on the corrosion process.47–50 To extend the experimental studies various quantum chemical parameters such as dipole moment, energy of the highest occupied molecular orbital (EHOMO) and energy of the lowest unoccupied molecular orbital (ELUMO) were calculated. The DFT method is widely utilized to analyze the characteristics of the inhibitor/metal surface mechanisms and also to describe the structure and nature of the inhibitor in the corrosion process.4 Moreover, DFT/B3LYP is highly recommended to understand the chemical reactivity and selectivity in terms of frontier molecular orbitals (the HOMO and the LUMO) and related properties such as dipole moment (µ), hardness (η) and electronegativity (χ). In terms of the Koopman's theorem, the various quantities are defined as follows;4,51 electronegativity (χ) is the measure of the power of an electron or group of atoms to attract electrons toward itself, and it can be estimated by using the equation| | | χ ≅ −1/2(EHOMO + ELUMO) | (14) |
Global hardness (η) measures the resistance of an atom to a charge transfer and is estimated using the equation
| | | η ≅ −1/2(EHOMO − ELUMO) | (15) |
Global softness (σ) describes the capacity of an atom or group of atoms to receive electrons; it is estimated by using the eqn (16),
| | | σ = 1/η ≅ −2/(EHOMO − ELUMO) | (16) |
Global electrophilicity index (ω) is valued by using the electronegativity and chemical hardness parameters through the eqn (17),
A small value of electrophilicity describes a good nucleophile while a high value of electrophilicity defines a good electrophile. The computational study was first done in gas phase, then, with Tomasi's polarized continuum model (PCM) was used for better approach of the experimental results obtained in aqueous solution. This method represents the solvent as a continuum of uniform dielectric constant (ε) and defines the cavity where the solute is placed as a uniform series of interlocking atomic spheres. Since the theoretical calculation cannot signify the effect of hydrogen chloride solution, water was used to contain the solvent effect with consideration of appropriate dielectric constant instead. The calculated quantum chemical parameters related to the inhibition efficiency of the studied inhibitors, such as frontier molecular orbitals (FMO) energies (EHOMO, ELUMO), gap energy (ΔE), dipole moment (µ), electronegativity (χ), global hardness (η), global electrophilicity index (ω) and global softness (σ) are summarized in Table 4. High values of EHOMO point out the nature of the molecule to provide electrons to an appropriate acceptor with vacant molecular orbitals. The HOMO energy follows the order of HMIm Cl > BMIm Cl > EMIm Cl. On the other hand, the LUMO energy (ELUMO) shows the electron accepting ability of the molecule, the lower values cause to the higher accepting capability of electrons. In the same way, low values of the gap ΔE = ELUMO − EHOMO, provide good inhibition efficiencies since the energy to remove an electron from the last occupied orbital will be minimized. The energy band gap for ILs lay in the following order: EMIm Cl > BMIm Cl > HMIm Cl, which is in a good agreement with the calculated values of the inhibition efficiencies obtained from both, polarization curves and EIS techniques. For the ILs with the same chain length and cationic part and different counter ions, the sequence is not in accordance with the order of inhibition efficiencies listed in Table 2, which suggests there is a complex nature of interactions involved in the corrosion inhibition process. Despite the fact that the electron donating ability of counter ions follow the order Cl− > Br− > BF4− > PF6−, the experimental results are not in agreement with this order. As described above, since PF6− and BF4− are more capable to form hydrogen bond compared to Cl− and Br−, they cover a higher surface of metal resulting in a higher protection. There is an interplay between two mentioned effects, donating effect and hydrogen bonding, which the hydrogen bond is often overwhelmed. Contrarily, the hydrogen bond effect is not concerned in a series of ILs with the same counter ion and the HOMO–LUMO energy gap is in agreement with the corrosion inhibition efficiency. In addition, according to Table 4, the comparison between the optimized geometrical structures of ILs showed that the bond length between H(5), H(12) (Scheme 1) and counter ions are shorter for PF6− and BF4− than Br− and Cl−. These differences can be explained by the better formation of hydrogen bonding between F and H in imidazolium cation part.
Table 4 Calculated quantum chemical parameters for ionic liquid
|
Quantum parameters
|
HMIm Cl
|
BMIm Cl
|
EMIm Cl
|
BMIm Br |
BMIm BF4 |
BMIm PF6 |
|
x (wt%) ILs = 0.5.
|
|
In gas phase
|
|
E
HOMO (eV) |
−5.3069 |
−5.3210 |
−5.4597 |
−5.2378 |
−8.2412 |
−8.4003 |
|
E
LUMO (eV) |
−0.7602 |
−0.7409 |
−0.7485 |
−0.8097 |
−1.3464 |
−1.5707 |
| ΔE (eV) |
4.5467 |
4.5801 |
4.7112 |
4.4281 |
6.8948 |
6.8296 |
|
µ (Debye) |
9.72 |
9.50 |
8.68 |
9.10 |
13.10 |
14.86 |
|
χ
|
3.0335 |
3.0309 |
3.1041 |
3.0237 |
4.7938 |
4.9855 |
|
η
|
2.2733 |
2.2900 |
2.3556 |
2.2140 |
3.4474 |
3.4148 |
|
σ
|
0.4398 |
0.4366 |
0.4245 |
0.4516 |
0.2901 |
0.2928 |
|
ω
|
10.4601 |
10.5189 |
11.3486 |
10.1216 |
39.6115 |
42.4377 |
| H(5)–H bond (Å) |
2.61 |
2.88 |
2.63 |
2.93 |
2.29 |
2.31 |
| H(12)–H bond (Å) |
2.87 |
2.61 |
2.95 |
2.77 |
2.07 |
2.13 |
![[thin space (1/6-em)]](https://www.rsc.org/images/entities/char_2009.gif) |
|
In aqueous phase
|
|
E
HOMO (eV) |
−6.6438 |
−6.6446 |
−6.6449 |
−6.5405 |
−7.8671 |
−7.9005 |
|
E
LUMO (eV) |
−1.0160 |
−1.0169 |
−1.0057 |
−1.0829 |
−1.0878 |
−1.1751 |
| ΔE (eV) |
5.6278 |
5.6277 |
5.6392 |
5.4576 |
6.7793 |
6.7254 |
|
µ (Debye) |
18.26 |
18.30 |
18.39 |
18.82 |
19.25 |
21.96 |
|
χ
|
3.8299 |
3.8307 |
3.8309 |
3.8117 |
4.4774 |
4.5378 |
|
η
|
2.8139 |
2.8138 |
2.814 |
2.7288 |
3.3896 |
3.3627 |
|
σ
|
0.3553 |
0.3553 |
0.3553 |
0.3664 |
0.2950 |
0.2973 |
|
ω
|
20.6373 |
20.6461 |
20.6488 |
19.8234 |
33.9771 |
34.6217 |
| H(5)–H bond (Å) |
2.37 |
2.37 |
2.34 |
3.18 |
2.31 |
2.23 |
| H(12)–H bond (Å) |
3.06 |
3.06 |
3.81 |
4.11 |
2.08 |
2.51 |
| % IEa |
79% |
75% |
70% |
75% |
84% |
84% |
The dipole moment (µ) is another sign of the electronic distribution in a molecule and is one of the properties used to discuss and to rationalize the structure and reactivity of many chemical systems. High dipole moment values are reported to facilitate adsorption (and therefore inhibition) by influencing the transport process through the adsorbed layer. Several authors have stated that the inhibition efficiency increases with dipole moments values.46,52 The high dipole moment value of these compounds probably indicates strong dipole–dipole interactions between them and metallic surface. The results obtained in the present study showed that the calculated dipole moments of the ILs are in the order: HMIm Cl > BMIm Cl > EMIm Cl and BMIm PF6 > BMIm BF4 > BMIm Br > BMIm Cl, which is also in agreement with the experimental results mentioned above. The calculated quantum chemical parameters in the presence of solvent and gas phase do not exhibit significant differences in a total procedure (Table 4); however, a slight modification was usually obtained for these parameters. The related energy of HOMO and LUMO for PF6− and BF4− are more negative in gas phase than solvent one which is due to the larger radius and less salvation compared to the gas phase. The same changes for other quantum parameters; electronegativity, global hardness, global softness and global electrophilicity index are achieved and the results are listed in Table 4. The optimized species with the corresponding HOMO and the LUMO electron density distributions of the ILs are also presented in Fig. 9. The positive and negative phase is represented in red and green color, respectively. The results show similarities between the LUMO and HOMO's distributions of the studied inhibitors. HOMO is often associated with the electron donating ability of a molecule, while LUMO specifies its ability to accept electrons. According to the Fig. 9, the HOMO density is higher in the zone near to the imidazole ring.
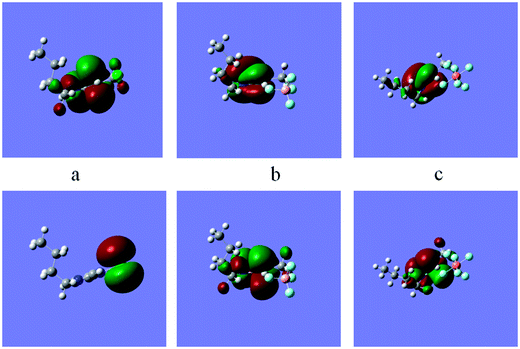 |
| | Fig. 9 Frontier molecule orbital density distributions of (a) BMIm Cl, (b) BMIm BF4 and (c) BMIm PF6, top: HUMO, bottom: LUMO. | |
Thereby it is reasonable to assume that the imidazolium ring segment in ILs acts as the main site to donate electrons and form coordinate bond with unoccupied d-orbitals of metal. As described above, the classification of ILs with the same counterion based on the theoretical study is in nearly good agreement with the reported experimental corrosion inhibition efficiencies. But, these parameters are not good quantities to correlate with experimental inhibition efficiencies of the ILs with different counterions because of hydrogen bonding ability of them. In addition, there has been an attempt to correlate the given quantum chemical parameters to the observed inhibition efficiencies of the inhibitors with different counterions. Several quantitative structure activity equations are employed to correlate the quantum chemical index with the experimental inhibition efficiencies.4 The linear and the nonlinear multiple regression were utilized to correlate the composite index of quantum chemical parameters with the experimental inhibition efficiency of the studied ILs (Fig. 10).
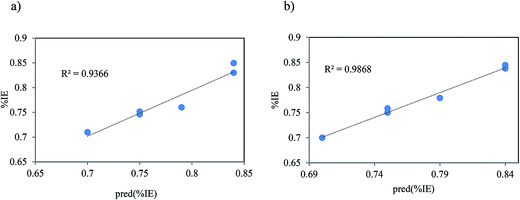 |
| | Fig. 10 Representative plots of the correlation between experimental inhibition efficiency (% IE) and the predicted inhibition efficiency (pred(% IE)) of (a) linear and (b) nonlinear multiple regressions. | |
As Table 5 shows, an optimum of two quantum chemical parameters is sufficient to produce a good correlation with experimentally determined inhibition efficiency. For the linear multiple regression equations, the combination of EHOMO and ELUMO parameters provides the best quantum index for correlation with experimental inhibition efficiencies:
| | | % IE = 0.4 − 0.05EHOMO + 0.05ELUMO | (18) |
| R2 = 0.9366, SSE = 0.005 and RMSE = 0.0128 |
Table 5 Pair of quantum chemical parameters utilized to derive the linear and the nonlinear multiple regression equationa,b
| Quantum parameter |
Derived QSAR equation |
R
2
|
SSE |
RMSE |
The R2 value, the SSE, and the RMSE values are also reported. The quantum chemical parameters were obtained from the in vacuum results calculated using the B3LYP/6-31G(d) method.
R
2 is the coefficient of determination, and SSE and RMSE are defined as:4  . .
|
|
Multiple linear regression equation
|
|
E
HOMO, ELUMO |
% IE = 0.4 − 0.05EHOMO + 0.05ELUMO |
0.9366 |
0.005 |
0.0128 |
![[thin space (1/6-em)]](https://www.rsc.org/images/entities/char_2009.gif) |
|
Multiple nonlinear regression equations
|
| (η, σ), (σ, µ) |
% IE = −724.88 + 724.42(η)(σ) + 0.3244(σ)(µ) |
0.9868 |
0.003 |
0.0059 |
According to the Table 5, for the derived nonlinear multiple regression equations the combination of η, σ and µ also provides the best quantum index to correlate with experimental inhibition efficiencies:
| | | % IE = −724.88 + 724.42(σ)(η) + 0.3244(σ)(µ) | (19) |
| R2 = 0.9868, SSE = 0.003, RMSE = 0.0059 |
This equation suggests that a high dipole moments results in greater inhibition efficiency since the values of R2 are reasonably high (0.937 or 0.987) while the values of SSE (0.003 or 0.005) and RMSE (0.0128 or 0.0059) are reasonably small for two equations. It is reasonable to infer that the combination of two quantum chemical parameters provides a better correlation between quantum chemical parameters and experimentally determined inhibition efficiency of the inhibitors. This method can be useful for ILs with the different counterions and different hydrogen bonding ability.
3.4. FT-IR studies
Attenuated Total Reflectance-Fourier Transform Infrared (ATR-FTIR) spectroscopy is a well-established description instrument allows the examination of the nature of the inhibiting complexes attached to the metal surface without the need for removal of the surface compound. Our studies showed that ATR-FTIR spectroscopy is a powerful characterization technique which can assist in the identification of the inhibitors on the surface. The ATR-FTIR spectrum of mild steel exposed to solutions of the blank solution, HMIm Cl and HMIm Cl/SDS (Fig. 11) showed evidence of a film formation on the surface.
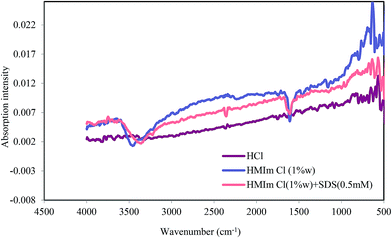 |
| | Fig. 11 FT-IR absorption spectra of mild steel without inhibitor, with HMIm Cl and HMIm Cl/SDS mixture. | |
Characteristic heterocyclic N–H vibration absorption bands were observed at about 3458 and 3360 cm−1. The spectra of HMIm Cl and HMIm Cl/SDS showed other peaks which may be assignable to C![[double bond, length as m-dash]](https://www.rsc.org/images/entities/char_e001.gif) N stretching vibrations (1608 cm−1), a ring C–H stretching vibrations (3225, 3221 cm−1), methylene scissoring vibrational mode for SDS (1458 cm−1) and sulfate asymmetric and symmetric stretching bands at 956, 999 and 1151 cm−1. Therefore, the results give a clear picture of the chemical processes occurring on the surface when exposed to corrosive and ILs solutions.
N stretching vibrations (1608 cm−1), a ring C–H stretching vibrations (3225, 3221 cm−1), methylene scissoring vibrational mode for SDS (1458 cm−1) and sulfate asymmetric and symmetric stretching bands at 956, 999 and 1151 cm−1. Therefore, the results give a clear picture of the chemical processes occurring on the surface when exposed to corrosive and ILs solutions.
3.5. Surfactant–ionic liquid interaction at liquid–solid interface
One of the best ways of improving the surface or interfacial properties of a surfactant is ionic liquid addition which their interaction results in synergy between them. Synergy is identified here as the situation in which the properties of the mixture are better than those attainable with the individual components by themselves. The nature and the strength of the interaction between ionic liquid and surfactant in binary systems can be determined by calculating the values of their β parameters, which can be attained using the nonideal interaction in binary surfactant mixtures model developed by Rosen et al.53,54 We extended the regular solution behavior of Rosen to calculate of the solution/solid interface. In our previous work, we used this model to predict and calculate the strength and interaction parameter of ionic surfactant mixtures.30,31 The interaction parameter for mixed monolayer formation at the aqueous solution/solid interface, βS, is calculated using the following equations:55| |  | (20) |
| |  | (21) |
where Z1 is the mole fraction of surfactant in the total mixed monolayer and C01, C02 and C012 are the molar concentrations in the solution phases of surfactant, ionic liquid, and their mixture, respectively, at the mole fraction α1 of surfactant required to produce a given corrosion current density (icorr). In our experiments, we determined C01, C02 and C012, which correspond to corrosion current density of icorr = 208 µA cm−2 (see Fig. 12). Eqn (20) is solved numerically for Z1, which is then substituted into eqn (21) to calculate βS.
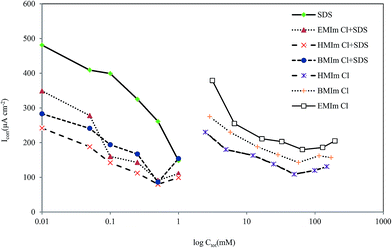 |
| | Fig. 12 Plot of current density vs. total concentration of inhibitors in 2 M HCl solution at 298 K. | |
In the present work, the interaction between different ILs and SDS in the mixed monolayer on the metal surface was calculated. The values obtained of βS are listed in Table 6.
Table 6 Calculated parameters for interaction of ILs with anion surfactant (SDS) at liquid–solid interface
| Inhibitor type |
β
S
|
f
ionic liquid
|
f
SDS
|
X
ionic liquid
|
| HMIm Cl/SDS |
−23.86 |
0.0173 |
0.0005 |
0.56 |
| BMIm Cl/SDS |
−19.90 |
0.0212 |
0.0019 |
0.56 |
| EMIm Cl/SDS |
−20.03 |
0.0155 |
0.0027 |
0.54 |
The β value provides information on the strength of the degree of interaction between ionic liquid and surfactant, and is related to the degree of nonideality of this interaction in ILs/SDS systems. The calculated values of the surface interaction parameter βS were negative; indicating strong synergism between the surfactant and ionic liquid in the mixed monolayer at liquid–solid interface. Because the value of the β parameter is comparative to the free energy of mixing of the system, a negative β value indicates that the attractive interaction between surfactant and ionic liquid is stronger than the attractive interaction between each type of them. Also, the mole fraction of components at ILs/SDS mixtures are nearly 0.5 (1 IL molecule per SDS molecule) and the activity coefficient gets much smaller than unity, indicating the presence of both species on the surface. This is in agreement with the expectation that interacting hydrophobic groups will be more easily accommodated at the planar solid/aqueous solution interface. As shown in Table 3, the corrosion inhibition efficiencies for solutions of ILs/SDS mixtures are higher compared with alone surfactant. This reflects that ILs/SDS system has a synergistic effect on the corrosion process of mild steel in 2 M HCl solution and can be explained by the strong adsorption of ILs/SDS on the metal surface.
3.6. Adsorption isotherm
As known that organic inhibitors affect their inhibition by the adsorption of the inhibitor molecules onto the metal surface.1,6 The adsorption process is controlled by the type of aggressive media, the chemical structures of inhibitors, the distribution of charge in molecule, the nature and surface charge of metal. The values of surface coverage (θ) for the different concentrations of the studied inhibitors have been used to clarify the best adsorption isotherm to determine the adsorption process. Langmuir adsorption isotherm was found to fit well with our experimental data. The Langmuir adsorption isotherm equation was employed as the following equation:6| |  | (22) |
where θ is the surface coverage, which was concluded from the polarization measurements, Cinh is the molar concentration of the inhibitor. Kads is the standard adsorption equilibrium constant, related to the standard free energy of adsorption (ΔG0ads) by the following equation:6| | ΔG0ads = −RT![[thin space (1/6-em)]](https://www.rsc.org/images/entities/char_2009.gif) ln(55.5Kads) ln(55.5Kads) | (23) |
where T is the absolute temperature and R is the universal gas constant. The Kads values can be calculated from the intercept lines on the  axes and 55.5 is the water molar concentration of the solution. A straight line was obtained on plotting
  vs. Cinh as shown in Fig. 13 which proposed that the adsorption of the inhibitors used from 2 M HCl solutions on mild steel follows Langmuir's adsorption isotherm.
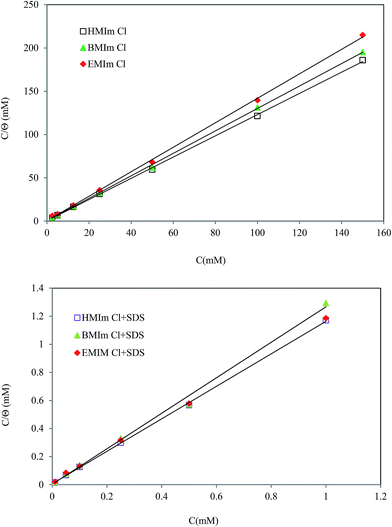 |
| | Fig. 13 Langmuir adsorption plots for mild steel in 2 M HCl solution at 298 K in different concentrations of pure ILs and ILs/SDS mixtures. | |
The ΔG0ads values of alone ILs and their mixtures with SDS are listed in Table 7. The negative value of ΔG0ads shows a strong interaction of the inhibitor molecules onto the mild steel surface.
Table 7 Standard free energy of adsorption of mild steel in 2 M HCl at 298 K
| Inhibitor type |
SDS |
HMIm Cl |
BMIm Cl |
EMIm Cl |
HMIm Cl + SDS |
BMIm Cl + SDS |
EMIm Cl + SDS |
| ΔG0ads (kJ mol−1) |
−30.13 |
−29.73 |
−29.57 |
−29.74 |
−40.74 |
−37.47 |
−30.13 |
It can be seen that ILs/SDS mixtures have more negative values than alone, which can be resulted in more attraction between head groups and more inhibitors can be adsorbed on the surface. Literature review reveals that the values of ΔG0ads around −40 kJ mol−1 involves charge distribution or transfer from the inhibitor molecules to the metal surface to form a co-ordinate covalent bond (chemical adsorption).27 In this case, ILs/SDs mixtures have a standard free energy around the above value, which suggests that a chemical adsorption process is acting more on the steel surface.
3.7. Weight loss measurements
Weight loss tests were carried out by weighing the mild steel specimens before and after immersion in 50 mL acid solutions without and with ILs and ILs/SDS mixtures for 270 min at 25 °C. The corrosion rate (W) and the percentage protection efficiency IEw (%) were calculated according to the following equations:30| |  | (25) |
where Δm (g) is the mass loss, S (cm2) is the area, t (h) is the immersion period, and W0 (g cm−2 h−1) and W (g cm−2 h−1) are the corrosion rates of mild steel without and with the inhibitor, respectively. As can be seen in Table 8, the ILs and their mixtures with SDS inhibit the corrosion of mild steel.
Table 8 Weight loss results of mild steel with ILs and their mixtures with SDS
| Inhibitor type |
HMIm Cl (1 wt%) |
BMIm Cl (1 wt%) |
EMIm Cl (1 wt%) |
HMIm Cl (1 wt%)/SDS (0.5 mM) |
BMIm Cl (1 wt%)/SDS (0.5 mM) |
EMIm Cl (1 wt%)/SDS (0.5 mM) |
| Corrosion rate, W (g cm−2 h−1) |
0.0019 |
0.0023 |
0.0039 |
0.0016 |
0.0018 |
0.0043 |
| Inhibition efficiency, IEW (%) |
74.5 |
69.9 |
49.1 |
79.8 |
76.3 |
43.9 |
The inhibition efficiency increases with increasing the alkyl chain length attached to the imidazolium cation. It was also concluded that ILs are stable on the surface and can be used as good inhibitors.
3.8. Surface characterization; AFM study
In order to further characterize the influence of the studied compound on the surface morphology of mild steel, the morphologies of mild steel surface immersed in the corrosion solution in the absence and presence of HMIm Cl and HMIm Cl/SDS are displayed in Fig. 14. It can be seen that the mild steel surface immersed in blank solution showed mountain-like shape while the mild steel immersed in 2 M HCl solution containing the inhibitor was more smooth.45,56
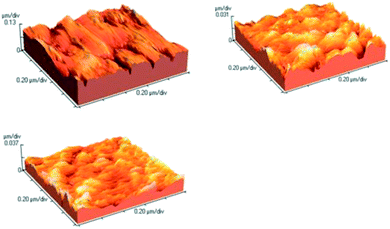 |
| | Fig. 14 AFM three-dimensional images for the mild steel surface in (a) 2 M HCl (b) 1 wt% HMIm Cl (c) HMIm Cl (1 wt%) + SDS (0.5 mM). | |
As can be seen from Fig. 14, there was much less damage on the surface of mild steel with HMIm Cl and HMIm Cl/SDS mixture. The average roughness of mild steel in 2 M HCl without inhibitor was calculated to be 18.5 nm. However, in presence of HMIm Cl and its mixture with SDS, the average roughness was reduced to 5.0 and 4.4, respectively.
4. Conclusions
The effect of the alkyl chains length and counterion size on the imidazolium cations was studied on the corrosion behavior of mild steel. The improvement in the effectiveness of the corrosion inhibitors was found to increase as the alkyl chain length attached to the imidazolium cation was increased or as the size of counter ion increased. Based on DFT calculations and the quantitative structure activity relationship (QSAR) approach, the models have developed to predict inhibition efficiency of the inhibitors. The values of R2 indicate the capability of this model to predict the inhibitor efficiency of ILs. It can be concluded that the development of a linear equation between inhibitor efficiency and structural parameters might be of some help in designing new inhibitors. In addition, results showed the imidazolium-based ILs mixtures with SDS are suitable inhibitor for mild steel in HCl solution. EIS and polarization measurements confirmed that adsorption of ILs/SDs mixtures exhibit synergism at interfaces compared to the adsorption of single SDS and ILs. Addition of ILs to surfactant solution show synergistic effects, increases the inhibition efficiency of the surfactant while decreases the concentration of inhibitor. We stressed the potential significance of regular solution theory in the quantitative interpretation of the interaction between the ILs and SDS at the solid–liquid interface. This study revealed that the ability of imidazolium-based ILs to form hydrogen bonding with anions molecules can effect on inhibition efficiency of mild steel. The influence of electrolyte flow on corrosion inhibition of ILs and their mixtures with SDS was studied and concluded that the large aggregates are not stable and separate from the surface. On the basis of the Tafel polarization results, ILs can be classified as mixed inhibitors. The adsorption model obeys to the Langmuir adsorption isotherm and the negative values of the Gibbs free energy suggest high adsorption ability of ILs and their mixtures on steel surface. The AFM and FT-IR analyses indicate that steel corrosion can be inhibited evidently due to the adsorption of ILs and their mixtures with SDS on the surface.
Acknowledgements
We are grateful to Dr Ahmad Mani at Tarbiat Modares University for his assistance to this work.
References
- P. M. Krishnegowda, V. T. Venkatesha, P. K. M. Krishnegowda and S. B. Shivayogiraju, Ind. Eng. Chem. Res., 2013, 52, 722–728 CrossRef CAS.
- D. K. Yadav and M. A. Quraishi, Ind. Eng. Chem. Res., 2012, 51, 14966–14979 CrossRef CAS.
- H. Ashassi-Sorkhabi and M. Es'haghi, Mater. Chem. Phys., 2009, 114, 267–271 CrossRef CAS PubMed.
- L. C. Murulana, A. K. Singh, S. K. Shukla, M. M. Kabanda and E. E. Ebenso, Ind. Eng. Chem. Res., 2012, 51, 13282–13299 CrossRef CAS.
- E. Malel and D. E. Shalev, J. Chem. Educ., 2012, 90, 490–494 CrossRef.
- S.-H. Yoo, Y.-W. Kim, K. Chung, N.-K. Kim and J.-S. Kim, Ind. Eng. Chem. Res., 2013, 52, 10880–10889 CrossRef CAS.
- A. Zarrouk, B. Hammouti, A. Dafali and F. Bentiss, Ind. Eng. Chem. Res., 2013, 52, 2560–2568 CrossRef CAS.
- Q. Zhang and Y. Hua, Electrochim. Acta, 2009, 54, 1881–1887 CrossRef CAS PubMed.
- S. Ghareba and S. Omanovic, Electrochim. Acta, 2011, 56, 3890–3898 CrossRef CAS PubMed.
- M. Lebrini, M. Lagrenée, H. Vezin, L. Gengembre and F. Bentiss, Corros. Sci., 2005, 47, 485–505 CrossRef CAS PubMed.
- D. Zhao, M. Liu, J. Zhang, J. Li and P. Ren, Chem. Eng. J., 2013, 221, 99–104 CrossRef CAS PubMed.
- X. Zhou, H. Yang and F. Wang, Electrochim. Acta, 2011, 56, 4268–4275 CrossRef CAS PubMed.
- O. Lebedeva, G. Jungurova, A. Zakharov, D. Kultin, E. Chernikova and L. Kustov, J. Phys. Chem. C, 2012, 116, 22526–22531 CAS.
- T. Espinosa, J. Sanes, A.-E. Jiménez and M.-D. Bermúdez, Appl. Surf. Sci., 2013, 273, 578–597 CrossRef CAS PubMed.
- N. V. Likhanova, M. A. Domínguez-Aguilar, O. Olivares-Xometl, N. Nava-Entzana, E. Arce and H. Dorantes, Corros. Sci., 2010, 52, 2088–2097 CrossRef CAS PubMed.
- M. Elachouri, M. Hajji, S. Kertit, E. Essassi, M. Salem and R. Coudert, Corros. Sci., 1995, 37, 381–389 CrossRef CAS.
- J. Łuczak, J. Hupka, J. Thöming and C. Jungnickel, Colloids Surf., A, 2008, 329, 125–133 CrossRef PubMed.
- R. Gašparac, C. Martin and E. Stupnišek‐Lisac, J. Electrochem. Soc., 2000, 147, 548–551 CrossRef PubMed.
- D.-Q. Zhang, L.-X. Gao and G.-D. Zhou, Appl. Surf. Sci., 2006, 252, 4975–4981 CrossRef CAS PubMed.
- Q. Zhang and Y. Hua, Mater. Chem. Phys., 2010, 119, 57–64 CrossRef CAS PubMed.
- S. Javadian, V. Ruhi, A. Asadzadeh Shahir, A. Heydari and J. Akbari, Ind. Eng. Chem. Res., 2013, 52, 15838–15846 CrossRef CAS.
- S. Javadian, V. Ruhi, A. Heydari, A. Asadzadeh Shahir, A. Yousefi and J. Akbari, Ind. Eng. Chem. Res., 2013, 52, 4517–4526 CrossRef CAS.
- S. Javadian, F. Nasiri, A. Heydari, A. Yousefi and A. Asadzadeh Shahir, J. Phys. Chem. B, 2014, 118, 4140–4150 CrossRef CAS PubMed.
- J. G. Huddleston, A. E. Visser, W. M. Reichert, H. D. Willauer, G. A. Broker and R. D. Rogers, Green Chem., 2001, 3, 156–164 RSC.
- I. Lukovits, A. Shaban and E. Kalman, Russ. J. Electrochem., 2003, 39, 177–181 CrossRef CAS.
- I. Lukovits, I. Bakó, A. Shaban and E. Kálmán, Electrochim. Acta, 1998, 43, 131–136 CrossRef CAS.
- A. Y. Musa, A. B. Mohamad, A. A. H. Kadhum, M. S. Takriff and L. T. Tien, Corros. Sci., 2011, 53, 3672–3677 CrossRef CAS PubMed.
- D. Asefi, M. Arami, A. A. Sarabi and N. M. Mahmoodi, Corros. Sci., 2009, 51, 1817–1821 CrossRef CAS PubMed.
- K. Khaled, Corros. Sci., 2010, 52, 3225–3234 CrossRef CAS PubMed.
- A. Yousefi, S. Javadian and J. Neshati, Ind. Eng. Chem. Res., 2014, 53, 5475–5489 CrossRef CAS.
- S. Javadian, A. Yousefi and J. Neshati, Appl. Surf. Sci., 2013, 285, 674–681 CrossRef CAS PubMed.
- S. Shiao, V. Chhabra, A. Patist, M. Free, P. Huibers, A. Gregory, S. Patel and D. Shah, Adv. Colloid Interface Sci., 1998, 74, 1–29 CrossRef CAS.
- D. Asefi, N. M. Mahmoodi and M. Arami, Colloids Surf., A, 2010, 355, 183–186 CrossRef CAS PubMed.
- Q. Zhang, Z. Gao, F. Xu and X. Zou, Colloids Surf., A, 2011, 380, 191–200 CrossRef CAS PubMed.
- K. Fumino, A. Wulf and R. Ludwig, Phys. Chem. Chem. Phys., 2009, 11, 8790–8794 RSC.
- D. Asefi, M. Arami and N. M. Mahmoodi, Corros. Sci., 2010, 52, 794–800 CrossRef CAS PubMed.
- S. Umoren, O. Ogbobe, I. Igwe and E. Ebenso, Corros. Sci., 2008, 50, 1998–2006 CrossRef CAS PubMed.
- G. Mu, X. Li and G. Liu, Corros. Sci., 2005, 47, 1932–1952 CrossRef CAS PubMed.
- X. Li, L. Tang, L. Li, G. Mu and G. Liu, Corros. Sci., 2006, 48, 308–321 CrossRef CAS PubMed.
- V. L. Martins, N. Sanchez-Ramírez, J. A. Calderon and R. M. Torresi, J. Mater. Chem. A, 2013, 1, 14177–14182 CAS.
- H.-C. Chang, J.-C. Jiang, W.-C. Tsai, G.-C. Chen and S. H. Lin, J. Phys. Chem. B, 2006, 110, 3302–3307 CrossRef CAS PubMed.
- Q.-G. Zhang, N.-N. Wang and Z.-W. Yu, J. Phys. Chem. B, 2010, 114, 4747–4754 CrossRef CAS PubMed.
- M. Valcarce and M. Vázquez, Electrochim. Acta, 2008, 53, 5007–5015 CrossRef CAS PubMed.
- M. M. Saleh and A. A. Atia, J. Appl. Electrochem., 2006, 36, 899–905 CrossRef CAS.
- X. Wang, H. Yang and F. Wang, Corros. Sci., 2010, 52, 1268–1276 CrossRef CAS PubMed.
- F. Zhang, Y. Tang, Z. Cao, W. Jing, Z. Wu and Y. Chen, Corros. Sci., 2012, 61, 1–9 CrossRef CAS PubMed.
- M. Lebrini, M. Lagrenée, H. Vezin, M. Traisnel and F. Bentiss, Corros. Sci., 2007, 49, 2254–2269 CrossRef CAS PubMed.
- D. K. Yadav and M. Quraishi, Ind. Eng. Chem. Res., 2012, 51, 8194–8210 CrossRef CAS.
- M. A. Chidiebere, C. E. Ogukwe, K. L. Oguzie, C. N. Eneh and E. E. Oguzie, Ind. Eng. Chem. Res., 2012, 51, 668–677 CrossRef CAS.
- E. E. Oguzie, C. B. Adindu, C. K. Enenebeaku, C. E. Ogukwe, M. A. Chidiebere and K. L. Oguzie, J. Phys. Chem. C, 2012, 116, 13603–13615 CAS.
- Z. El Adnani, M. Mcharfi, M. Sfaira, M. Benzakour, A. Benjelloun and M. Ebn Touhami, Corros. Sci., 2013, 68, 223–230 CrossRef CAS PubMed.
- M. Lebrini, M. Lagrenée, M. Traisnel, L. Gengembre, H. Vezin and F. Bentiss, Appl. Surf. Sci., 2007, 253, 9267–9276 CrossRef CAS PubMed.
- M. J. Rosen and X. Y. Hua, J. Colloid Interface Sci., 1982, 86, 164–172 CrossRef CAS.
- M. J. Rosen and Q. Zhou, Langmuir, 2001, 17, 3532–3537 CrossRef CAS.
- Q. Zhou and M. J. Rosen, Langmuir, 2003, 19, 4555–4562 CrossRef CAS.
- A. K. Singh and M. Quraishi, Corros. Sci., 2010, 52, 1373–1385 CrossRef CAS PubMed.
Footnote |
| † Electronic supplementary information (ESI) available. See DOI: 10.1039/c4ra10995c |
|
| This journal is © The Royal Society of Chemistry 2015 |
Click here to see how this site uses Cookies. View our privacy policy here. ![[double bond, length as m-dash]](https://www.rsc.org/images/entities/char_e001.gif) N– group can form a big π bond.8,20 The electron of the imidazolium bases enter unoccupied orbitals of iron and π* orbital can also accept the electrons of d orbitals of iron to form feedback bonds, resulting in high inhibition efficiency. Recently, Hua et al.8 have investigated the acid corrosion inhibition process of mild steel in 1 M HCl by 1-butyl-3-methylimidazolium chlorides (BMIC) and 1-butyl-3-methylimidazolium hydrogen sulfate ([BMIm]HSO4). They showed that both inhibitors enhanced the inhibition efficiency with increasing inhibitor concentration and the efficiency of the two inhibitors are in the order [BMIm]HSO4 > BMIC. The electron donating groups on the imidazolium base structure (such as; Cl and S), increases the electron density on the nitrogen of the –C
N– group can form a big π bond.8,20 The electron of the imidazolium bases enter unoccupied orbitals of iron and π* orbital can also accept the electrons of d orbitals of iron to form feedback bonds, resulting in high inhibition efficiency. Recently, Hua et al.8 have investigated the acid corrosion inhibition process of mild steel in 1 M HCl by 1-butyl-3-methylimidazolium chlorides (BMIC) and 1-butyl-3-methylimidazolium hydrogen sulfate ([BMIm]HSO4). They showed that both inhibitors enhanced the inhibition efficiency with increasing inhibitor concentration and the efficiency of the two inhibitors are in the order [BMIm]HSO4 > BMIC. The electron donating groups on the imidazolium base structure (such as; Cl and S), increases the electron density on the nitrogen of the –C![[double bond, length as m-dash]](https://www.rsc.org/images/entities/char_e001.gif) N– group, causing inhibition efficiency. In particular, S atom is found to have excellent capability of offering free electrons. Therefore, [BMIm]HSO4 is more effective than BMIC in inhibiting the corrosion of mild steel in HCl. In another work, Ebenso et al.4 studied the effectiveness of newly synthesized ILs according to their length on the corrosion of mild steel in 1.0 M HCl. Electrochemical impedance spectroscopy measurements of these compounds at a given concentration followed the sequence 1-hexyl-3-methylimidazolium bis(trifluoromethyl-sulfonyl) imide ([HMIm][NTf2]) > 1-butyl-3-methylimidazolium bis(trifluoromethyl-sulfonyl) imide ([BMIm][NTf2]) > 1-propyl-3-methylimidazolium bis(trifluoromethyl-sulfonyl) imide ([PMIM][NTf2]), this performance may be attributed to the adsorbability of the ILs studied, which primarily due to the increasing adsorption at the metal surface with increasing molecular size and therefore molecular mass. Up to now, alone surfactants and ILs have been used as corrosion inhibitors. However, a few works have been carried out on inhibition of steel corrosion in acid solutions using of mixed systems. It is well-known that the critical micelle concentration (CMC) and even the structure of micelle are changed in the presence of ILs particularly in imidazolium-based ILs.21–23 Thus, investigation of imidazolium-based ILs/surfactant mixed systems gets more important since the self-assembly behavior of a surfactant can be optimized with ILs in order to be used in particular systems. Most of these ILs influence surfactant self-assembly systems through the formation of a three-dimensional hydrogen bond network along with electrostatic and hydrophobic interactions.21,22 Thus, we focused on using ILs as additive on self-assembly of an ionic surfactant and applying them as corrosion inhibitors in acid solutions. Hence, in the present study, we investigated the inhibition and adsorption behaviors of ionic liquid comprised of ethyl, butyl and hexyl chain in combinations with different counter-ions and also, their binary mixtures with different concentrations of sodium dodecyl sulfate (SDS). Using ILs with different alkyl chains and counterions, the effects of alkyl tail length and counterion on the inhibitor role of these selected ILs in corrosion processes were investigated. Techniques applied include the electrochemical measurements, atomic force microscopy (AFM), dynamic light scattering (DLS), Fourier transform infrared spectroscopy (FT-IR). Moreover, using density functional theory (DFT) calculations the structural and electronic characteristics of ILs have been developed to predict the anticorrosive capability of ILs with the QSAR approach. The main purpose of this research is to maximize the inhibitor adsorption onto mild steel while minimizing the aqueous inhibitor concentration by using ILs/SDS mixed systems. Moreover, the regular solution theory was used to predict the nature and strength of interactions between the surfactant and ionic liquid on the metal surface.
N– group, causing inhibition efficiency. In particular, S atom is found to have excellent capability of offering free electrons. Therefore, [BMIm]HSO4 is more effective than BMIC in inhibiting the corrosion of mild steel in HCl. In another work, Ebenso et al.4 studied the effectiveness of newly synthesized ILs according to their length on the corrosion of mild steel in 1.0 M HCl. Electrochemical impedance spectroscopy measurements of these compounds at a given concentration followed the sequence 1-hexyl-3-methylimidazolium bis(trifluoromethyl-sulfonyl) imide ([HMIm][NTf2]) > 1-butyl-3-methylimidazolium bis(trifluoromethyl-sulfonyl) imide ([BMIm][NTf2]) > 1-propyl-3-methylimidazolium bis(trifluoromethyl-sulfonyl) imide ([PMIM][NTf2]), this performance may be attributed to the adsorbability of the ILs studied, which primarily due to the increasing adsorption at the metal surface with increasing molecular size and therefore molecular mass. Up to now, alone surfactants and ILs have been used as corrosion inhibitors. However, a few works have been carried out on inhibition of steel corrosion in acid solutions using of mixed systems. It is well-known that the critical micelle concentration (CMC) and even the structure of micelle are changed in the presence of ILs particularly in imidazolium-based ILs.21–23 Thus, investigation of imidazolium-based ILs/surfactant mixed systems gets more important since the self-assembly behavior of a surfactant can be optimized with ILs in order to be used in particular systems. Most of these ILs influence surfactant self-assembly systems through the formation of a three-dimensional hydrogen bond network along with electrostatic and hydrophobic interactions.21,22 Thus, we focused on using ILs as additive on self-assembly of an ionic surfactant and applying them as corrosion inhibitors in acid solutions. Hence, in the present study, we investigated the inhibition and adsorption behaviors of ionic liquid comprised of ethyl, butyl and hexyl chain in combinations with different counter-ions and also, their binary mixtures with different concentrations of sodium dodecyl sulfate (SDS). Using ILs with different alkyl chains and counterions, the effects of alkyl tail length and counterion on the inhibitor role of these selected ILs in corrosion processes were investigated. Techniques applied include the electrochemical measurements, atomic force microscopy (AFM), dynamic light scattering (DLS), Fourier transform infrared spectroscopy (FT-IR). Moreover, using density functional theory (DFT) calculations the structural and electronic characteristics of ILs have been developed to predict the anticorrosive capability of ILs with the QSAR approach. The main purpose of this research is to maximize the inhibitor adsorption onto mild steel while minimizing the aqueous inhibitor concentration by using ILs/SDS mixed systems. Moreover, the regular solution theory was used to predict the nature and strength of interactions between the surfactant and ionic liquid on the metal surface.


![[thin space (1/6-em)]](https://www.rsc.org/images/entities/char_2009.gif)
![[thin space (1/6-em)]](https://www.rsc.org/images/entities/char_2009.gif)

![[thin space (1/6-em)]](https://www.rsc.org/images/entities/char_2009.gif)
![[thin space (1/6-em)]](https://www.rsc.org/images/entities/char_2009.gif)
![[thin space (1/6-em)]](https://www.rsc.org/images/entities/char_2009.gif)
![[thin space (1/6-em)]](https://www.rsc.org/images/entities/char_2009.gif)
![[thin space (1/6-em)]](https://www.rsc.org/images/entities/char_2009.gif)
![[thin space (1/6-em)]](https://www.rsc.org/images/entities/char_2009.gif)


![[thin space (1/6-em)]](https://www.rsc.org/images/entities/char_2009.gif)


 .
.
![[thin space (1/6-em)]](https://www.rsc.org/images/entities/char_2009.gif)

![[double bond, length as m-dash]](https://www.rsc.org/images/entities/char_e001.gif) N stretching vibrations (1608 cm−1), a ring C–H stretching vibrations (3225, 3221 cm−1), methylene scissoring vibrational mode for SDS (1458 cm−1) and sulfate asymmetric and symmetric stretching bands at 956, 999 and 1151 cm−1. Therefore, the results give a clear picture of the chemical processes occurring on the surface when exposed to corrosive and ILs solutions.
N stretching vibrations (1608 cm−1), a ring C–H stretching vibrations (3225, 3221 cm−1), methylene scissoring vibrational mode for SDS (1458 cm−1) and sulfate asymmetric and symmetric stretching bands at 956, 999 and 1151 cm−1. Therefore, the results give a clear picture of the chemical processes occurring on the surface when exposed to corrosive and ILs solutions.


![[thin space (1/6-em)]](https://www.rsc.org/images/entities/char_2009.gif) ln(55.5Kads)
ln(55.5Kads) axes and 55.5 is the water molar concentration of the solution. A straight line was obtained on plotting
  vs. Cinh as shown in Fig. 13 which proposed that the adsorption of the inhibitors used from 2 M HCl solutions on mild steel follows Langmuir's adsorption isotherm.


