Solution blowing of activated carbon nanofibers for phenol adsorption

Xiaoxiao Tao, Guoqing Zhou, Xupin Zhuang*, Bowen Cheng*, Xiaojie Li and Hongjun Li
Key Laboratory of Advanced Textile Composite Materials of Ministry of Education, Tianjin Polytechnic University, Tianjin, P. R. China. E-mail: zhxupin@tjpu.edu.cn; bowen15@tjpu.edu.cn

Received 21st September 2014 , Accepted 11th December 2014

First published on 15th December 2014


Abstract

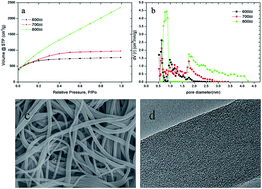
An activated carbon nanofiber (ACNF) with high surface area and excellent phenol adsorption capacity has been successfully fabricated by solution blowing of polyacrylonitrile (PAN) into precursor nanofiber which was subsequently activated to ACNF via KOH activation process. The effects of impregnation ratio and activation temperature on the texture properties of ACNF were discussed. The texture properties were characterized by N2 adsorption–desorption isotherm. ACNF showed high value of special surface area and pore volume (2921.263 m2 g−1 and 2.714 cm3 g−1, respectively). The ACNF samples were used for phenol adsorption from aqueous solutions. Adsorption isotherms at 38 °C were fitted with Langmuir and Freundlich models. The relationship between texture properties and phenol adsorption behavior was investigated. As a result, ACNF sample with large surface area, high micropore volume and pore size close and above to 0.43 nm showed the maximum phenol adsorption capacity of 251.6 mg g−1.


1. Introduction

Over the last few decades, the occurrence of micropollutants in the aquatic environment has become a worldwide issue of increasing environmental concern.1 Phenols are common micropollutants of high priority concerns since they are toxic even at low concentration and possibly accumulate in the environment.2,3

Currently, a variety of methods, such as solvent extraction, catalytic oxidation, adsorption, biodegradation, have been applied for the efficient removal of phenol from waste water.3,4 Among these methods, adsorption is regarded as the best for phenol removing due to its simple procedure and relatively low operation temperature.5 A preferred adsorbent, activated carbon (AC), is widely used for the removal of phenol from the aqueous phase. Recently, various types of ACs have been developed for the aqueous phase removal of phenol, including waste materials-derived activated carbon, carbon nanotubes and activated carbon fibers (ACFs) et al.6–9 Activated carbon nanofiber (ACNF), which is perhaps the most attracting class of AC, is well known for its highly developed porosity, large specific surface area, and abundant functional groups, as well as excellent chemical and thermal stability. These unique characteristics make it a good candidate for gas adsorption10,11 and water treatment.7,12 Up to now, various types of AC have been intensive studied for phenol adsorption. Nonylphenol ethoxylate adsorption on ordered mesoporous carbon was enhanced with increasing special surface area of pores larger than 1.5 nm.13 ACFs were used for effective adsorption of some substituted phenols.8 ACNFs with specific surface area of 1075 m2 g−1 also showed excellent phenol uptake of 377 mg g−1. Therefore, microporous ACNF of high surface areas and large pore volumes with suitable pore sizes have great potential in phenol adsorption.

Generally, there are two approaches to produce ACNF: vapor growth14 and electrospinning.15 Unlike catalytic synthesis, electrospinning precursor solution followed by stabilization and activation is a straightforward and convenient route to make continuous ACNFs. Usually, the precursor nanofibers are fabricated by electrospinning polymer solution of polyacrylonitrile (PAN)10 and phenolic resin.16 The property of ACNF depends on the property of the precursor fiber as well as on the conditions of activation. PAN as a carbon precursor has been widely used to fabricate ACNF, but the main disadvantage of PAN-based ACNF is relatively low specific surface area.16

At present, few literature can be find about fabrication of high surface area ACNF (>2000 m2 g−1), especially for PAN-based ACNF. Most of electrospinning PAN-based ACNFs present special surface area ranging 200–1500 m2 g−1.2,10,17–19 In this study, a new technology, solution blowing has been applied to fabricate PAN nanofiber, the precursor fiber. Unlike electrospinning using electrostatic force, this method uses high velocity airflow to attenuate polymer solution streams and collects the solidified nanofibers after solvent evaporation.20,21 The procedure has a fiber production rate several times higher than electrospinning and it is suitable for almost all kinds of polymer, especially for PAN, which cannot be molten.20 In our previous works, SiC nanofibers,20 PVDF nanofibrous membrane22 and ZnO/carbon composite nanofibers21 were successfully fabricated with high yield and high quality. Thus, solution blowing is expected to be a more efficient, energy saving and safer method for mass production of nanofibers, which is superior to electrospinning.22

Similar to fabrication of electrospinning ACNF, ACNF can be prepared by solution blowing PAN followed by a three-step process: stabilization and impregnation and activation. In this paper, high surface area ACNF has been successfully prepared to develop effective adsorbent for phenol. The solution blowing ACNF webs could be one kind of hierarchical mesh adsorbent with large number of micropores and a few mesopores and macropores. Specific surface area and pore volume of ACNF can be tuned by controlling activation conditions.

2. Experimental

2.1. Chemicals

PAN filaments (Mw ∼ 90[thin space (1/6-em)]000) were from Toray Industries (China) Co., Ltd. They were washed and dried before used. Dimethylformamide (DMF) and phenol were from Tianjin Guangfu regent company.

2.2. Synthesis

Fig. 1 showed the schematic of solution blowing apparatus, as our previous report.20 The PAN–DMF solution was fed into a 0.5 mm inner diameter needle and injected at 10 mL h−1 with a peristaltic pump. Then the polymer solution was attenuated by high velocity airflow and sprayed into nanofibers which were collected on nylon nets. To evaporate DMF, the as-spun nanofiber web was dried at room temperature under vacuum overnight for subsequent treatment.
image file: c4ra10897c-f1.tif
Fig. 1 Schematic of the solution blowing spinning process.

The PAN webs were stabilized under air atmosphere in a program controlled furnace and heated from room temperature to 200 °C at the rate of 5 °C min−1. The samples were held at 200 °C for 30 min and then heated to 260 °C at the rate of 2 °C min−1 and held for 60 min. Then the stabilized nanofibers were infiltrated with 1 M KOH for 12 h, at a series of impregnation ratio (KOH–PAN), and subsequently dried at 80 °C till constant weight. Then the dried webs were heated from room temperature to activation temperature (600, 700, 800 °C, respectively) at 5 °C min−1 and held for 30 min under N2 gas flow. Afterwards, the as-activated ACNF nonwoven fabric was rinsed with deionized water till the pH of filtrate was about 7. Finally, all the samples were dried under 110 °C overnight. Table 1 shows the experiment conditions for preparing ACNF.

Table 1 Experiment conditions for preparing ACNF
Designation of sample Impregnation ratio (KOH[thin space (1/6-em)]:[thin space (1/6-em)]PAN) Activation temperature (°C) Activation time (min)
800I 1[thin space (1/6-em)]:[thin space (1/6-em)]3 800 30
800II 1[thin space (1/6-em)]:[thin space (1/6-em)]1 800 30
800III 3[thin space (1/6-em)]:[thin space (1/6-em)]1 800 30
700III 3[thin space (1/6-em)]:[thin space (1/6-em)]1 700 30
600III 3[thin space (1/6-em)]:[thin space (1/6-em)]1 600 30


2.3. Characterization

The microstructure and surface morphologies of stabilized nanofiber and activated carbon nanofiber are observed by a field emission scanning electron microscope (FE-SEM) (S-4800, Hitachi co., Japan). The nitrogen adsorption–desorption, surface areas, pore volumes and pore size distribution were determined using a Quantachrome Nova 2020e analyzer. The pore size distribution was calculated by the density functional theory (DFT). The ACNF samples were separately degassed at 200 °C for 2 h before measurement.

2.4. Adsorption of phenol

To investigate the adsorption capacity of ACNF, a batch of phenol adsorption test was conducted. Stock solutions were prepared by dissolving phenol in deionized water. For each time, 0.05 g of ACNF was placed in a conical flask, which contains 100 mL phenol solution with different initial concentration. All conical flasks were placed in an air bath shaking table at 38 °C for 48 h with a fixed speed of 120 rpm. Then the conical flasks were taken out and the solid liquid mixtures were filtrated to separate ACNF webs and solution. The phenol concentration was measured with a UV-VIS spectrophotometer (UV-1800, MAPADA instrument). The phenol adsorption capacity Qe (mg g−1) was determined as the following formula
 
image file: c4ra10897c-t1.tif(1)
where C0 and Ce are the phenol concentration before and after 24 h batch adsorption respectively, V is the volume of aqueous solution containing phenol, and m is the mass of adsorbent.

Kinetic studies were performed following a similar procedure at 38 °C. The initial phenol concentration was set as 300 mg L−1. The uptake of the adsorbate at time t, Qt (mg L−1), was calculated by the following equation:

 
image file: c4ra10897c-t2.tif(2)
where Ct is the concentration of the adsorbate (mg L−1) in solution at time t. All the experiments were done in triplicate with deviations below 5% in all cases; reported data represent the average values.

3. Results and discussion

For the fabrication process, the texture properties and phenol adsorption property of ACNF are related to a number of parameters. In this paper, the effects of the parameters including impregnation ratio and activating temperature on the texture properties are discussed, followed by the relationship between texture properties and phenol adsorption.

3.1. Impregnation ratio

The weight ratio of KOH to PAN stabilized fiber web, namely impregnation ratio, has been found to be a crucial parameter in activation process.23,24 In this study, three level of impregnation ratio has been applied. Fig. 2a–d show the morphology of stabilized PAN nanofibers and ACNFs prepared with different impregnation ratio. It is observed that ACNFs presents a random arrangement. Activation treatment didn't change their morphology obviously. These activated fibers were continuous and uniform with the fiber diameter ranging 200–500 nm. The TEM images of 800III (Fig. 2d and e) clearly indicated that KOH activation process at high temperature lead to mesopores around 2 nm. The mesopores are highly unified and equally distributed. The N2 adsorption isotherm of ACNF and the pore size distribution based on DFT model are present in Fig. 3. The isotherm of 800I and 800II are similar and may be considered as type I of IUPAC classification, characterized of a sharp rise at low pressure (0–0.1) and a plateau at high pressure range, indicating the predominance of microporosity.8 At relative pressure close to zero, the sharp vertical part of 800II is 405 cm3 g−1 while the 800I is 262 cm3 g−1, indicating the microporosity of 800II is higher than 800I. As the impregnation ratio increase from 1[thin space (1/6-em)]:[thin space (1/6-em)]3 to 1[thin space (1/6-em)]:[thin space (1/6-em)]1, the knee of isotherms became wider, followed by less broad plateau, indicating wider distribution of pore sizes. The isotherm of 800III shows no plateau at high relative pressures, meaning 800III may possess a kind of hierarchical pore size. As shown in Fig. 3b, pore size distribution became wide and complex with increasing impregnation ratio. The pore size distribution curve of 800I demonstrates that the distribution is quite narrow and pore size is centered at about 0.61 nm. 800III exhibits a complex pore system consisting of not only the particular pores around 0.8 nm but also a large number of other pores ranging from 1.8 to 4 nm. These sequential mesopore channels lead to reversible N2 adsorption and desorption. The textural properties, including BET, total pore volume, micropore volume and mesopore volume are list in Table 2.
image file: c4ra10897c-f2.tif
Fig. 2 SEM images of (a) stabilized PAN nanofiber, (b) 800I, (c) 800II, (d) 800III, (e) TEM image of 800III, (f) magnification of e.

image file: c4ra10897c-f3.tif
Fig. 3 (a) N2 adsorption–desorption isotherms of 800I and 800II and 800III, (b) pore size distribution of 800I and 800II and 800III calculated by DFT.
Table 2 Texture property of ACNF fabricated with different impregnation ratio
Sample BET (m2 g−1) Vtotal (cm3 g−1) Vmicro (cm3 g−1) Vmeso (cm3 g−1) Daverage (nm)
800I 1260.018 0.504 0.504 0 0.610
800II 2662 1.441 1.3873 0.0637 0.6365
800III 2921.263 2.714 1.3171 1.3966 0.848


Inspection of Fig. 3b and Table 2 show the following: (i) the BET surface area increased considerably to 2662 m2 g−1 and micropore volume multiplied when the impregnation ratio increased from 1[thin space (1/6-em)]:[thin space (1/6-em)]3 to 1[thin space (1/6-em)]:[thin space (1/6-em)]1. Because increasing impregnation ratio is associated with a progressive development in micropore structure when the content of KOH is not sufficient. (ii) The increase of impregnation ratio from 1[thin space (1/6-em)]:[thin space (1/6-em)]1 to 3[thin space (1/6-em)]:[thin space (1/6-em)]1 resulted in a little change in BET and micropore volume, but a remarkable improved mesopore volume. These were generally attributed to further activation, which broadened part of micropores into mesopores and expanded mesopores sizes.24 It is well-known that the removal of the chemicals left in the carbonized sample by washing will increase the porosity in the carbon structure, and the distribution of these chemicals in the precursor prior to carbonization governs the pore size distribution in the final products.25 (iii) In first stage, KOH activation created a large amount of micropores up to micropore volume of 1.38 cm3 g−1. Next, activation kept generating micropores and expanded some of them to mesopores. Therefore, pore structure of ACNF can be manipulated by controlling the content of KOH, especially for micropores. Severer activation conditions, namely high impregnation ratio here introduced mixed micropores and mesopores, which would decrease the homogeneity. In this paper, ACNF samples with three different pore structures and surface area have been fabricated, namely 800I with micropore only, 800II with majority of micropore and a few mesopores, 800III with nearly half micropores and half mesopores.

3.2 Activating temperature

N2 adsorption–desorption isotherms of 600III and 700III and 800III and pore size distribution of the three samples calculated by DFT are presented in Fig. 4. It is evident that the isotherm of 600III and 700III are type I isotherm in Fig. 4a. These three ACNFs adsorbed nitrogen at low relative pressure, which indicated that the samples had well developed micropores. As activation temperature rise from 600 to 800 °C, the volume at low relative pressure changed a little, but the plateau at high relative pressure narrowed down in sequence. The results were consistent with pore size distribution from Fig. 4b. The micropores of the three samples were fully developed, while the size of pores became larger. It can be observed that the amount of micropores stayed the same but mesopores increased significantly. In other word, on the condition that impregnation ratio was as high as 3[thin space (1/6-em)]:[thin space (1/6-em)]1, the mesopore growth was depending on activating temperature. Higher activating temperature resulted in larger pore size. Table 3 demonstrated the texture properties of 600III–800III. The increase of activation temperature from 600 to 800 °C was associated with a progressive development in mesopore volume and the total pore volume and special surface area, while micropore volume improved slightly from 1.0835 cm3 g−1 to 1.3171 cm3 g−1. Hence, under a fixed impregnation ratio of 3[thin space (1/6-em)]:[thin space (1/6-em)]1, the mesopore structure of ACNF can be tunable by changing activation temperature. In this work, high surface area ACNFs above 2300 m2 g−1 have been successfully prepared, with tunable mesopore volume.
image file: c4ra10897c-f4.tif
Fig. 4 (a) N2 adsorption–desorption isotherms of 600III and 700III and 800III, (b) pore size distribution of 600III and 700III and 800III.
Table 3 Texture property of ACNF fabricated with different activation temperature
Sample BET (m2 g−1) Vtotal (cm3 g−1) Vmicro (cm3 g−1) Vmeso (cm3 g−1) Daverage (nm)
600III 2315.823 1.113 1.0835 0.029 0.636
700III 2583 1.437 1.225 0.212 1.437
800III 2921.263 2.714 1.3171 1.3966 0.848


3.3. Relationship between texture property and phenol adsorption

3.3.1. Adsorption isotherms. Besides pore size and surface area, the structural match between adsorbent and adsorbate also affects the adsorption amount.26 The molecules with a suitable size would be adsorbed more favorably since they have more contact sites with carbon surface.8 It is important that the available pore size is larger than the cross section distance of adsorbate, since adsorption is possible only in those pores which can be entered by adsorbate molecules. The smallest cross-section distance for phenol in aqueous solution is 0.43 nm (ref. 27) and promising pore size of adsorbent should be slightly larger but closed to 0.43 nm.2 The ACNFs have five different types of pore size distribution and pore volume as Tables 3 and 4 show. The micropore volume follows the order: 800III > 800II > 700III > 600III > 800I. Among them, 800I, 800II and 600I have micropore size that closer to cross-section distance of phenol (0.43 nm), while 800III and 700III show larger pore size. Compared all ACNFs, 800I has the most narrow micropore size distribution, the order followed by 600III, 800II, 700III, 800III.
Table 4 Isotherms constants for adsorption of phenol on ACNF at 38 °C
Sample Langmuir Freudlich
KL (L mg−1) Q0 (mg g−1) R2 n KF (mg g−1)(mg L−1)n R2
800I 0.082 203.37 0.95 3.06 42.48 0.99
800II 0.097 190.65 0.95 2.94 39.44 0.96
800III 0.153 119.01 0.89 3.38 32.94 0.98
700III 0.095 187.072 0.96 3.2 42.9 0.97
600III 0.106 251.60 0.96 2.83 52.51 0.98


Adsorption isotherm is important to describe the interaction between solute and adsorbents. Herein, two widely used phenomenological equations were applied to fit the equilibrium data, namely Langmuir and Freundlich equations.

Langmuir isotherm model assumes that a maximum limiting uptake exists, corresponding to a saturated monolayer of adsorbate molecules at the adsorbent surface and adsorption process will only take place at specific homogenous site.28 The Langmuir equation is given by:

 
image file: c4ra10897c-t3.tif(3)
where Qe (mg g−1) is the amount of adsorbed phenol, and Ce (mg L−1) is the residual concentration of solution at equilibrium. Q0 is the maximal adsorption capacity, and KL is a constant related to the affinity of binding sites.

Freundlich isotherm model is an empirical equation assuming that adsorption occurs on a heterogeneous surface through a multilayer adsorption mechanism, and the adsorbed amount increases with the concentration.29 Freundlich equation is given by

 
Qe = KF × Ce1/n (4)
where KF is a constant represents adsorption capacity (mg g−1 (mg L−1)n), n is the empirical parameter representing the energetic heterogeneity of the adsorption sites.

The adsorption isotherms of phenol on ACNFs at 38 °C were presented in Fig. 5a–(e): (a) 800I, (b) 800II, (c) 800III, (d) 700III, (e) 600III. All of them were fitted by the three models cited above. All curves rise quickly at low concentration and gradually approach a plateau at high concentration. Compared to others, 800I, 800II and 600III demonstrate more intense adsorption capacity at low concentration, which should attribute to their micropore size around 0.6 nm, closer enough to the cross-section distance of phenol. When it comes to high concentration, 600III presents the highest adsorption capacity, followed by 800I and 800II.


image file: c4ra10897c-f5.tif
Fig. 5 Phenol adsorption isotherms of (a) 800I (b) 800II (c) 800III (d) 700III (e) 600III.

The result fitting parameters were calculated and summarized in Table 4. The values of Q0 are found to vary between 119 and 251 mg g−1 for 800III and 600III, respectively. The goodness of the fit is characterized by the value of R2. The Freundlich equations fit all the fifth samples well with coefficients (R2) in the range of 0.96–0.99 (Table 4), while Langmuir model is usable for 800I, 800II, 600III and 700III but not for 800III (RL = 0.89). Therefore, the Freundlich model is reasonably applied in all cases. This phenomenon illustrated that 800III has heterogeneous adsorbent surface more than homogeneous and other ACNFs possess both mono and heterolayers.28

Though the Langmuir equation is not the best to describe the isotherms, the parameter Q0 is often considered as the adsorption capacity. The comparison of different ACNFs shows the following adsorption order: 600III > 800I, 700III, 800II > 800III. The similar sequence can be found from the value of KF. Adsorption is considered as satisfactory when the Freundlich constant n takes values within the range 1–10, meanwhile indicating favorable adsorption of phenol.29 Although 800I has the most narrow micropore distribution and proper pore size, its adsorption ability at high concentration was limited by its relatively low pore volume. In general, from the aspect of micropore volume and pore size distribution, 600III shows the best adsorption behavior at both low and high concentration. In summary, the texture property of ACNF controlled the adsorption behavior. As for phenol adsorption, idea adsorbent should have high micropore volume, narrow micropore distribution, pore size above and close to 0.43 nm. Here, the 600III meet with all the above features perfectly, indicating 600III can be excellent adsorbent for phenol. The phenol adsorption capacity of 600III is 251.6 mg g−1, which is higher than ACF (200 mg g−1)7 and aminated AC (243.47 mg g−1).30 Although ACNF became brittle to handle after activation, compared with AC, ACNF still maintained fiber web form and is facile for application.

3.3.2. Kinetics studies. In order to further learn the adsorption behavior of these ACNF samples, kinetics of two typical samples (600III and 800III) were investigated. Fig. 6 shows the plots of adsorption amount versus time. As can be seen, the ACNF shows fast adsorption behavior and curves reached rapidly to a plateau. It just takes 30 min to reach 90% of the total amount. Due to the open pore structure of ACNF, the diffusion resistance is reduced to a large extent.31 Besides, the nonwoven fibrous form of ACNF also contributes to the fast adsorption kinetics, which helps to reduce the external mass transfer resistance.8,32
image file: c4ra10897c-f6.tif
Fig. 6 Adsorption kinetics of phenol on ACNF: 38 °C, initial concentration 300 mg L−1.

In the present work, the pseudo-first-order, pseudo-second-order models were used to investigate the adsorption of phenol.

The pseudo-first-order model can be expressed as:

 
ln(QeQt) = ln[thin space (1/6-em)]Qek1t (5)
where k1 is the first-order rate constant, Qe and Qt (mg g−1) are the amount of phenol adsorbed at equilibrium and at any time, respectively.

The pseudo-second-order model can be expressed as:

 
image file: c4ra10897c-t4.tif(6)
where k2 is the second-order model constant.

The fitting constants of two models are listed in Table 5. The pseudo-first-order model gives poor fitting with low R2 values and notable deviations between the experimental and theoretical uptakes. The pseudo-second-order model fits the data well for the adsorption of both 600III and 800III, the R2 values are close to unity and the experimental and theoretical uptakes are in good agreement. Recently, some studies8,33 stated that the pseudo-second-order was suitable for the adsorption of lower molecular weight adsorbates on smaller adsorbent particles, which could explain for its applicability in this study. Thus, it can be assumed that the pseudo-second-order adsorption mechanism was predominant in the adsorption of phenol on ACNF.

Table 5 Pseudo-first-order and pseudo-second-order constants for the adsorption of phenol on ACNF at 38 °C
Samples Qexpa (mg g−1) Pseudo-first order Pseudo-second order
Qe (mg g−1) k1 (min−1) R2 Qe (mg g−1) k2 (g mg−1 min) R2
a Experimental uptakes, obtained after 48 h.
600III 266 260.9 0.46 0.6 266.1 0.0057 0.95
800III 258.6 257.6 0.64 0.89 259.37 0.017 0.97


4. Conclusions

To sum up, a combined process of novel spinning and KOH activation is presented to fabricate ACNF for the phenol adsorption. The distinct ratio of impregnation and activation temperature influenced the texture property of ACNF, which lead to different adsorption behavior of phenol. The adsorption capability turned out to be a combined effect of special surface area, pore volume and pore size distribution. All the synthesized ACNF samples show excellent phenol adsorption capacity. The maximum surface area and pore volume are 2921.263 m2 g−1 and 2.714 cm3 g−1 for 800III, respectively, which are larger than most of activated carbon nanofiber. The N2 adsorption–desorption isotherms showed that high impregnation ratio (KOH[thin space (1/6-em)]:[thin space (1/6-em)]PAN = 3[thin space (1/6-em)]:[thin space (1/6-em)]1) led to high surface area. DFT and pore size distribution results confirmed that activation temperature has a significant effect on mesopore volume. The phenol adsorption capacity displays a good correlation between micropore volume and pore size distribution of ACNF samples using Langmuir and Freundlich model. The maximum phenol adsorption capacity is 251 mg g−1 at 38 °C. In kinetic studies, ACNF show high adsorption rate due to their open pore structure. The pseudo-second-order model gives satisfactory fitting. The fabricated ACNF could be considered as a good candidate for elimination of micropollutants from wastewater. This study provides a facile route for the synthesis of ACNFs.

Acknowledgements

The author would like to thank National Natural Science Foundation of China (51103104 and 51173131), Tianjin Natural Science Foundation (13JCZDJC32600) and Technology program of Tianjin Municipal Education Commission (20130324) for their financial support.

References

  1. Y. L. Luo, W. S. Guo, H. H. Ngo, L. D. Nghiem, F. I. Hai, J. Zhang, S. Liang and X. C. C. Wang, Sci. Total Environ., 2014, 473, 619–641 CrossRef PubMed.
  2. Y. Yang, Z. Mei-Hua, X. Gang and J. Zheng-Xiong, J. Porous Mater., 2010, 18, 379–387 CrossRef.
  3. S. H. Lin and R. S. Juang, J. Environ. Manage., 2009, 90, 1336–1349 CrossRef CAS PubMed.
  4. C. Y. Su, Y. F. Tong, M. Y. Zhang, Y. Zhang and C. L. Shao, RSC Adv., 2013, 3, 7503–7512 RSC.
  5. E. Haque, J. W. Jun, S. N. Talapaneni, A. Vinu and S. H. Jhung, J. Mater. Chem., 2010, 20, 10801 RSC.
  6. V. K. Gupta, A. Nayak, S. Agarwal and I. Tyagi, J. Colloid Interface Sci., 2014, 417, 420–430 CrossRef CAS PubMed.
  7. A. Chakraborty, D. Deva, A. Sharma and N. Verma, J. Colloid Interface Sci., 2011, 359, 228–239 CrossRef CAS PubMed.
  8. Q.-S. Liu, T. Zheng, P. Wang, J.-P. Jiang and N. Li, Chem. Eng. J., 2010, 157, 348–356 CrossRef CAS PubMed.
  9. J. M. Dias, M. C. Alvim-Ferraz, M. F. Almeida, J. Rivera-Utrilla and M. Sanchez-Polo, J. Environ. Manage., 2007, 85, 833–846 CrossRef CAS PubMed.
  10. K. J. Lee, N. Shiratori, G. H. Lee, J. Miyawaki, I. Mochida, S.-H. Yoon and J. Jang, Carbon, 2010, 48, 4248–4255 CrossRef CAS PubMed.
  11. G. Y. Oh, Y. W. Ju, M. Y. Kim, H. R. Jung, H. J. Kim and W. J. Lee, Sci. Total Environ., 2008, 393, 341–347 CrossRef CAS PubMed.
  12. M. Teng, J. Qiao, F. Li and P. K. Bera, Carbon, 2012, 50, 2877–2886 CrossRef CAS PubMed.
  13. X. Yuan, W. Xing, S. P. Zhuo, W. J. Si, X. L. Gao, Z. H. Han and Z. F. Yan, J. Colloid Interface Sci., 2008, 322, 558–565 CrossRef CAS PubMed.
  14. R. R. Bacsa, C. Laurent, A. Peigney, W. S. Bacsa, T. Vaugien and A. Rousset, Chem. Phys. Lett., 2000, 323, 566–571 CrossRef CAS.
  15. L. F. Zhang, A. Aboagye, A. Kelkar, C. L. Lai and H. Fong, J. Mater. Sci., 2014, 49, 463–480 CrossRef CAS.
  16. Y. Bai, Z.-H. Huang and F. Kang, Carbon, 2014, 66, 705–712 CrossRef CAS PubMed.
  17. S. S. Manickam, U. Karra, L. Huang, N.-N. Bui, B. Li and J. R. McCutcheon, Carbon, 2013, 53, 19–28 CrossRef CAS PubMed.
  18. C.-I. Su, Y.-X. Huang, J.-W. Wong, C.-H. Lu and C.-M. Wang, Fibers Polym., 2012, 13, 436–442 CrossRef CAS.
  19. G. Wang, C. Pan, L. Wang, Q. Dong, C. Yu, Z. Zhao and J. Qiu, Electrochim. Acta, 2012, 69, 65–70 CrossRef CAS PubMed.
  20. G. Yan, X. Zhuang, X. Tao and B. Cheng, Sci. Adv. Mater., 2013, 5, 209–215 CrossRef CAS PubMed.
  21. S. Shi, X. Zhuang, B. Cheng and X. Wang, J. Mater. Chem. A, 2013, 1, 13779 CAS.
  22. X. Zhuang, L. Shi, K. Jia, B. Cheng and W. Kang, J. Membr. Sci., 2013, 429, 66–70 CrossRef CAS PubMed.
  23. S.-H. Yoon, S. Lim, Y. Song, Y. Ota, W. Qiao, A. Tanaka and I. Mochida, Carbon, 2004, 42, 1723–1729 CrossRef CAS PubMed.
  24. M. Wu, Q. Zha, J. Qiu, Y. Guo, H. Shang and A. Yuan, Carbon, 2004, 42, 205–210 CrossRef CAS PubMed.
  25. A.-N. A. El-Hendawy, Appl. Surf. Sci., 2009, 255, 3723–3730 CrossRef CAS PubMed.
  26. Y. Dong, H. Lin, Q. Jin, L. Li, D. Wang, D. Zhou and F. Qu, J. Mater. Chem. A, 2013, 1, 7391 CAS.
  27. H.-T. Shu, D. Li, A. A. Scala and Y. H. Ma, Sep. Purif. Technol., 1997, 11, 27–36 CrossRef CAS.
  28. M. Hofman and R. Pietrzak, Sci. World J., 2012, 2012, 297654 Search PubMed.
  29. V. Fierro, V. Torné-Fernández, D. Montané and A. Celzard, Microporous Mesoporous Mater., 2008, 111, 276–284 CrossRef CAS PubMed.
  30. G. Yang, H. Chen, H. Qin and Y. Feng, Appl. Surf. Sci., 2014, 293, 299–305 CrossRef CAS PubMed.
  31. C. Moreno-Castilla, Carbon, 2004, 42, 83–94 CrossRef CAS PubMed.
  32. M. A. Fontecha-Camara, M. V. Lopez-Ramon, M. A. Alvarez-Merino and C. Moreno-Castilla, Langmuir, 2006, 22, 9586–9590 CrossRef CAS PubMed.
  33. F. C. Wu, R. L. Tseng, S. C. Huang and R. S. Juang, Chem. Eng. J., 2009, 151, 1–9 CrossRef CAS PubMed.

This journal is © The Royal Society of Chemistry 2015
Click here to see how this site uses Cookies. View our privacy policy here.