Li Yina,
Deliang Chen*a,
Mengjie Fenga,
Lianfang Gea,
Dewei Yanga,
Zhanhong Songb,
Bingbing Fana,
Rui Zhang*ac and
Guosheng Shaoad
aSchool of Materials Science and Engineering, Zhengzhou University, 100 Science Road, Zhengzhou 450001, P.R.China. E-mail: dlchen@zzu.edu.cn
bZhengzhou Foreign Language School, 6 Fengyang Street, Zhengzhou 450000, P.R.China
cLaboratory of Aeronautical Composites, Zhengzhou Institute of Aeronautical Industry Management, University Centre, Zhengdong New District, Zhengzhou 450046, P.R.China. E-mail: zhangray@zzu.edu.cn; Fax: +86-371-67781593; Tel: +86-371-67781046
dInstitute for Renewable Energy and Environmental Technology, University of Bolton, Bolton BL3 5AB, UK
First published on 18th November 2014
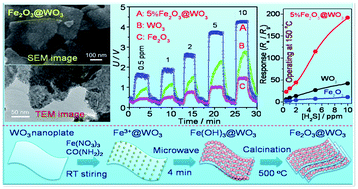
Hierarchical Fe2O3@WO3 nanocomposites with ultrahigh specific areas, consisting of Fe2O3 nanoparticles (NPs) and single-crystal WO3 nanoplates, were synthesized via a microwave-heating (MH) in situ growth process. WO3 nanoplates were derived by an intercalation and topochemical-conversion route, and the Fe2O3 NPs were in situ grown on the WO3 surfaces via a heterogamous nucleation. The water-bath-heating (WH) process was also developed to synthesize a Fe2O3@WO3 nanocomposite for comparison purposes. The techniques of X-ray diffraction (XRD), X-ray photoelectron spectrum (XPS), scanning electron microscopy (SEM) and transmission electron microscopy (TEM) were used to characterize the samples obtained. The results show that α-Fe2O3 NPs with a size range of 5–10 nm are uniformly, tightly anchored on the surfaces of WO3 nanoplates in the Fe2O3@WO3 samples obtained via the MH process, whereas the α-Fe2O3 NPs are not uniform in particle-sizes and spatial distribution in the Fe2O3@WO3 samples obtained via the WH process. The BET surface area of the 5wt%Fe2O3@WO3 sample derived by the MH process is as high as 1207 m2 g−1, 5.9 times higher than that (203 m2 g−1) of the corresponding WO3 nanoplates. The dramatic enhancement in the specific surface area of the Fe2O3@WO3 samples should be attributed to the hierarchical microstructure, which makes the internal surfaces or interfaces in aggregated polycrystals be fully outside surfaces via a house-of-cards configuration, where the single-layered and disconnected Fe2O3 NPs are tightly anchored on the surfaces of the WO3 nanoplates. The gas-sensing properties of the Fe2O3@WO3 sensors were investigated. The gas-sensors based on the Fe2O3@WO3 obtained via the MH process show a high response and selectivity to H2S at low operating temperatures. The 5%Fe2O3@WO3 sample shows the highest H2S-sensing response at 150 °C. Its response to 10 ppm H2S is as high as 192, 4 times higher than that of the WO3-nanoplate sensor. The improvement in the gas-sensing performance of the Fe2O3@WO3 nanocomposites can be attributed to the synergistic effect in compositions and the hierarchical microstructures with ultrahigh specific surface areas.
Tungsten trioxide (WO3), an n-type semiconductor with band gaps of ∼2.7 eV, has been extensively studied as gas-sensing materials because of its high response to various gases.11–16 Several WO3-based binary oxide composites such as WO3/ZnO,17 NiO/WO3,18 CuO/WO3 (ref. 19) and SnO2/WO3,20 have been reported as high-performance gas sensors. The plate-like heterogeneous NiO/WO3 nanocomposites were synthesized by annealing Ni(OH)2 and H2WO4 nanoplates in air and their gas-sensing sensitivity towards NO2 were enhanced due to their p–n heterogeneous characteristics.18 Kida et al.20 introduced SnO2 nanoparticles into WO3 lamella-based films obtained by mixing two suspensions containing WO3·nH2O and SnO2 nanoparticles, and the enhanced gas-sensing response is owe to the porosity improvement. But unfortunately, the control in microstructure and distribution of the second phase is always extremely difficult by the RF sputtering technique19 or simply mixing their precursors.18,20 As a result, the advantages of potential high surface areas cannot be fully embodied in practical applications. Simple and efficient methods are urgent for the construction of WO3-based binary oxide heterostructures. Recently, microwave-assisted techniques have been used to synthesize inorganic materials for the potentials in controlling microstructures and morphology due to the selective absorption of microwave energy.21
Hematite (α-Fe2O3), with a band gap of 2.0–2.2 eV, is suitable to implement a host/guest n/n junction architecture with WO3.22 The scaffold host material of WO3 has a larger band gap than α-Fe2O3, and the conduction band of WO3 is lower in energy than that of α-Fe2O3, allowing efficient electron transport across the host/guest interface. Fe2O3/WO3 nanocomposites have been fabricated and used as nano-electrodes,23 water splitting22,24 and visible-light-driven photocatalysis.25 The α-Fe2O3 nanocrystals has also been investigated as a promising gas-sensing material especially for H2S detection.26–31 Thus, the combination of WO3 and α-Fe2O3 is expected to be an efficient gas-sensing system for H2S-detection. However, to our best knowledge, the investigation on α-Fe2O3/WO3 nanocomposites for gas-sensing application has not been reported to date.
In this paper, we develop a simple microwave-assisted process to fabricate uniform-distributed α-Fe2O3 nanoparticles (NPs) on WO3 nanoplates, forming Fe2O3@WO3 nanocomposites with ultrahigh surface areas that are highly sensitive to H2S gas. The two-dimensional WO3 nanoplates are synthesized via a robust intercalation and topochemical conversion route.32 Furthermore, the as-obtained WO3 nanoplates have a high diameter-to-thickness ratio and single-crystalline structure, which is suitable as an efficient substrate to construct hierarchical nanocomposites.33 The Fe2O3 NPs are in situ formed on the surfaces of WO3 nanoplates via the microwave heating followed by calcination. Using the above WO3 nanoplates as the substrate, the α-Fe2O3 NPs are uniform anchored on their surfaces to form hierarchical Fe2O3@WO3 nanostructures. The hierarchical Fe2O3@WO3 nanostructures not only prevent the aggregation of the α-Fe2O3 NPs, but also provide efficient diffusion paths and adsorption sites for gas molecules because of their ultrahigh surface areas.
The simple microwave heating process developed here offers several advantages: fast synthesis and no high pressure. The WO3 nanoplate is kept stable during the fast synthesis by avoiding dissolution in alkaline conditions. In addition, the microwave process may promote the heterogeneous nucleation of Fe(OH)3 NPs on the surfaces of WO3 nanoplates due to selective absorption of microwave energy, leading to an uniformly distributed α-Fe2O3 NPs. The gas-sensing properties of the as-obtained Fe2O3@WO3 nanomaterials are comparatively evaluated with an emphasis on H2S-sensing detection. The effects of α-Fe2O3 amounts, operating temperatures on H2S-sensing properties, and the related mechanisms are carefully investigated.
A sensor (R) was connected with a standard resistor (R0) in series, and the total voltage (U0) applied on the sensor and standard resistor was fixed to 5 V. The WS-30A system measured the voltage (U) loaded on the standard resistor (R0), and the resistance (R) of the Fe2O3–WO3 sensor were calculated according to R = (5 − U) × R0/U.12 The sensor response (S) of a sensor based on an n-type semiconductor was defined as S = Ra/Rg for reducing gases and S = Rg/Ra for oxidizing gases, where Ra and Rg were the resistances of the sensor in air and in target gas, respectively. The response (or recovery) time was defined as the time in which the sensor reached 90% of the saturated signal upon exposure to (or removing) the target gas.33,35
CO(NH2)2 + 3H2O → 2NH4+ + 2OH− + CO2↑ | (1) |
Fe3+@plate-WO3 + 3OH− → Fe(OH)3@plate-WO3 | (2) |
2Fe(OH)3@plate-WO3 → Fe2O3@plate-WO3 + 3H2O | (3) |
![]() | ||
Scheme 1 Schematic illustration of the microwave-heating (MH) synthesis of the hierarchical Fe2O3@WO3 nanocomposites with ultrahigh specific surface areas. |
Fig. 1 shows the typical XRD patterns of WO3 nanoplates, α-Fe2O3 nanocrystals and 5%Fe2O3@WO3 nanocomposite. Fig. 1a shows a XRD pattern of the pure Fe2O3 sample. The major peaks can be readily indexed to the (012), (104), (110), (113), (024), (116) and (214) reflections of the rhombohedral α-Fe2O3 phase (JCPDS card no. 33-0664). Fig. 1c shows a typical XRD pattern of the WO3 nanoplates, and it can be readily indexed to a triclinic WO3 phase according to the literature (JCPDS card no. 32-1395). Fig. 1b shows the XRD pattern of the 5%Fe2O3@WO3 nanocomposite. The major peaks of the Fe2O3@WO3 sample are similar to the those of WO3 nanoplates, and the weak peak at around 33.1° in 2θ can correspond to the (104) plane of α-Fe2O3 phase. The weakened peaks of α-Fe2O3 phase in Fig. 1b are mainly because of the lower content of α-Fe2O3 in the Fe2O3@WO3 nanocomposite.
![]() | ||
Fig. 1 Typical XRD patterns of (a) α-Fe2O3 nanoparticles obtained by the hydrothermal process, (b) 5%Fe2O3@WO3 nanocomposite obtained by the MH process, and (c) WO3 nanoplates. |
The morphologies and microstructures of WO3 nanoplates, Fe2O3 nanocrystals and 5%Fe2O3@WO3 nanocomposite were characterized using SEM and TEM techniques. Fig. 2 shows the typical SEM and TEM images of the samples. Fig. 2a gives the SEM image of WO3 nanoplates with dimensions of 100–700 nm in lateral size and 10–30 nm in thickness, which is similar to our precious report.32 It needs to be noted that the surfaces of the pure WO3 nanoplates are smooth, and the small particles are sparse. Fig. 2b shows the SEM image of α-Fe2O3 sample, and the pure α-Fe2O3 sample consists of particulate nanocrystals with a mean size of about 30 nm.
Fig. 2c shows a typical SEM image of the 5%Fe2O3@WO3 sample. One can see that the α-Fe2O3 NPs with a mean size of about 9 nm are uniformly immobilized on the surfaces of WO3 nanoplates. Fig. 2d presents the energy dispersive X-ray spectroscopy (EDS) spectrum of the 5%Fe2O3@WO3 nanocomposite, and the elements of W, Fe and O are detected in the sample. Fig. 2e show the typical low-magnification TEM image of the 5%Fe2O3@WO3 nanostructure. One can further confirmed that the α-Fe2O3 NPs with a size range of 5–10 nm are uniformly and tightly immobilized on the surfaces of WO3 nanoplates, similar to the SEM observation. Fig. 2f shows the high resolution TEM (HRTEM) image. The lattice fringes with a crystalline interplanar spacing of 0.376 nm can be attributed to the (020) plane of the WO3 phase, and the lattice fringes with a crystalline interplanar spacing of 0.27 nm should be attributed to the (104) planes of the α-Fe2O3 phase. The corresponding two-dimensional fast Fourier transforms (FFT) of the lattice image given in the inset of Fig. 2f corroborate the co-existence of WO3 and α-Fe2O3 phases. It should be emphasized that the α-Fe2O3 NPs are tightly anchored on the surfaces and edges of WO3 nanoplates, and no discrete α-Fe2O3 NPs are found in the large TEM observation field. From the SEM and TEM images, one sees that the α-Fe2O3 NPs with very small sizes are not aggregated because of the support effect of WO3 nanoplates, suggesting that the hierarchical nanostructures derived from zero-dimensional nanoparticle and two-dimensional nanoplates can be an ideal configuration to prevent the small nanoparticles from aggregation.
The microstructures of the Fe2O3@WO3 composites were also characterized using the Brunauer–Emmett–Teller (BET) nitrogen sorption-desorption measurement. Fig. 3 shows the typical N2 adsorption–desorption isotherms and the BJH pore-size distribution curves of the 5%Fe2O3@WO3 composite and the support of WO3 nanoplates. One can find both the WO3 nanoplates (Fig. 3a) and the 5%Fe2O3@WO3 composite (Fig. 3b) show a similar type II isotherm with no obvious hysteresis, and there are no obvious peaks in the pore-size distribution curves (insets in Fig. 3a and b). According to the above BET results, the WO3 nanoplates and the 5%Fe2O3@WO3 composite are of a non-porous structure.36 The BET specific surface area of the WO3 nanoplates is 203 m2 g−1, similar to our previous report.32 The introduction of a small amount of α-Fe2O3 NPs on WO3 nanoplates using the MH process highly enhances the BET specific surface areas. For example, the 5%Fe2O3@WO3 composite has a BET specific surface area as high as 1207 m2 g−1, which is 5.9 times higher than that of the corresponding WO3 nanoplates. To the best of our knowledge, it is possibly the highest value in BET surface areas for a non-porous metal oxide material. Taking the SEM and TEM observations into account, the dramatic enhancement in the specific surface area of the Fe2O3@WO3 samples should be attributed to the hierarchical microstructure, which makes the internal surfaces or interfaces in aggregated particles fully be outside surfaces via a house-of-cards configuration, where the single-layered and disconnected α-Fe2O3 NPs (several nanometers in size) are tightly anchored on the surfaces of the ultrathin WO3 nanoplates.
Elemental compositions and chemical states of the hierarchical Fe2O3@WO3 nanocomposites were analyzed using the XPS technique. Fig. 4 shows the typical XPS spectra of the 5%Fe2O3@WO3 nanocomposite. A survey spectrum shown in Fig. 4a confirms that there are 4 elements of W, Fe, O and C detected. The elements of W, Fe and O should belong to the Fe2O3@WO3 sample, and the C species is due to the carbon tape used to attach the sample powders during the XPS measurement. Fig. 4b shows the W 4f spectrum, which has two peaks at 35.4 eV and 37.5 eV, corresponding to the W4f7/2 and W4f5/2 of the crystalline WO3 species, respectively.28 Fig. 4c shows the Fe 2p spectrum, and there are two peaks at 711.2 and 725.3 eV, belonging to Fe 2p3/2 and Fe 2p1/2 of α-Fe2O3, respectively.37 The O 1s spectrum in Fig. 4d shows a wide peak with a large hump on the high-energy side, and the wide peak can be fitted to be three sub-peaks at 530.4, 532.2 and 533.4 eV. The intense peak at 530.4 eV can be assigned to the lattice oxygen in the crystalline WO3 and α-Fe2O3 species. The peak at 532.2 eV may be due to the oxygen ions (O2−, O−and O2−) adsorbed on the surfaces of the hierarchical Fe2O3@WO3 nanostructure, whereas the peak at 533.4 eV is usually ascribed to the adsorbed H2O molecules.38,39 The intense intensities of the O 1 s XPS peaks at 532.2 and 533.4 eV suggest that there is a large amount of adsorbed oxygen and H2O molecules on the surfaces of the Fe2O3@WO3 nanocomposite because of its ultrahigh BET specific surface area (1207 m2 g−1).
![]() | ||
Fig. 4 XPS spectra of the 5%Fe2O3@WO3 nanocomposite obtained by microwave-heating process: (a) a survey scan, (b) W 4f, (c) Fe 2p and (d) O1s. |
Efficient control in particle sizes and location distribution of a second phase is very important in the construction of hierarchical nanostructures. In the present Fe2O3@WO3 system synthesized via the MH process, the particle sizes and number density of the α-Fe2O3 NPs anchored on the surfaces of WO3 nanoplates can be readily adjusted by changing the Fe-ion concentration in the precursors, i.e., by changing the contents of α-Fe2O3 in the Fe2O3@WO3 composites. The typical SEM images of the 2.5%Fe2O3@WO3 and 9%Fe2O3@WO3 composites are shown in Fig. 5a and b, respectively. One can see clearly that the number densities of α-Fe2O3 NPs in 5% Fe2O3@WO3 (Fig. 2c) and 9% Fe2O3@WO3 composites (Fig. 5b) are higher than that of the 2.5%Fe2O3@WO3 composite (Fig. 5a). The particle sizes of the α-Fe2O3 NPs in the Fe2O3@WO3 composites are statistically analyzed according to the SEM observations (Fig. 2c, 5a and b) are shown in Fig. 5c. The mean particle size of the α-Fe2O3 NPs in the Fe2O3@WO3 nanocomposites increases from ∼9 nm to ∼13 nm when the apparent content of Fe2O3 NPs increases from 2.5% to 9%. It should be noted that the particle sizes of the α-Fe2O3 NPs measured according to the SEM images are a little larger than those (∼5 nm) observed in the TEM images (Fig. 2e and f). The possible reason should be the Pt-coating during the preparation of SEM samples.
To demonstrate the efficiency and advantages of the microwave heating (MH) process in the construction of hierarchical nanostructures, we comparatively developed a water-bath heating (WH) process to synthesize the Fe2O3@WO3 composites using the similar synthetic parameters except the heating manner. As a typical example, Fig. 6a shows the SEM image of the 5%Fe2O3@WO3 composite obtained via the WH process at 85 °C for 3 h. One can find that most of the α-Fe2O3 NPs are loosely attached on the surfaces of WO3 nanoplates, and the location distribution is random and uneven in Fig. 6a. In addition, many dissociative α-Fe2O3 NPs with aggregated structures can be found during the SEM observation (Fig. 6a). Comparatively, the 5%Fe2O3@WO3 composite obtained via the MH process consists of monodispersed α-Fe2O3 NPs tightly anchored on the WO3 nanoplates evenly, and few dissociative α-Fe2O3 NPs can be find in the SEM observation. We therefore infer that in the MH process the α-Fe2O3 NPs are in situ grown on the WO3 nanoplates via the heterogeneous nucleation mechanism, whereas in the WH process, the α-Fe2O3 NPs are firstly formed mainly via a homogenous nucleation mechanism, and then loosely adsorbed on the surfaces of WO3 nanoplates. The above inference can also be corroborated by the experimental phenomena: the filtrates are colorless in the MH process, whereas they are light brick-red in the WH process. The light brick-red suspension should be discrete Fe(OH)3 clusters, which then turn to be α-Fe2O3 NPs by calcination.
![]() | ||
Fig. 6 (a) Typical SEM image and (b) N2 adsorption–desorption isotherms of the 5%Fe2O3/WO3 nanocomposite obtained via the water-heating (WH) process at 85 °C for 3 h. |
The advantages of the MH process in the synthesis of hierarchical nanostructures are obvious when compared with the WH process. Firstly, the second-phase nanocrystals can be tightly anchored on the supports via the in situ heterogeneous nucleation growth because the high-efficient microwave energy can be selectively reacted with the precursor system. Secondly, the MH process is much rapider than the WH process in the synthesis of hierarchical nanostructures. For example, the synthesis of 5%Fe2O3@WO3 nanocomposite requires more than 3 h in the WH process, but just 4 min in the MH process. In addition, as the N2 adsorption–desorption isotherms shown in Fig. 6b, the BET specific surface area of the 5%Fe2O3@WO3 composite obtained via the WH process is 300 m2 g−1, which is far below that (1207 m2 g−1) of the 5%Fe2O3@WO3 composite obtained via the MH process.
Operating temperature usually highly influences the response of a gas sensor based on metal oxide semiconductors. Fig. 7d shows the typical responses of the sensors derived from the WO3 nanoplates, α-Fe2O3 nanoparticles and 5%Fe2O3@WO3 nanocomposite upon exposure to 5 ppm H2S operating at different temperatures (i.e., 100–250 °C). Both the WO3 and Fe2O3@WO3 sensors have a maximum response at around 150 °C, and their responses are 27 and 115, respectively. The response changes of the 5%Fe2O3@WO3 sensor are much larger than those of the WO3-nanoplate sensor from 100 to 250 °C. For the α-Fe2O3-nanoparticle sensor, the responses are less than 10 at the operating-temperature range of 100–250 °C.
The response and recovery times, embodying the response speeds, are important parameters in evaluating the performance of a gas-sensor. Fig. 8 shows the response and recovery times of the sensors derived from the WO3 nanoplates and 5%Fe2O3@WO3 nanocomposite upon exposure to 5 ppm H2S operating at 100–250 °C. One can see that a higher operating temperature is helpful to shorten the response and recovery times, and that the 5%Fe2O3@WO3 sensor has shorter response and recovery times than the WO3 sensor. Operating at 100 °C, the response and recovery times of the 5%Fe2O3@WO3 sensor are 17 s and 150 s, respectively (Fig. 8b), much shorter than those (239 s and 560 s) of the WO3 sensor (Fig. 8a). When the operating temperature is higher than 150 °C, the response time of the 5%Fe2O3@WO3 sensor is as short as 3–9 s, and its recovery time is about 10–38 s. The rapid response of the Fe2O3@WO3 sensors should be attributed to the hierarchical nanostructure and ultrahigh specific surface areas, providing efficient diffusion paths and adsorption sites for gas molecules.
The selective response of a gas sensor is also important in practical applications. Fig. 9 shows the selectivity of the sensors based on the WO3 nanoplates and 5%Fe2O3@WO3 nanocomposite operating at 150 °C. Various gases and organic vapors, including CH4, CO, H2, SO2, methanol, ethanol, isopropanol, methanol, acetone and benzene, with apparent concentrations of 100 ppm, are used as target substances to evaluate the selective response performance, comparing with 2 ppm H2S. One can see that the WO3-based sensors have the highest responses to 2 ppm H2S, and the responses are less than 10 upon exposure to the other substances. The 5%Fe2O3@WO3 sensor has a higher selectivity than the WO3-nanoplate sensor under the same test conditions. The hierarchical Fe2O3@WO3 nanocomposites are therefore suitable for H2S detection at low operation temperatures (e.g., ∼150 °C) due to its high response and selectivity to H2S.
![]() | ||
Fig. 9 Selective response at 150 °C of the sensors derived from the WO3 nanoplates and 5%Fe2O3@WO3 composite obtained by microwave-heating process. |
To demonstrate the advantages of the microwave-heating process, we compare the H2S response of the 5%Fe2O3@WO3 nanocomposites obtained by microwave-heating process (5%Fe2O3@WO3-MH) and water-heating process (5%Fe2O3@WO3-WH). Fig. 10 shows the typical responses of the 5%Fe2O3@WO3-MH and 5%Fe2O3@WO3-WH sensors operating at 150 °C upon exposure to H2S gases with various concentrations (0.5–10 ppm). It is clear that the Fe2O3 NPs highly enhance the H2S-sensing performance of WO3 nanoplates, and that the microwave-heating process is more favorable in forming higher H2S-sensing Fe2O3@WO3 nanocomposites than the water-heating process. The possible reasons for the enhancement of the MH-process are its efficient control in more uniform distribution and smaller particle sizes of Fe2O3 NPs anchored on the surfaces of WO3 nanoplates, resulting in ultrahigh specific surface areas of the Fe2O3@WO3-MH samples.
![]() | ||
Fig. 10 The plots of the [H2S]-dependent responses of the WO3, 5%Fe2O3@WO3-MH and 5%Fe2O3@WO3-WH sensors operating at 150 °C upon exposure to H2S gases with various concentrations (0.5–10 ppm). |
The gas-sensing performance of n-type semiconductors of WO3 and α-Fe2O3 nanocrystals relies upon the interaction of the target gases with adsorbed oxygen species. In air, oxygen molecules are adsorbed onto the surfaces of the α-Fe2O3 NPs and WO3 nanoplates, and are then transferred to O−, O2−or O2 ions by trapping electrons from the conductive bands of the n-type oxides (α-Fe2O3 and WO3), forming electron depletion layers with a high resistance (Fig. 11A). When the Fe2O3@WO3 sensors are exposed to H2S gas, the H2S molecules react with the chemisorbed oxygen species (eqn (4) and (5)), releasing electrons back to the conduction bands of α-Fe2O3 and WO3 (Fig. 11B). As a result, the concentration of electrons on the surface of the Fe2O3@WO3 nanocomposites increases and the electron depletion layers decrease, forming a low-resistance state.
H2S + 3O− (ads) → H2O + SO2 + 3e− | (4) |
H2S + 3O2− (ads) → H2O + SO2 + 6e− | (5) |
![]() | ||
Fig. 11 A schematic demonstration of the adsorption and reaction process of O2 and H2S molecules at the interface of the hierarchical Fe2O3@WO3 nanocomposite. |
As the operating temperature increases, high response is achieved because of the activation of adsorbed molecular oxygen and lattice oxygen (Fig. 11A). This phenomenon continues up to a certain optimum temperature, beyond which exothermic gas adsorption becomes difficult and gas molecules begin to desorb in large quantities, leading to a drop in sensor response.40 Thus, the optimum temperature is a balance point between the above two conflicting aspects (i.e., activation and desorption).
The synergistic effect of WO3 nanoplates and α-Fe2O3 NPs is the key factor improving the H2S-sensing performances of the Fe2O3@WO3 sensors. The additional depletion layers enhance the “volume depletion” because the Fe2O3@WO3 nanocomposites have ultrahigh specific surface areas (i.e., 1207 m2 g−1 for the 5%Fe2O3@WO3 sample), which allow them to absorb more gas molecules.6 Additionally, the highly monolayer-dispersed Fe2O3 NPs on the surfaces of WO3 nanoplates provides efficient and rapid electron-exchange between the cations: Fe(III) ↔ Fe(II).41 All the above aspects can improve the gas-sensing performance of the Fe2O3@WO3 sensors. Although the exact mechanism for understanding the enhancement in H2S-sensing process is not available, the synergistic effect of the α-Fe2O3 and WO3 species, not only in chemical compositions but also in microstructures, should be the essential origin to improve the low-temperature gas-sensing property of the WO3-based materials.
This journal is © The Royal Society of Chemistry 2015 |