Synthesis of poly(m-phenylenediamine)/iron oxide/acid oxidized multi-wall carbon nanotubes for removal of hexavalent chromium

Zhang Tian, Bo Yang, Guijia Cui, Li Zhang, Yaopeng Guo and Shiqiang Yan*
College of Chemistry and Chemical Engineering, Lanzhou University, Lanzhou 730000, PR China. E-mail: yansq@lzu.edu.cn; Tel: +86 931 8912582; Fax: +86 931 8912582

Received 12th September 2014 , Accepted 28th November 2014

First published on 28th November 2014


Abstract

Poly(m-phenylenediamine)-coated Fe3O4/o-MWCNTs nanoparticles (PmPD/Fe3O4/o-MWCNTs) were synthesized by one-step chemical oxidation polymerization. The materials were characterized by transmission electron microscopy, Fourier-transform infrared spectroscopy, X-ray diffraction, vibrating sample magnetometry, and Brunauer–Emmett–Teller surface area measurement. Hexavalent chromium adsorption by PmPD/Fe3O4/o-MWCNTs was found to be strongly dependent on the solution pH. The adsorption isotherm of Cr(VI) onto PmPD/Fe3O4/o-MWCNTs fitted the Langmuir isotherm model at different temperatures and the maximum adsorption capacity was determined to be 346 mg g−1. The adsorption process of different initial concentrations can be described by the pseudo-second-order kinetic model. The intraparticle diffusion study revealed that external mass transfer and intraparticle diffusion apparently influenced the overall rate process. The values of thermodynamic parameters indicated that the adsorption process was spontaneous and endothermic. In addition, the adsorption mechanism included both the physical and the chemical adsorption mechanisms. After adsorption, PmPD/Fe3O4/o-MWCNTs could be conveniently separated from the media by an external magnetic, and the adsorption capacity can remain at up to 52% after five times of usage. These results demonstrate that PmPD/Fe3O4/o-MWCNTs are a good candidate for the removal of Cr(VI) from aqueous solution.

1. Introduction

Chromium compounds are widely used in industries such as leather, textile, metal plating, battery and pigments. In aqueous media, chromium exists in trivalent and hexavalent states. However the hexavalent form has been considered more hazardous to public health due to its mutagenic and carcinogenic properties.1 According to the World Health Organization, it has limited 5 μg L−1 as the maximum allowable emission standard of Cr(VI).2 Therefore, it is necessary to scavenge Cr(VI) ions from industrial effluents before their discharge into the environment in order to prevent the deleterious impact of Cr(VI) ions on the ecosystem and public health. Several conventional methods for removing heavy metal ions wastewater include, physical and physicochemical treatment technologies, such as ion-exchange, electro dialysis, membrane filtration, reverse osmosis, chemical precipitation and adsorption.3–7 Among these methods, adsorption is one of the most economically favorable and a technically easy method. However, biosorbents often cause potential secondary pollution in extreme conditions, have weak mechanical strength, are not easily separated, and are not sufficiently effective. Thus, developing new materials with simple synthesis, high adsorption capacity, easy separation, and good stability in extreme conditions, is highly desired.8

Recently, the applications of carbon nanotubes (CNTs) as potential adsorbents have been widely studied for the removal of metallic pollutants.9–15 CNTs have been widely used as a potential adsorbent because of their high surface area to weight ratios, small size, hollow/layered structures, and hydrophobic surfaces. Considering their large surface areas and π–π electrostatic interactions, CNTs exhibit exceptional adsorption capabilities for gas and liquid phases, such as organic pollutants,16 inorganic pollutants13 and several heavy metal ions.17–19 However, the major difficulties with small size CNTs are the formation of agglomerates and separation from the aqueous medium because of the strong intermolecular van der Waals interaction between tubes. Recently, magnetic separation technology has been introduced as a particular separation method capable of quickly separating magnetic adsorbents from an aqueous solution via the application of an external magnetic field.20 Furthermore, due to the existence of synergistic effects, the combination of magnetic structures and adsorbents has extended the possibilities for applications. Carbon nanotubes filled with magnetic nanoparticles are very interesting as new materials for applications in adsorption because they provide a rapid and effective technology for separating materials from the aqueous phase.21,22 However, due to agglomeration, the active sites of CNTs are blocked resulting in decreased adsorption capacity. One way to alleviate this problem is the modification of CNTs, using surfactant, polymer, etc.23,24

More recently, polymeric material have been widely studied for the removal of metallic pollutants. Poly(m-phenylenediamine)s, the diamine derivatives of polyaniline, have been given special concerns due to the higher content of functional groups in conjugated structure and more intriguing multifunctionality.25 It is the most important scavenger of aqueous trace metals due to its seemingly dominant adsorptive behavior. Nevertheless, existing studies seldom concern their usage on Cr(VI) removal. To our knowledge, this is the first report of the preparation of synthesize PmPD/Fe3O4/o-MWCNTs magnetic nanocomposites for the removal of Cr(VI).

In this work, PmPD doped Fe3O4/o-MWCNTs (PmPD/Fe3O4/o-MWCNTs) nanocomposite was prepared by in situ oxidative polymerization. The magnetic nanocomposite was characterized using transmission electron microscopy (TEM), X-ray diffraction (XRD), Fourier-transform infrared spectroscopy (FTIR) analysis, Brunauer, Emmett, and Teller surface area measurement (BET) analyses, and vibrating sample magnetometry (VSM). Influences of pH, contact time at different initial concentrations and temperature were examined in order to evaluate adsorption performance of PmPD/Fe3O4/o-MWCNTs for Cr(VI) removal. In addition, the adsorption kinetics, rate-controlling mechanisms, thermodynamics and the reusability of the adsorbents were also investigated.

2. Experimental

2.1. Materials

MWCNTs having diameter 20–30 nm and length of 5–20 μm, were purchased from Alpha Nano Technology Co., Ltd. (China). Benzyl ether and Fe(acac)3 (purity, 99.9%) were purchased from Sigma-Aldrich. Potassium dichromate (K2Cr2O7) was used to prepare all hexavalent chromium-containing solution. PmPD adsorbents were prepared by the improved chemical oxidation method. All reagents mentioned above were of analytical grade and were used as received. The biochemical reagent L-tryptophan was provided by Shanghai Biological Technology Development Co. Ltd. (China).

2.2. Preparation of o-MWCNTs

The raw-MWCNTs were immersed in a 250 mL three neck flask with a concentrated nitric acid for 24 h. Then the mixture was stirred and heated to reflux at 130 °C for 4 h. Afterward, the black mixture were collected by filtration, washed by distilled water and dried at 60 °C. These materials were denoted as “o-MWCNTs.”

2.3. Preparation of Fe3O4/o-MWCNTs magnetic nanocomposites

Fe3O4/o-MWCNTs magnetic nanocomposites were prepared by using a published method with a slight modification.22 Firstly, 1 g Fe(acac)3, 0.5 g MWCNTs, 0.5 g L-tryptophan and 20 mL benzyl ether were added into a flask followed by ultrasonication for 30 min. The mixture solution was then heated to 300 °C at reflux for 2 h. After cooling to room temperature, the black mixture was magnetically separated by a magnet and cleaned with ethanol several times. Finally the as-prepared Fe3O4/o-MWCNTs magnetic nanocomposites were extracted by ethanol for 24 h to remove residual benzyl ether and dried in vacuum at 30 °C.

2.4. Preparation of PmPD doped Fe3O4/o-MWCNTs composite

PmPD/Fe3O4/o-MWCNTs nanocomposite was synthesized via in situ oxidative polymerization as follows. 1 g Fe3O4/o-MWCNTs and 1 g mPD was dissolved in 20 mL of distilled water with equably stirring at 25 °C. Subsequently, a certain concentration of NaOH solution with the same amount and speed as the ammonium persulfate (APS) solution was added dropwise to the suspension, and the reaction mixtures were kept stirring for another 5 h at 25 °C. The products were collected by filtration, and washed by distilled water, ammonia water (1[thin space (1/6-em)]:[thin space (1/6-em)]1,v/v), ethanol and dried at 60 °C under vacuum for 24 h.

2.5. Characterization of the adsorbents

The surface morphology of Fe3O4/o-MWCNTs and PmPD/Fe3O4/o-MWCNTs was examined on a transmission electron microscope. The functional groups of the o-MWCNTs, Fe3O4/o-MWCNTs, and PmPD/Fe3O4/o-MWCNTs were verified using a NEXUS 670 FTIR spectrometer. X-Ray diffraction was used to investigate the crystal structure of the magnetic nanoparticles. The specific surface area, pore volume, and pore size was calculated by the Brunauer–Emmett–Teller (BET) method. The magnetic properties were characterized by vibrating sample magnetometry (VSM, LAKESH ORE-7304) at room temperature.

2.6. Analysis

The concentration of hexavalent chromium was determined by 1,5-diphenylcarbazide spectrophotometric method. 1,5-Diphenylcarbazide forms a pink complex in the presence of Cr(VI) ions in acidic solutions as a complexing agent for Cr(VI). The concentration of Cr(VI) was calculated from absorbance at 540 nm wavelength using UV spectrophotometer after adsorption experiment.

2.7. Adsorption experiments

Adsorption experiments were carried out in 100 mL stoppered flasks, each of which contained 50 mL of Cr(VI) solution. An amount of PmPD/Fe3O4/o-MWCNTs was added to each flask and shaken at 250 rpm min−1 in a temperature-controlled shaker with a shaker. These data were used to calculate the amounts of Cr6+ adsorbed. The absorption capacity (qe, mg g−1) can be expressed by the following equation:
 
image file: c4ra10282g-t1.tif(1)
where, C0 and Ce are the initial and equilibrium concentration (mg L−1) of Cr(VI) respectively, V is the volume (L) of solution and m is the weight (g) of adsorbent.

2.8. Desorption experiments

In order to investigate the reusability of the PmPD/Fe3O4/o-MWCNTs nanocomposites, 0.1 M NaOH was used as the desorption solution for the desorption experiment. 0.032 g of PmPD/Fe3O4/o-MWCNTs was first contacted with 100 mL of 300 mg L−1 Cr6+ for 120 min. After adsorption, desorption was carried out by washing the adsorbents with distilled water several times, then the solution of 100 mL of 0.1 M NaOH was added into the adsorbed Cr6+ adsorbents, and the suspensions were shaken at for 120 min. The solid and liquid phases were separated by a magnet. The above procedure was repeated for five times to test the reusability of the PmPD/Fe3O4/o-MWCNTs.

3. Results and discussion

3.1. Characterization

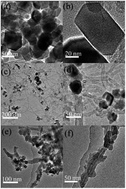
The morphology of the Fe3O4/o-MWCNTs nanocomposites and PmPD/Fe3O4/o-MWCNTs nanocomposites were examined by TEM, as shown in Fig. 1. Fig. 1(a) and (b) show the images of the pure Fe3O4 nanoparticles under different magnifications. It can be clearly seen that the morphology of the pure Fe3O4 nanoparticles is nearly cubic. This interaction of Fe(acac)3 with L-tryptophan during the nucleation and growth phase may force the crystal growth to become cubic in shape, surrounded by a (100) crystal plane which has the lowest surface free energy and the most thermodynamically stable shape.26 Meanwhile, the o-MWCNTs have been coated with cubic iron oxide nanoclusters that are often aggregated by virtue of their magnetic nature. Fig. 1(c) and (d) show the images of the Fe3O4/o-MWCNTs nanoparticles under different magnifications. Fig. 1(c) shows that the MWCNTs were visible debundled and shorted after oxidation with a nitric acid. Fig. 1(d) reveals that the surface of the CNTs was loaded with nanoclusters, which is composed of several nanocrystals. Fig. 1(e) and (f) show the morphology of the PmPD/Fe3O4/o-MWCNTs under different magnifications. The PmPD/Fe3O4/o-MWCNTs were fully coated with PmPD polymer layers. In addition, the PmPD/Fe3O4/o-MWCNTs composite displayed a special uniform and continuous coating layer. These characteristics may provide a good platform for the adsorption of metal ions.
image file: c4ra10282g-f1.tif
Fig. 1 (a)–(b) are the images of the pure Fe3O4 nanoparticles under different magnifications; (c)–(d) are the images of Fe3O4/o-MWCNTs nanocomposites under different magnifications; (e)–(f) are the images of PmPD/Fe3O4/o-MWCNTs nanocomposites under different magnifications.

The structural information for the Fe3O4/o-MWCNTs nanoparticles and the PmPD/Fe3O4/o-MWCNTs nanocomposites was obtained by XRD as shown in Fig. 2(a). The new diffraction peak at 2θ = 25.96° can be indexed to the graphite structure (002) reflection of the MWCNTs. After surface modification, the peaks at 2θ values at 30.19°, 35.45°, 43.17°, 53.49°, 56.99°, and 62.57° are respectively consistent with the (220), (311), (400), (422), (511) and (440),which are in line with the standard XRD data for the cubic spinel crystal structure of bulk magnetite (JCPDS file no.19-0629).27 The peak of the Fe3O4/o-MWCNTs nanoparticles at 53.49 (422) disappeared in the PmPD/Fe3O4/o-MWCNTs, which may be due to the fact that the PmPD is coated on Fe3O4/o-MWCNTs.


image file: c4ra10282g-f2.tif
Fig. 2 XRD patterns of Fe3O4/o-MWCNTs and PmPD/Fe3O4/o-MWCNTs.

FT-IR analysis is applied to investigate the types of functional groups attached on the surface of the MWCNTs. Fig. 3 compares the FT-IR spectra of o-MWCNTs, Fe3O4/o-MWCNTs and PmPD/Fe3O4/o-MWCNTs magnetic nanocomposites. The characteristic peaks at 3425 and 1727 cm−1 in the spectrum (o-MWCNTs) was generally attributed to the stretching vibration of ν(OH) and ν(C[double bond, length as m-dash]O) of the carboxylic groups (COOH), respectively. Peaks were observed at the 1650 cm−1 to 1550 cm−1 correspond to the C[double bond, length as m-dash]O groups in different environments (ketone/quinone) and to C[double bond, length as m-dash]C in aromatic rings; whereas the bands in the range of 1300 cm−1 to 950 cm−1 range have proven the presence of C–O bonds in various chemical surroundings.28 In the spectrum (Fe3O4/o-MWCNTs), the characteristic peak strongly presented at 586 cm−1 related to the stretching vibration of Fe–O–Fe, characteristic of Fe3O4; the comparison of o-MWCNTs and Fe3O4/o-MWCNTs FTIR spectra shows a shift of the C[double bond, length as m-dash]O stretching peak from 1727 to 1733 cm−1, suggesting that magnetite nanoparticles are anchored to the MWCNT carboxyl groups.21 For the spectrum of the PmPD/Fe3O4/o-MWCNTs magnetic nanocomposites, the vibrational peaks centered at 1618, 1508 and 1238 cm−1 can be attributed to the stretching frequencies of quinoid imine, benzenoid amine, and C–N band respectively.29 Meanwhile, the two broad peaks between 3416 and 2921 cm−1 are attributed to the stretching vibration of –NH–.


image file: c4ra10282g-f3.tif
Fig. 3 FTIR transmission spectra of o-MWCNTs, Fe3O4/o-MWCNTs, and PmPD/Fe3O4/o-MWCNTs.

The physical properties of o-MWCNTs, Fe3O4/o-MWCNTs, and PmPD/Fe3O4/o-MWCNTs are listed in Table 1 (Fig. S1). The surface area, pore volume, and pore size of Fe3O4/o-MWCNTs and PmPD/Fe3O4/o-MWCNTs are evidently much lower than the o-MWCNTs. The generation of Fe3O4 nanocomposites and PmPD blocks the pore entrances, therefore decreasing the surface area, pore volume, and pore size of the MWCNTs. However, the existence of Fe3O4 and PmPD play an important role in the enhancement of the adsorption capacity.

Table 1 Pore structure parameters of different materials
Materials Surface area (m2 g−1) Pore volume (cm3 g−1) Pore size (nm)  
Fe3O4/o-MWCNTs 110.2 0.5917 21.48  
PmPD/Fe3O4/o-MWCNTs 45.8 0.1936 16.65  


The magnetic properties of the Fe3O4/o-MWCNTs and PmPD/Fe3O4/o-MWCNTs nanocomposites are depicted in Fig. 4. Their saturation magnetization are 22.6 emu g−1 and 11.8 emu g−1, respectively. Furthermore, the two samples exhibit superparamagnetic behavior at room temperature with no coercivity and remanence. In addition, the saturation magnetization value of PmPD/Fe3O4/o-MWCNTs is lower than that of the Fe3O4/o-MWCNTs, which can be mainly attributed to the existence of PmPD. Fig. 5(a) shows photographs of PmPD/Fe3O4/o-MWCNTs nanocomposites dispersed in ethanol. Fig. 5(b) shows the PmPD/Fe3O4/o-MWCNTs can be promptly separated from their dispersion by holding the samples close to a magnet, indicating that it is promising to be used as a magnetic adsorbent to remove contaminants in wastewater.


image file: c4ra10282g-f4.tif
Fig. 4 Magnetic hysteresis curves for Fe3O4/o-MWCNTs and PmPD/Fe3O4/o-MWCNTs.

image file: c4ra10282g-f5.tif
Fig. 5 The inset demonstrates that PmPD/Fe3O4/o-MWCNTs (a) can be dispersed in ethanol and separated from ethanol by a magnet (b).

3.2. Adsorption capacity of PmPD/Fe3O4/o-MWCNTs

The adsorption capacities of PmPD/Fe3O4/o-MWCNTs compared with other materials as shown in Fig. 6. It can be seen that PmPD/Fe3O4/o-MWCNTs are the most effective removal materials compared with the other materials which indicates PmPD/Fe3O4/o-MWCNTs provide more binding sites for Cr6+.
image file: c4ra10282g-f6.tif
Fig. 6 Adsorption capacities of different materials with regard to Cr6+ adsorption.

The adsorption capacity of PmPD/Fe3O4/o-MWCNTs is higher than that of raw-MWCNTs, suggesting that the organic functional groups on the o-MWCNTs, such as hydroxyl, carboxyl, and carbonyl groups, are expected to be the active centers for Cr6+. Furthermore, the adsorption capacity of Fe3O4/o-MWCNTs is much higher than that of o-MWCNTs because the Fe3O4 coated on the o-MWCNTs and Fe3O4 was a good adsorbent for Cr6+.30 Therefore, the adsorption capacities of different materials mainly depend on the functional groups.

3.3. The effect of solution pH

pH is one of the most important parameters controlling the metal ion adsorption process. In order to optimize the pH for maximum adsorption capacity of Cr6+ on PmPD/Fe3O4/o-MWCNTs magnetic nanocomposites, adsorption experiment was conducted at various initial pH values. Fig. 7 shows that the performance of PmPD/Fe3O4/o-MWCNTs became better as lowering the initial pH of Cr(VI) solution, and the adsorption capacity decreases with the increase in pH from 2.0 to 11.0. In the acid media, HCrO4, Cr2O72− and H2CrO42− are the predominant species. In basic solutions chromium exists in the form of CrO42−. If pH ranges from 2 to 6, HCrO4 and Cr2O72− are predominant in equilibrium.31 The adsorption free energy of HCrO4 is lower than that of CrO42− and Cr2O72−; and consequently, HCrO4 is more favorably adsorbed than CrO42− and Cr2O72− at the same concentration.32 Meanwhile the surface of adsorbents was positive charged at low pH and negative-charged with pH increased. Thus, low pH was favorable for HCrO4 adsorption because of the electrostatic attraction or weakness of electrostatic repulsion. With the pH increased, the electrostatic repulsion between CrO42− and negatively charged surface became strong, resulting in the declined removal efficiency.33
image file: c4ra10282g-f7.tif
Fig. 7 Effect of solution pH on chromium ions adsorbed onto PmPD/Fe3O4/o-MWCNTs.

3.4. Adsorption isotherms study

Adsorption isotherm studies are important to established the relationship between adsorbent and adsorbate at equilibrium. Several adsorption isotherms originally are used for adsorption equilibria in heavy metals adsorption. Some well-known ones are Freundlich, Langmuir, Temkin, Redlich–Paterson and Sips equation.34 In this study, Langmuir, Freundlich and Temkin models were used for adsorption isotherms.

Langmuir isotherm equation is derived from the assumption that the adsorbent surface has a fixed number of equivalent binding sites, and the monolayer adsorption occurs without transmigration of adsorbate on the surface of adsorbent isotherm.35,36 This process is represented as follows:

 
image file: c4ra10282g-t2.tif(2)
where qe (mg g−1) is the amount of solution adsorbed per unit mass of the adsorbent, Ce (mg L−1) is the solute equilibrium concentration, qm (mg g−1) is the maximum adsorbate amount that forms a complete monolayer on the surface, and b (L mg−1) is the Langmuir constant related to adsorption heat. When Ce/qe is plotted against Ce and the data are regressed linearly, the qm and b constants can be calculated from the slope and the intercept (Fig. S2).

The essential characteristics of the Langmuir isotherm can be expressed by the dimensionless equilibrium parameter, which RL is defined as follows:37

 
image file: c4ra10282g-t3.tif(3)
where b is the Langmuir coefficient, C0 is the initial Cr6+ concentration (mg L−1). RL values indicate the type of isotherm. The RL values for each of the different initial concentrations are between 0 and 1 indicating favorable adsorption of Cr(VI) onto PmPD/Fe3O4/o-MWCNTs.

Freundlich isotherm assumes that the binding sites on the surface of adsorbent are heterogeneous, the adsorption is more difficult as more and more binding sites are occupied by adsorbates and multilayer adsorption can occur. The Freundlich isotherm37 can be represented in the following form:

 
image file: c4ra10282g-t4.tif(4)
where qe and Ce are the equilibrium concentrations of chromium(VI) in the adsorbed (mg g−1) and liquid phases (mg L−1) and KF and n are the Freundlich constants which are related to adsorption capacity and adsorption intensity, respectively. Both constants can be calculated from the slope and intercept of the linear plot of ln[thin space (1/6-em)]qe versus ln[thin space (1/6-em)]Ce (Fig. S4).

Temkin isotherm model is applicable to evaluate the adsorption potentials of the applied adsorbents for adsorbate ions, and assumes the effects of the heat of adsorption that decreases linearly with coverage of the adsorbate and adsorbent interactions, and adsorption is characterized by a uniform distribution of binding energies, up to some maximum binding energy.38 The Temkin isotherm can be represented in the following form:

 
qe = Bt[thin space (1/6-em)]ln(KT) + Bt[thin space (1/6-em)]ln(Ce) (5)
where


image file: c4ra10282g-t5.tif

KT is the equilibrium binding constant (L mg−1) corresponding to the maximum binding energy and the constant Bt is related to the heat of adsorption. R is the universal gas constant (8.314 J K−1 mol−1), T is the absolute temperature (K) and b is the Temkin constant related to the heat of sorption (J mol−1). A plot of qe versus ln(Ce) enables the determination of the isotherm constants KT and Bt (Fig. S5).

Table 2 shows that the Langmuir model fit the adsorption data better than the Freundlich model and Temkin isotherm model. This result may be due to the homogeneous distribution of active site energies on the surface of the PmPD/Fe3O4/o-MWCNTs magnetic nanocomposites, where no interaction has been observed between the adsorbed molecules and the surface of PmPD/Fe3O4/o-MWCNTs. Meanwhile, the RL values in the range of 0–1, suggesting the suitability of adsorbent. In addition, the maximum adsorption capacity of adsorbent increased from 219.78 mg g−1 to 346 mg g−1 with the increase in temperature from 275 K to 335 K, which indicates the possibility that Cr6+ adsorption by PmPD/Fe3O4/o-MWCNTs is an endothermic process.

Table 2 Parameters of the Langmuir, Freundlich and Temkin isotherms for Cr6+ adsorption onto PmPD/Fe3O4/o-MWCNTs
T(K) Langmuir isotherm Freundlich isotherm Temkin isotherms
qm (mg g−1) b r12 RL n KF r22 Bt KT r32
273 219.8 0.0387 0.983 0.079–0.341 4.87 64.00 0.944 31.42 2.20 0.903
303 293.3 0.0484 0.978 0.064–0.292 5.12 3.59 0.943 38.40 1.96 0.884
333 346.0 0.0670 0.984 0.047–0.229 5.18 117.30 0.980 43.13 1.61 0.935


3.5. Effect of contact time and initial concentration

The rate at which dissolved heavy metal ions are removed from aqueous solution by solid sorbents is a significant factor for application in water quality control. Fig. 8 show the effect of adsorption time on the adsorption capacity at different initial solution concentrations. It is evident from these figures that the adsorption of Cr(VI) increases with increasing contact time. The adsorption equilibrium time of 300 mg g−1 initial Cr6+ solution is slightly longer than the 100 mg L−1 and 200 mg L−1. The contact time was set to 80 min in each experiment to ensure each adsorption process can reach the equilibrium. The removal of Cr(VI) was found to be dependent on the initial concentration. The amount of Cr(VI) adsorbed, qe (mg g−1), increased with increase in initial concentration. Further, the adsorption was rapid in the early stages and then gradually decreased and became almost constant after the equilibrium point.
image file: c4ra10282g-f8.tif
Fig. 8 Effect of contact time on chromium ions adsorbed onto PmPD/Fe3O4/o-MWCNTs at different initial solution concentrations.

3.6. Adsorption dynamics

It is essential to evaluate the adsorption kinetics as well as adsorption equilibrium using theoretical models in order to further investigate the adsorption of Cr(VI) by PmPD/Fe3O4/o-MWCNTs magnetic nanocomposites. The kinetic adsorption data were simulated with the pseudo-first-order equation and the pseudo-second-order rate equation, which are expressed as follows:39–41
 
image file: c4ra10282g-t6.tif(6)
 
image file: c4ra10282g-t7.tif(7)
where k1 (min−1), and k2 (g mg−1 min−1) are the pseudo-first-order and pseudo-second-order rate adsorption constants, respectively. qe and qt are the amounts of Cr(VI) adsorbed (mg g−1) at equilibrium and time t (min), respectively.

A straight line of log(qeqt) versus t suggests the applicability of this kinetic model, qe and k1 can be determined from the intercept and slope of the plot (Fig. S6). The plot t/qt versus t should give a straight line if second-order kinetics are applicable and qe and k2 can be determined from the slope and intercept of the plot (Fig. S7). Initial adsorption rates h (mg g−1 min−1) were also calculated from the data of pseudo-second-order kinetic model as follows:

 
h = k2qe2 (8)

The kinetic parameters and correlation coefficients are listed in Table 3. Clearly, the correlation coefficients made by pseudo-first-order is a little smaller than that of pseudo-first-order kinetic mode, indicating that the pseudo-second-order kinetic mode give a good fit to the experimental kinetic data with a much higher correlation coefficient (r2 > 0.99). Furthermore, the calculated adsorption capacities of pseudo-first-order differs much from the measured results, while the calculated adsorption capacities of pseudo-second-order kinetic mode are almost identical to the measured adsorption capacities. Thus experiment results supports the assumption behind the model that the rate limiting step in adsorption of heavy metals are chemisorption involving valence forces through the sharing or exchange of electrons between adsorbent and metal ions.

Table 3 Kinetic parameters for Cr6+ adsorption onto PmPD/Fe3O4/o-MWCNTs at various concentrations
C0 (mg L−1) Pseudo-first-order Pseudo-second-order
k1 qe r12 k2 qe h r22
100 0.0659 82.6 0.96 0.0032 207 137 0.99
200 0.0706 140.0 0.98 0.0023 267 169 0.99
300 0.0499 150.0 0.96 0.0011 342 131 0.99


3.7. Intraparticle diffusion model (Waber–Morris model)

The overall reaction kinetics for the adsorption of Cr(VI) is a pseudo-second-order process. However, this could not highlight on the rate-limiting step. The mechanism of sorption is generally considered to involve three steps, one or any combination of which can be the rate-controlling mechanism: (i) mass transfer across the external boundary layer film of liquid surrounding the outside of the particle; (ii) sorption at a site on the surface (internal or external) and the energy will depend on the binding process (physical or chemical); this step is often assumed to be extremely rapid; (iii) diffusion of the adsorbate molecules to an sorption site either by a pore diffusion process through the liquid filled pores or by a solid surface diffusion mechanism.42 The probability of the intra-particle diffusion was explored by using the following equation suggested by Weber and Morries:43
 
qt = kdt1/2 + C (9)
where qt is adsorption capacity at any time t and kd is the intraparticle diffusion rate constant (mg g−1 min−1/2) and C is the film thickness. If the plot of qt against the square root of time should be a straight line and pass through the origin, implying that the rate limiting step be the intraparticle diffusion. If the plot is non-linear or linear but does not pass through the origin, then film diffusion or chemical reaction controls the adsorption rate.44

As seen from Fig. 9 the plots possess multi-linear portions, which indicated that two or more steps influence the sorption process. Fig. 9 shows that the straight line did not pass through the origin and this further indicated that the intraparticle diffusion was not only the rate controlling step. Meanwhile, the plots for the Weber–Morris kinetic model for PmPD/Fe3O4/o-MWCNTs at three different initial concentrations have three distinct regions. The slope of the linear portion indicated the rate of the sorption. The lower slope corresponded to a slower sorption process. At up to 10 min, the Cr6+ adsorption rate is relatively rapid is due to the diffusion in bulk phase to the exterior surface of adsorbent and the easily accessible sites, as well as the initial high Cr6+ concentration in the solution. A slow increase of Cr6+ adsorption is observed between 10 and 60 min attribute to the intraparticle diffusion of Cr6+ into mesopores. With the extension of time (60–300 min), the third linear portion indicate the adsorption–desorption equilibrium.


image file: c4ra10282g-f9.tif
Fig. 9 The plot of intraparticle diffusion modelling of Cr6+ adsorbed onto PmPD/Fe3O4/o-MWCNTs with different initial concentrations.

3.8. Thermodynamic studies

Temperature dependence of the adsorption process is associated with several thermodynamic parameters, including Gibbs free energy change ΔGo, enthalpy change ΔHo and entropy change ΔSo.

ΔGo were used to decide whether the adsorption process is spontaneous or not. ΔGo were calculated from the following equation:45

 
ΔGo = −RT[thin space (1/6-em)]ln[thin space (1/6-em)]kc (10)
 
image file: c4ra10282g-t8.tif(11)
where kc is the equilibrium constant, CAe is the solid phase concentration at equilibrium (mg L−1), T is the temperature in Kelvin and R is the gas constant (8.314 J mol−1 K−1).

Relation between ΔGo, ΔHo and ΔSo can be expressed by the following equation;

 
image file: c4ra10282g-t9.tif(12)

ΔHo and ΔSo were obtained from the slope and intercept of the plot of the Van't Hoff plot of kc versus 1/T (Fig. 10). The calculated results are listed in Table 4, which indicates that Cr6+ adsorption on PmPD/Fe3O4/o-MWCNTs is a spontaneous process. However, the negative value of ΔGo decreased with an increase in temperature, indicating that the spontaneous nature of adsorption of Cr6+ were inversely proportional to the temperature. Enhancement of adsorption capacity of adsorbent at higher temperatures may be attributed to the enlargement of pore size and/or activation of the adsorbent surface.46 The positive value of ΔHo confirmed the endothermic nature of adsorption which was also supported by the increase in value of Cr6+ uptake of the adsorbent with the rise in temperature. A possible explanation is that the metal ions are well hydrated and will require breaking of the hydration sheath to proceed for adsorption, which consequently requires high energy. Thus, high temperature favors the dehydration process and the adsorption phenomenon.47 The positive value of ΔSo shows the feasibility of adsorption and the increased randomness at the sorbent/solution interface during the adsorption of metal ions onto PmPD/Fe3O4/o-MWCNTs.


image file: c4ra10282g-f10.tif
Fig. 10 Van't Hoff Plot for the adsorption of Cr6+ ions adsorption by PmPD/Fe3O4/o-MWCNTs nanoparticles.
Table 4 Thermodynamic parameters for Cr6+ adsorption onto PmPD/Fe3O4/o-MWCNTs
T(K) ln[thin space (1/6-em)]kc ΔGo (kJ mol−1) ΔHo (kJ mol−1) ΔSo (J mol−1 k−1)
273 3.239 −7.350    
303 3.842 −9.678 22.096 106.98
333 5.008 −13.864    


3.9. Desorption studies

Regeneration of adsorbent for repeated reuse is of crucial importance for keeping the process costs down and recovering the metals extracted from the liquid phase. The system pH values has a great influence on the Cr6+ adsorption, therefore the reusability experiments were conducted at alkaline condition. Fig. 11 shows the recycling of PmPD/Fe3O4/o-MWCNTs magnetic nanocomposites for the removal of Cr6+. It is observed that the magnetic nanocomposites still possessed more than 52% adsorption capacities for Cr6+ after five cycles of reuse, reflecting a good reusability and high stability of the PmPD/Fe3O4/o-MWCNTs magnetic nanocomposites.
image file: c4ra10282g-f11.tif
Fig. 11 The reusability of the PmPD/Fe3O4/o-MWCNTs nanocomposites for chromium ion adsorption.

3.10. Cr(VI) adsorption mechanisms by PmPD/Fe3O4/o-MWCNTs

As stated above, the initial pH of Cr(VI) solution greatly affects the Cr(VI) adsorption performance of PmPD/Fe3O4/o-MWCNTs. This indicates that the H+ played an important role during the adsorption. One of the reasons is that the Cr(VI) has powerful oxidizability, which makes it easy to be reduced to Cr(III) at low pH values.43 The reaction is shown as follows:3
 
HCrO4 + 7H+ + 3e ↔ Cr3+ + 4H2O (13)
 
Cr2O72− + 6e + 3H ↔ 2Cr3+ + 7H2O (14)

According the previous literature, Fe3O4 was also a kind of adsorption group for Cr6+. The surface of Fe3O4 particle exhibit either positive or negative charge depends on pH values. Hence, Fe3O4 would attract negative Cr6+ species at low pH by electrostatic interactions.

The most important adsorption group is PmPD, which can greatly improve the adsorption capacity of PmPD/Fe3O4/o-MWCNTs. According to previous literature,48 the benzenoid amine can be oxidized to quinoid imine by Cr(VI), which proves the redox reaction between PmPDs and Cr(VI). The –NH– of PmPD turns into –N = after Cr(VI) adsorption and Cr(III) may be chelated with imino groups of the adsorbents. Meanwhile, the appearance of –N+ = demonstrates the doping of Cr(VI) and chelation of Cr(III) during the adsorption.

3.11. Comparison of adsorbent performance with literature data

A comparison of the chromium adsorption capacity of PmPD/Fe3O4/o-MWCNTs with various adsorbents in Table 5. It shows that chromium adsorption capacity varied in wide range. The chromium removal capacities of other adsorbents were lower than that of PmPD/Fe3O4/o-MWCNTs.2,36,49–56 Thus, the comparison suggests that PmPD/Fe3O4/o-MWCNTs have great potential as heavy metal ion adsorbents in wastewater treatment.
Table 5 Comparison of adsorption capacity of various adsorbents for the removal of Cr(VI)
Adsorbents Adsorption capacity (mg g−1) Ref.
Magnetic particles 16.0 49
Graphene/MgAl-layered double hydroxide 177.6 50
Modified magnetic chitosan chelating resin 58.4 51
Haruna zeolite (HZ) modified with surfactant hexadecylpyridinium bromide 14.3 52
Sawdust 41.5 53
Nanocrystalline akaganeite 80.0 54
Polyacrylamide grafted sawdust 12.4 55
Activated carbon derived from acrylonitrile-divinylbenzene 81.5 36
Fe3O4 hollow microspheres/graphene oxide 32.3 2
Amine impregnated graphene oxide 232.5 56
PmPD/Fe3O4/o-MWCNTs 346.0 This study


4. Conclusions

In summary, the PmPD/Fe3O4/o-MWCNTs were successfully prepared by a straightforward method. The FTIR and XRD results of the samples demonstrated that PmPD and Fe3O4 had been successfully attached onto the MWCNTs.

The TEM showed the morphology of the PmPD/Fe3O4/o-MWCNTs. As far as we know, this is the first time that PmPD/Fe3O4/o-MWCNTs magnetic nanocomposites have been synthesized and used as an adsorbent for the removal of Cr6+. The Langmuir, Freundlich and Temkin adsorption models were applied to describe the equilibrium isotherms. The maximum adsorption capacity calculated from the Langmuir isotherm model of PmPD/Fe3O4/o-MWCNTs magnetic nanocomposites is 346 mg g−1 at pH 2.0. Kinetic study showed that the pseudo-second-order model provided a very good fitting (r2 > 0.99) for the kinetic data of the adsorption under all investigated concentrations. The thermodynamic parameters ΔHo, ΔGo and ΔSo were calculated with temperature and pressure. The results show a feasible, spontaneous and exothermic adsorption process. The mechanism of adsorption includes both physical and chemical adsorptions. The adsorption–desorption cycle results showed that the adsorption capacity can remain up to 52% after five times of usage. Therefore, the PmPD/Fe3O4/o-MWCNTs have great potential to be used as efficient adsorbents to adsorb heavy metal from wastewater.

References

  1. S. Basha, Z. Murthy and B. Jha, Chem. Eng. J., 2008, 137, 480–488 CrossRef CAS PubMed.
  2. M. C. Liu, T. Wen, X. L. Wu, C. L. Chen, J. Hu, J. Li and X. K. Wang, Dalton Trans., 2013, 42, 14710–14717 RSC.
  3. D. Mohan and C. U. Pittman Jr, J. Hazard. Mater., 2006, 137, 762–811 CrossRef CAS PubMed.
  4. T. A. Kurniawan, G. Y. S. Chan, W.-H. Lo and S. Babel, Chem. Eng. J., 2006, 118, 83–98 CrossRef CAS PubMed.
  5. D. Zhou, L. Zhang, J. Zhou and S. Guo, Water Res., 2004, 38, 2643–2650 CrossRef CAS PubMed.
  6. S. W. Zhang, M. Y. Zeng, W. Q. Xu, J. X. Li, J. Li, J. Z. Xu and X. K. Wang, Dalton Trans., 2013, 42, 7854–7858 RSC.
  7. G. X. Zhao, T. Wen, C. L. Chen and X. K. Wang, RSC Adv., 2012, 2, 9286–9303 RSC.
  8. L. Fan, C. Luo, M. Sun and H. Qiu, J. Mater. Chem., 2012, 22, 24577 RSC.
  9. S. Iijima, Nature, 1991, 354, 56–58 CrossRef CAS.
  10. C. Lu, H. Chiu and C. Liu, Ind. Eng. Chem. Res., 2006, 45, 2850–2855 CrossRef CAS.
  11. H. H. Cho, K. Wepasnick, B. A. Smith, F. K. Bangash, D. H. Fairbrother and W. P. Ball, Langmuir, 2010, 26, 967–981 CrossRef CAS PubMed.
  12. X. Ren, C. Chen, M. Nagatsu and X. Wang, Chem. Eng. J., 2011, 170, 395–410 CrossRef CAS PubMed.
  13. X. Tan, M. Fang, C. Chen, S. Yu and X. Wang, Carbon, 2008, 46, 1741–1750 CrossRef CAS PubMed.
  14. H. Chen, J. Li, D. Shao, X. M. Ren and X. K. Wang, Chem. Eng. J., 2012, 210, 475–481 CrossRef CAS PubMed.
  15. Q. Wang, X. K. Wang, Z. F. Chai and W. P. Hu, Chem. Soc. Rev., 2013, 42, 8821–8834 RSC.
  16. S. Agnihotri, M. J. Rood and M. Rostam-Abadi, Carbon, 2005, 43, 2379 CrossRef CAS PubMed.
  17. P. Zong, S. Wang, Y. Zhao, H. Wang, H. Pan and C. He, Chem. Eng. J., 2013, 220, 45–52 CrossRef CAS PubMed.
  18. M. A. Salam, G. Al-Zhrani and S. A. Kosa, C. R. Chim., 2012, 15, 398–408 CrossRef CAS PubMed.
  19. E. Salehi, S. S. Madaeni, L. Rajabi, A. A. Derakhshan, S. Daraei and V. Vatanpour, Chem. Eng. J., 2013, 791–801 CrossRef CAS PubMed.
  20. M. Zhu and G. Diao, Nanoscale, 2011, 3, 2748–2767 RSC.
  21. C. Cunha, S. Panseri, D. Iannazzo, A. Piperno, A. Pistone, M. Fazio, A. Russo, M. Marcacci and S. Galvagno, Nanotechnology, 2012, 23, 465102 CrossRef CAS PubMed.
  22. L. Ji, L. Zhou, X. Bai, Y. Shao, G. Zhao, Y. Qu, C. Wang and Y. Li, J. Mater. Chem., 2012, 22, 15853 RSC.
  23. P. Xu, G. M. Zeng, D. L. Huang, C. L. Feng, S. Hu, M. H. Zhao, C. Lai, Z. Wei, C. Huang, G. X. Xie and Z. F. Liu, Sci. Total Environ., 2012, 424, 1–10 CrossRef CAS PubMed.
  24. V. K. Gupta, R. Kumar, A. Nayak, T. A. Saleh and M. A. Barakat, Adv. Colloid Interface Sci., 2013, 193–194, 24–34 CrossRef CAS PubMed.
  25. X. G. Li, M. R. Huang, W. Duan and Y. L. Yang, Chem. Rev., 2002, 102, 2925–3030 CrossRef CAS PubMed.
  26. L. M. Bronstein, X. Huang, J. Retrum, A. Schmucker, M. Pink, B. D. Stein and B. Dragnea, Chem. Mater., 2007, 19, 3624–3632 CrossRef CAS.
  27. J. Wan, W. Cai, J. Feng, X. Meng and E. Liu, J. Mater. Chem., 2007, 17, 1188 RSC.
  28. L. Stobinski, B. Lesiak, L. Kövér, J. Tóth, S. Biniak, G. Trykowski and J. Judek, J. Alloys Compd., 2010, 501, 77–84 CrossRef CAS PubMed.
  29. L. Chai, L. Zhang, H. Wang, W. Yu and P. Sang, Mater. Lett., 2010, 64, 2302–2305 CrossRef CAS PubMed.
  30. W. Jiang, M. Pelaez, D. D. Dionysiou, M. H. Entezari, D. Tsoutsou and K. O'Shea, Chem. Eng. J., 2013, 222, 527–533 CrossRef CAS PubMed.
  31. S. K. Sahu, V. K. Verma, D. Bagchi, V. Kumar and B. D. Pandey, Indian J. Chem. Technol., 2008, 15, 397–402 CAS.
  32. H. Qian, Y. Hu, Y. Liu, M. Zhou and C. Guo, Mater. Lett., 2012, 68, 174–177 CrossRef CAS PubMed.
  33. Y. Sun, Q. Yue, B. Gao, Y. Gao, Q. Li and Y. Wang, Chem. Eng. J., 2013, 217, 240–247 CrossRef CAS PubMed.
  34. J. Febrianto, A. N. Kosasih, J. Sunarso, Y. H. Ju, N. Indraswati and S. Ismadji, J. Hazard. Mater., 2009, 162, 616–645 CrossRef CAS PubMed.
  35. B. E. Reed and M. R. Matsumoto, Sep. Sci. Technol., 1993, 28, 2179–2195 CrossRef CAS.
  36. D. Duranoğlu, A. W. Trochimczuk and U. Beker, Chem. Eng. J., 2012, 187, 193–202 CrossRef PubMed.
  37. X.-Z. Chu, Y.-J. Zhao, Y.-H. Kan, W.-G. Zhang, S.-Y. Zhou, Y.-P. Zhou and L. Zhou, Chem. Eng. J., 2009, 152, 428–433 CrossRef CAS PubMed.
  38. Y. Zhang, Y. Li, L. Q. Yang, X. J. Ma, L. Y. Wang and Z. F. Ye, J. Hazard. Mater., 2010, 178, 1046–1054 CrossRef CAS PubMed.
  39. J. Hu, C. Chen, X. Zhu and X. Wang, J. Hazard. Mater., 2009, 162, 1542–1550 CrossRef CAS PubMed.
  40. J. Wang, K. Pan, Q. He and B. Cao, J. Hazard. Mater., 2013, 244–245, 121–129 CrossRef CAS PubMed.
  41. Y. S. Ho and G. McKay, Chem. Eng. J., 1998, 70, 115–124 CrossRef CAS.
  42. W. H. Cheung, Y. S. Szeto and G. McKay, Bioresour. Technol., 2007, 98, 2897–2904 CrossRef CAS PubMed.
  43. C. S. Sundaram, N. Viswanathan and S. Meenakshi, J. Hazard. Mater., 2008, 155, 206–215 CrossRef CAS PubMed.
  44. N. Li, Z. Mei and X. Wei, Chem. Eng. J., 2012, 192, 138–145 CrossRef CAS PubMed.
  45. A. Sari, M. Tuzen, D. Citak and M. Soylak, J. Hazard. Mater., 2007, 149, 283–291 CrossRef CAS PubMed.
  46. R. Han, Z. Lu, W. Zou, W. Daotong, J. Shi and Y. Jiujun, J. Hazard. Mater., 2006, 137, 480–488 CrossRef CAS PubMed.
  47. V. K. Gupta, D. Pathania, S. Sharma and P. Singh, J. Colloid Interface Sci., 2013, 401, 125–132 CrossRef CAS PubMed.
  48. W. Yu, L. Zhang, H. Wang and L. Chai, J. Hazard. Mater., 2013, 260, 789–795 CrossRef CAS PubMed.
  49. Y. Li, S. Zhu, Q. Liu, Z. Chen, J. Gu, C. Zhu, T. Lu, D. Zhang and J. Ma, Water Res., 2013, 47, 4188–4197 CrossRef CAS PubMed.
  50. X. Yuan, Y. Wang, J. Wang, C. Zhou, Q. Tang and X. Rao, Chem. Eng. J., 2013, 221, 204–213 CrossRef CAS PubMed.
  51. Y. G. Abou El-Reash, M. Otto, I. M. Kenawy and A. M. Ouf, Int. J. Biol. Macromol., 2011, 49, 513–522 CrossRef CAS PubMed.
  52. Y. Zeng, H. Woo, G. Lee and J. Park, Microporous Mesoporous Mater., 2010, 130, 83–91 CrossRef CAS PubMed.
  53. S. Gupta and B. V. Babu, Chem. Eng. J., 2009, 150, 352–365 CrossRef CAS PubMed.
  54. N. K. Lazaridis, D. N. Bakoyannakis and E. A. Deliyanni, Chemosphere, 2005, 58, 65–73 CrossRef CAS PubMed.
  55. S. Deng and R. Bai, Water Res., 2004, 38, 2423–2431 CrossRef PubMed.
  56. A. Santhana Krishna Kumar, S. Singh Kakan and N. Rajesh, Chem. Eng. J., 2013, 230, 328–337 CrossRef PubMed.

Footnote

Electronic supplementary information (ESI) available. See DOI: 10.1039/c4ra10282g

This journal is © The Royal Society of Chemistry 2015