Fabrication and electrochemical characterization of Pt–Pd impregnated nanocomposite polymer electrolyte membranes for high concentration DMFCs
Sethu Sundar Pethaiah†
*ab,
Mani Ulaganathan†b,
Mangalaraja Ramalinga Viswanathan†c and
Siew Hwa Chan†*b
aTechnische Universität München – Campus for Research Excellence and Technological Enterprise, 1 CREATE Way, Singapore 138602, Singapore
bEnergy Research Institute @NTU, Nanyang Technological University, 50 Nanyang Drive, Singapore 637553, Singapore. E-mail: sundar.pethaiah@tum-create.edu.sg; mschan@ntu.edu.sg; Fax: +65 68969950; Tel: +65 65923013
cAdvanced Ceramics and Nanotechnology Laboratory, Department of Materials Engineering, University of Concepcion, Concepcion 407-0409, Chile
First published on 26th November 2014
Abstract
Bimetallic Pt–Pd impregnated nanocomposite polymer electrolyte membranes were prepared and the influence of Pd on Pt was evaluated towards a single cell performance. The fabricated membranes were characterised by X-ray Diffraction (XRD) and Field-Emission Scanning Electron Microscopy (FESEM) accompanied with Energy Dispersive X-ray (EDX) spectroscopy for identifying the structural and morphological characteristics, respectively. It was observed that the particle size of the bimetallic particle increased with the increase in Pd content; the bimetallic particles were uniformly deposited in a closely packed structure on the membrane surface. The performance of direct methanol fuel cells (DMFC) with normal membrane electrode assembly (MEA) and Pt–Pd impregnated nanocomposite with various compositions were studied for different methanol concentrations. Pt–Pd nanocomposite MEA with 76.91![[thin space (1/6-em)]](https://www.rsc.org/images/entities/char_2009.gif) :
:![[thin space (1/6-em)]](https://www.rsc.org/images/entities/char_2009.gif) 23.09 of atomic ratio exhibited an optimal performance with the maximum power density of 52.5 mW cm−2. The result was benchmarked with MEA using commercially available Pt/C catalyst.
23.09 of atomic ratio exhibited an optimal performance with the maximum power density of 52.5 mW cm−2. The result was benchmarked with MEA using commercially available Pt/C catalyst.
1. Introduction
The rising global energy demand and the environmental impact of energy utilization from conventional sources pose serious challenges to environmental protection and the sustainability of natural resources. Hence, in recent years there has been a significant increase in research and development activities towards renewable energy. Among the variants, fuel cells are expected to play an increasingly important role in the future because of their high fuel conversion efficiency and environmental compatibility. In particularly, direct methanol fuel cell (DMFC) is a promising candidate for portable electronic devices and electric vehicles (EV) applications, because DMFC is a low-temperature energy conversion device with a simple design and virtually do not need any fuel reformer. Methanol is easily handled, stored and possibly can be derived from renewable sources. Moreover, methanol has high volumetric energy density (4.82 kW h L−1) compared to pressurized hydrogen (0.18 kW h L−1 at 1000 psi, 25 °C).1 However, some issues such as cost and durability are the major concerns of DMFC, particularly sluggish methanol oxidations and methanol crossover from anode to cathode side of DMFC. These issues might be overcome before the commercialization can take place.2–5Membrane electrode assembly (MEA) is a key component to improve sluggish methanol oxidations and to reduce methanol crossover. As a result many research groups are working in the MEA development, though significant progress has been achieved in MEA development for DMFCs during the last decade,3–10 yet there is a scope for research to develop a better methanol impermeable MEA with high electrode activity and stability. It is well known that Platinum (Pt) shows highest activity and stability for alcohol oxidation in acid medium, but it is easily poisoned by the CO intermediates formed in this reaction.11 Moreover, cost and availability of Pt limits its usage in fuel cells. Hence, an attempt has been made to develop a multifunctional MEA to solve methanol crossover as well as sluggish methanol oxidations reaction (MOR) with a suitable catalyst.
There are number of catalyst systems including Pt–Ru, Pt–Sn, Pt–Rh, Pt–Mo, Pt–Pd, Pd–Ni and composite membrane for DMFC have been investigated.3,4,12 Among them, our literature review revealed that the preparation of Pt–Pd impregnated nanocomposite polymer electrolyte membrane (PEM) by the non-equilibrium impregnation-reduction (NEIR) method is a promising method to achieve a multifunctional purpose as stated above.13,14 The fabrication of Pt–Pd impregnated nano-composite PEM is a simple process making it attractive for catalyst layer preparation. The electrodes prepared by this method are few microns thickness, hydrophilic, porous and they exhibit excellent adhesion and durability.3 Moreover, Pd is impermeable to methanol and its synergistic effect between Pt and Pd enhances the electrocatalytic activity towards methanol oxidation reaction.6–8 The presence of Palladium dilutes the Pt sites and prevents the presence of three adjacent sites that are necessary for the adsorption of poison species on the electrode surface. This leads to the overall enhancement of methanol oxidations. The bifunctional mechanism of Pt–Pd nanoparticle is explained below,15
| Pt + CH3OH → Pt-(CO)ads + 4H+ + 4e− | (1) |
 | (2) |
To the best of our understanding, no work has been studied on the Pt–Pd impregnated nano-composite PEMs by non-equilibrium impregnation-reduction method for DMFC applications. Hence, in this study Pt–Pd impregnated nano-composite PEMs was prepared and the effect of Pd on Pt was evaluated towards a single cell performance and compared with commercial Pt/C catalyst.
2. Experimental procedure
Proton exchange membrane (Nafion 117 DuPont) and high-purity chemicals such as Pt (NH3)4C12 (Johnson Matthey), Pd (NH3)4Cl2 (Johnson Matthey), NaBH4 (Merck), H2SO4 (Merck), H2O2 (Merck), NaOH (Merck), carbon powder (Cabot corporation), Nafion ionomer (Dupont), 40%Pt/C (Duralyst, USA), carbon cloth (Ballard) and CH3OH (Merck) were used in the experimental work.2.1. Membrane pre-treatment
The Nafion membrane with 183 μm in thickness was pre-treated using 5 wt% aqueous H2O2 solution for 30 min at 80 °C and washed repeatedly with deionized water. To convert the membrane into Na+ form, it was treated with 0.5 M NaCl at 80 °C for 30 min and rinsed repeatedly with deionized water. The treated membrane was dried for 12 h under vacuum at a constant temperature of 80 °C. The initial weight of the treated membrane was obtained to determine the amount of Pt–Pd loading on the membrane surface.102.2. Preparation of Pt–Pd composite membrane
Three different atomic ratios of the Pt–Pd (Pt![[thin space (1/6-em)]](https://www.rsc.org/images/entities/char_2009.gif) :
:![[thin space (1/6-em)]](https://www.rsc.org/images/entities/char_2009.gif) Pd of 90
Pd of 90![[thin space (1/6-em)]](https://www.rsc.org/images/entities/char_2009.gif) :
:![[thin space (1/6-em)]](https://www.rsc.org/images/entities/char_2009.gif) 10, 70
10, 70![[thin space (1/6-em)]](https://www.rsc.org/images/entities/char_2009.gif) :
:![[thin space (1/6-em)]](https://www.rsc.org/images/entities/char_2009.gif) 30, 50
30, 50![[thin space (1/6-em)]](https://www.rsc.org/images/entities/char_2009.gif) :
:![[thin space (1/6-em)]](https://www.rsc.org/images/entities/char_2009.gif) 50) impregnated nano-composite membranes were prepared by using non-equilibrium impregnation-reduction (NEIR) method13,14 and donated as A1, A2 and A3 respectively. Pt (NH3)4C12 and Pd (NH3)4C12 were used as Pt and Pd precursors, respectively. In NEIR method, one side of the membrane was placed to face the methanol–water (1
50) impregnated nano-composite membranes were prepared by using non-equilibrium impregnation-reduction (NEIR) method13,14 and donated as A1, A2 and A3 respectively. Pt (NH3)4C12 and Pd (NH3)4C12 were used as Pt and Pd precursors, respectively. In NEIR method, one side of the membrane was placed to face the methanol–water (1![[thin space (1/6-em)]](https://www.rsc.org/images/entities/char_2009.gif) :
:![[thin space (1/6-em)]](https://www.rsc.org/images/entities/char_2009.gif) 3) mixture of impregnation solution with appropriate Pt and Pd precursors concentrations. After the impregnation process, the reducing process follows with 10 mM of NaBH4 at pH 13 for 2 h. The solutions were stirred in both steps at 190 rpm and 50 °C. Finally, the Pt–Pd nanocomposite membranes were soaked in 0.5 M H2SO4 for 1 h followed by deionized water rinsing for 1 h and then dried and weighed. For comparative evaluations Pt- impregnated nanocomposite membrane also prepared.10 The resulting amount of catalyst loading was 2 mg cm−2, the catalyst loading was controlled by impregnation time. All impregnated composite membranes were stored in highly evacuated desiccators and used as the anode of DMFC.
3) mixture of impregnation solution with appropriate Pt and Pd precursors concentrations. After the impregnation process, the reducing process follows with 10 mM of NaBH4 at pH 13 for 2 h. The solutions were stirred in both steps at 190 rpm and 50 °C. Finally, the Pt–Pd nanocomposite membranes were soaked in 0.5 M H2SO4 for 1 h followed by deionized water rinsing for 1 h and then dried and weighed. For comparative evaluations Pt- impregnated nanocomposite membrane also prepared.10 The resulting amount of catalyst loading was 2 mg cm−2, the catalyst loading was controlled by impregnation time. All impregnated composite membranes were stored in highly evacuated desiccators and used as the anode of DMFC.
2.3. Preparations of membrane electrode assembly (MEA) for DMFC
The Pt–Pd nanocomposite MEA was prepared by hot pressing the Pt–Pd coated Nafion membrane between the two gas diffusion electrodes with 1 mg cm−2 of 40% Pt/C catalyst on anode side and 3 mg cm−2 of Pt black on cathode side at 120 °C with a pressure of 1000 psi for 5 min. Pt–Pd was deposited on one side of Nafion membrane and used as the anode of DMFC (Fig. 1). To prepare the gas diffusion electrode, the catalyst was suspended in water and ultrasonicated by adding isopropyl alcohol and 5 wt% of Nafion ionomer. The obtained slurry was coated on the teflonised carbon cloth. Adding another layer of 40% Pt/C with Nafion ionomer helps to insure good current collection from the thin Pt–Pd catalyzed layer and provide good contact with the gas diffusion layer. It also provided some additional catalytic activity.16 For comparative evaluations, a normal MEA was prepared with 3 mg cm−2 of 40% Pt/C for anode side and 3 mg cm−2 of Pt black for cathode side. All MEAs anode side gas diffusion electrodes were hot pressed with uniform pores (Fig. 2). To facilitate the comparative study, the total loading of electrocatalyst, hot-pressing parameters, and geometrical area of electrodes (5 cm2) were kept constant.2.4. Structural characterizations
X-ray diffraction (XRD) patterns of Pt–Pd nanocomposite membranes were acquired at room temperature with X'pert PRO PANalytical diffractometer using Cu-kα radiation as the source and operated at 40 kV. The sample was scanned in the 2θ ranging from 10 to 80° for 2 s in the step-scan mode. Surface morphology, cross-sectional view and the chemical composition of the Pt–Pd impregnated nanocomposite membranes were characterized using field emission scanning electron microscopy (FESEM, Horiba, EMAX) with an energy dispersive X-ray spectroscopy (EDX) analyzer (JEOL JSM-6400).2.5. Single cell assembly and electrochemical characterizations
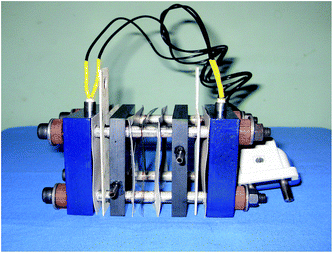
Single cell experiments were performed by placing Pt–Pd nanocomposite MEA between two silicone rubber gaskets with the thickness of 0.25 mm and inserted in between two serpentine grooved graphite plates with 5 cm2 active area (Fig. 3). The fixture parts were clamped together using bolts and nuts by applying uniform torque to assemble the single cell (Fig. 4). Provision was made to heat the cell with temperature control. Inlet and exit ports were available for feeding the reactants and removal of products. For comparative study, single cell using MEA with commercial catalyst and Pt- impregnated nanocomposite membrane also assembled. To facilitate the comparative evaluations, all parameters are kept constant. 2 M and 6 M concentration of aqueous methanol and oxygen were supplied to the anode and cathode side of the single cell respectively. Single cell performances were tested over the range of temperature, 30–80 °C under the pressure of 2 bars at cathode side. The cell was connected to the DC electronic load bank for the polarisation studies.3. Results and discussions
3.1. Structural characterizations
| Sample code | Metal compositions in solution (at. %) | XRD | EDX | |
|---|---|---|---|---|
| Average particle size (nm) | Metal compositions (at. %) | Metal compositions (wt%) | ||
| A1 | Pt–Pd (90![[thin space (1/6-em)]](https://www.rsc.org/images/entities/char_2009.gif) : :![[thin space (1/6-em)]](https://www.rsc.org/images/entities/char_2009.gif) 10) 10) |
5.4 | 94.61![[thin space (1/6-em)]](https://www.rsc.org/images/entities/char_2009.gif) : :![[thin space (1/6-em)]](https://www.rsc.org/images/entities/char_2009.gif) 5.39 5.39 |
96.98![[thin space (1/6-em)]](https://www.rsc.org/images/entities/char_2009.gif) : :![[thin space (1/6-em)]](https://www.rsc.org/images/entities/char_2009.gif) 3.02 3.02 |
| A2 | Pt–Pd (70![[thin space (1/6-em)]](https://www.rsc.org/images/entities/char_2009.gif) : :![[thin space (1/6-em)]](https://www.rsc.org/images/entities/char_2009.gif) 30) 30) |
5.7 | 76.91![[thin space (1/6-em)]](https://www.rsc.org/images/entities/char_2009.gif) : :![[thin space (1/6-em)]](https://www.rsc.org/images/entities/char_2009.gif) 23.09 23.09 |
85.93![[thin space (1/6-em)]](https://www.rsc.org/images/entities/char_2009.gif) : :![[thin space (1/6-em)]](https://www.rsc.org/images/entities/char_2009.gif) 14.07 14.07 |
| A3 | Pt–Pd (50![[thin space (1/6-em)]](https://www.rsc.org/images/entities/char_2009.gif) : :![[thin space (1/6-em)]](https://www.rsc.org/images/entities/char_2009.gif) 50) 50) |
6.7 | 62.55![[thin space (1/6-em)]](https://www.rsc.org/images/entities/char_2009.gif) : :![[thin space (1/6-em)]](https://www.rsc.org/images/entities/char_2009.gif) 37.45 37.45 |
75.39![[thin space (1/6-em)]](https://www.rsc.org/images/entities/char_2009.gif) : :![[thin space (1/6-em)]](https://www.rsc.org/images/entities/char_2009.gif) 24.61 24.61 |
3.2. Electrochemical characterizations
![[thin space (1/6-em)]](https://www.rsc.org/images/entities/char_2009.gif) :
:![[thin space (1/6-em)]](https://www.rsc.org/images/entities/char_2009.gif) 23.09 ratio exhibited the maximum power density of 52.5 mW cm−2, whereas, it was about 45.87 mW cm−2 for normal MEA and 47 mW cm−2 for Pt impregnated nanocomposite MEA at 2 M methanol at 80 °C. The open circuit voltage (OCV) of sample A3 is higher than sample A2; however, sample A2 showed better performance than sample A3, this is mainly due to companied effect of larger particle size and insignificant catalytic activity of Pt–Pd catalyst in sample A3. The high OCV suggested that the methanol crossover was reduced and therefore the mixed potential at the cathode possibly decreased, the reduced methanol crossover in sample A3 is probably due to larger particle size;23 however, increasing amount of Pd in sample A3 deteriorates the DMFC performance which was due to the insignificant catalytic activity of pure Pd in the catalyst layer.11 Hence sample A3 demonstrates higher OCV and reduced performance than other samples.
23.09 ratio exhibited the maximum power density of 52.5 mW cm−2, whereas, it was about 45.87 mW cm−2 for normal MEA and 47 mW cm−2 for Pt impregnated nanocomposite MEA at 2 M methanol at 80 °C. The open circuit voltage (OCV) of sample A3 is higher than sample A2; however, sample A2 showed better performance than sample A3, this is mainly due to companied effect of larger particle size and insignificant catalytic activity of Pt–Pd catalyst in sample A3. The high OCV suggested that the methanol crossover was reduced and therefore the mixed potential at the cathode possibly decreased, the reduced methanol crossover in sample A3 is probably due to larger particle size;23 however, increasing amount of Pd in sample A3 deteriorates the DMFC performance which was due to the insignificant catalytic activity of pure Pd in the catalyst layer.11 Hence sample A3 demonstrates higher OCV and reduced performance than other samples.
When 6 M methanol was used (Fig. 8), the maximum power density of Pt–Pd nanocomposite MEA was ∼1.91 times higher than that of the normal MEA. It was also noted that the maximum power density of Pt–Pd impregnated nanocomposite MEA was marginally increased or remained unchanged with further increasing in methanol concentrations, while the maximum power density of normal MEA was decreased dramatically. This is mainly due to the combined effect of methanol crossover and increase in catalytic activity of Pt–Pd nanocomposite MEA, the methanol crossover not only results in a loss of fuel but also creates a mixed potential at the cathode, leading to a lower overall cell performance.9 In addition Pt–Pd nanocomposite MEA shows better performance than Pt nanocomposite MEA, which also confirms the catalytic activity of Pd. However, Pt nanocomposite MEA demonstrates better performance than normal MEA, this behaviour could be explained by the effect of the electrode structure. The particular structure of the catalyzed membrane could result in higher catalyst utilization with respect to the normal ones, as previously suggested in the literature for different systems.24
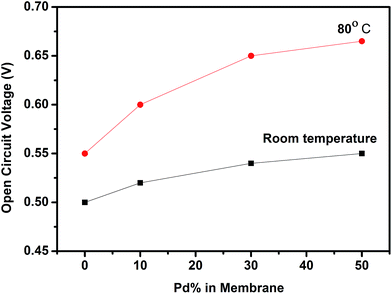
Fig. 9 shows the open circuit voltage (OCV) of normal MEA and various compositions of Pt–Pd impregnated nanocomposite MEA fed with 2 M of methanol at room temperature and 80 °C. As shown in Fig. 9, the OCV values increased gradually with an increase in Pd content in membrane, this is due to reduced methanol crossover.25 The methanol crossover through the membrane causes a significant reduction of the cathode potential due to the direct oxidation of methanol at the cathode catalyst. This side reaction leads to the larger mixed potential; as a result in a decreased value of the OCV.26,27 The OCV values increases with increasing temperature, however the increasing potential difference of normal MEA is lower than Pt–Pd composite membrane, this phenomenon support the hypothesis that the Pd is impermeable to methanol and selectively transport the hydrogen ions. It is well accepted fact that Palladium is effective hydrogen storage medium and can easily form Palladium hydride.28 The close packed structures of metal hydrides prevents permeation of larger molecules such as methanol and water without decreasing the proton transfer rate,29 this synergistic effect reduces the methanol crossover and enhances the electrocatalytic activity towards methanol oxidation reaction. The mechanism of methanol crossover inhibition is generally explained below,30 the impregnated metal block the passage of methanol molecules and as discussed above the proton can easily pass through the metal barriers according to the following reactions,
| H+ + e− → MH | (3) |
| MH → M + H+ + e− | (4) |
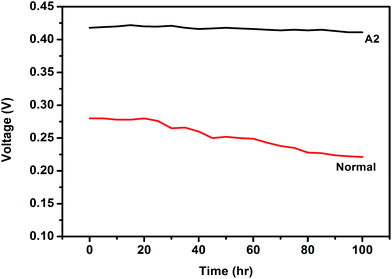
The stability of the Pt–Pd (at % 76.91![[thin space (1/6-em)]](https://www.rsc.org/images/entities/char_2009.gif) :
:![[thin space (1/6-em)]](https://www.rsc.org/images/entities/char_2009.gif) 23.09) impregnated nanocomposite PEM i.e., sample A2 and normal MEA were studied at an intermittent discharge rate for 100 h. Fig. 10 shows the voltage vs. time characteristics of DMFC under a constant current density of 100 mA cm−2 at 80 °C. The cell voltage of sample A2 increased slowly initially with increase time and then reached a steady state value about 0.411 V at 100 mA cm−2. During 100 h of operation, no performance degradation was observed except a mild voltage fluctuation. In contrast, a drastic voltage drop was observed for the normal MEA over the 100 h of operation. The obtained results were well comparable with the performances of the various catalyst impregnated membranes3,7,31,32 and the comparisons are given in Table 2.
23.09) impregnated nanocomposite PEM i.e., sample A2 and normal MEA were studied at an intermittent discharge rate for 100 h. Fig. 10 shows the voltage vs. time characteristics of DMFC under a constant current density of 100 mA cm−2 at 80 °C. The cell voltage of sample A2 increased slowly initially with increase time and then reached a steady state value about 0.411 V at 100 mA cm−2. During 100 h of operation, no performance degradation was observed except a mild voltage fluctuation. In contrast, a drastic voltage drop was observed for the normal MEA over the 100 h of operation. The obtained results were well comparable with the performances of the various catalyst impregnated membranes3,7,31,32 and the comparisons are given in Table 2.
4. Conclusion
Pt–Pd bimetallic catalyst was successfully deposited directly onto the polymer electrolyte membrane by NEIR method; the optimized Pt–Pd ratio was found to be in molar ratio of 76.91![[thin space (1/6-em)]](https://www.rsc.org/images/entities/char_2009.gif) :
:![[thin space (1/6-em)]](https://www.rsc.org/images/entities/char_2009.gif) 23.09. The performance of DMFC was found to increase with Pd amount on the membrane, for a quick overview Pt–Pd nanocomposite MEA with 76.91
23.09. The performance of DMFC was found to increase with Pd amount on the membrane, for a quick overview Pt–Pd nanocomposite MEA with 76.91![[thin space (1/6-em)]](https://www.rsc.org/images/entities/char_2009.gif) :
:![[thin space (1/6-em)]](https://www.rsc.org/images/entities/char_2009.gif) 23.09 ratio exhibits a peak power density of 52.5 mW cm−2 with stable voltage of 0.411 V over 100 h when loaded with 100 mA cm−2. This enhanced performance of DMFC is due to the reduced methanol crossover and improved catalytic activity of Pt–Pd impregnated nanocomposite membrane; it was also allowed the DMFC to operate at high concentration (6 M) of Methanol. Hence, it was concluded that Pt–Pd impregnated nanocomposite membranes prepared by NEIR method can also be a very good option for reducing the methanol crossover in DMFC.
23.09 ratio exhibits a peak power density of 52.5 mW cm−2 with stable voltage of 0.411 V over 100 h when loaded with 100 mA cm−2. This enhanced performance of DMFC is due to the reduced methanol crossover and improved catalytic activity of Pt–Pd impregnated nanocomposite membrane; it was also allowed the DMFC to operate at high concentration (6 M) of Methanol. Hence, it was concluded that Pt–Pd impregnated nanocomposite membranes prepared by NEIR method can also be a very good option for reducing the methanol crossover in DMFC.
Acknowledgements
One of the author R. V. Mangalaraja acknowledges FONDECYT (no. 1130916) and CONICYT-Programa de Energia (no. PASANTIA0027; ID FAST 2750), Government of Chile for the support.References
- H. Liu and J. Zhang, Electrocatalysis of Direct Methanol Fuel Cells, WILEY-VCH, 2009 Search PubMed.
- F. Alcaide, G. Alvarez, P. L. Cabot, H. J. Grande, O. Miguel and A. Querejeta, Int. J. Hydrogen Energy, 2011, 36, 4432–4439 CrossRef CAS PubMed.
- N. Fujiwara, K. Yasuda, T. Ioroi, Z. Siroma and Y. Miyazaki, Electrochim. Acta, 2002, 47, 4079–4084 CrossRef CAS.
- Z. Zuo, X. Zhao and A. Manthiram, RSC Adv., 2013, 3, 6759–6762 RSC.
- M. M. H. Sadrabadi, E. Dashtimoghadam, F. S. Majedi, S. Wu, A. Bertsch and H. Moaddelc, RSC Adv., 2013, 3, 7337–7346 RSC.
- T. Hejze, B. R. Gollas, R. K. Sauerbrey, M. Schmied, F. Hofer and J. O. Besenhard, J. Power Sources, 2005, 140, 21–27 CrossRef CAS PubMed.
- Y. J. Kim, W. C. Choi, S. I. Woo and W. H. Hong, Electrochim. Acta, 2004, 49, 3227–3234 CrossRef CAS PubMed.
- T. Arikan, A. M. Kannan and F. Kadirgan, Int. J. Hydrogen Energy, 2013, 38, 2900–2907 CrossRef CAS PubMed.
- P. Dimitrova, K. A. Friedrich and U. Stimming, Solid State Ionics, 2002, 150, 115–122 CrossRef CAS.
- S. S. Pethaiah, S. Gangadharan, S. H. Chan and U. Stimming, J. Power Sources, 2014, 254, 161–167 CrossRef PubMed.
- F. Alcaide, G. Alvarez, P. L. Cabot, H. J. Grande, O. Miguel and A. Querejeta, Int. J. Hydrogen Energy, 2011, 36, 4432–4439 CrossRef CAS PubMed.
- F. Kadirgan, S. Beyhan and T. Atilan, Int. J. Hydrogen Energy, 2009, 34, 4312–4320 CrossRef CAS PubMed.
- R. Liu, W. H. Her and P. S. Fedkiw, J. Electrochem. Soc., 1992, 139, 15–23 CrossRef CAS PubMed.
- P. S. Fedkiw Jr, US pat., Pat No 4959132, Raleigh, 1990.
- V. Selvaraj, M. Alagar and I. Hamerton, J. Power Sources, 2006, 160, 940–948 CrossRef CAS PubMed.
- Y. Song, Y. Wei, H. Xu, M. Williams, Y. Liu, L. J. Bonville, H. R. Kunz and J. M. Fenton, J. Power Sources, 2005, 141, 250 CrossRef CAS PubMed.
- M. Ludvigsson, J. Lindgren and J. Tegenfeldt, J. Electrochem. Soc., 2000, 147, 1303 CrossRef CAS PubMed.
- Q. Huang, H. Yang, Y. Tang, T. Lu and L. A. Daniel, Electrochem. Commun., 2006, 8, 1220–1224 CrossRef CAS PubMed.
- S. Thanasilp and M. Hunsom, Renewable Energy, 2011, 36, 1795–1801 CrossRef CAS PubMed.
- J. Y. Woo, K. M. Lee, B. C. Jee, C. H. Ryu, C. H. Yoon and J. H. Chung, J. Ind. Eng. Chem., 2010, 16, 688–697 CrossRef CAS PubMed.
- N. Rajalakshmi, H. Ryua and K. S. Dhathathreyan, Chem. Eng. J., 2004, 102, 241 CrossRef CAS PubMed.
- E. K. Tuseeva, A. A. Mikhailova, O. A. Khazova, V. A. Grinberg and K. D. Kourtakis, Russ. J. Electrochem., 2005, 41, 1316–1324 CrossRef CAS.
- L. Brandao, J. Rodrigues, L. M. Madeira and A. Mendes, Int. J. Hydrogen Energy, 2010, 3511561–3511567 Search PubMed.
- P. Millet, R. Durand and M. Pineri, Int. J. Hydrogen Energy, 1990, 15, 245–253 CrossRef CAS.
- S. Yousefi and M. Zohoor, Ionics, 2013, 19, 1195–1201 CrossRef CAS.
- P. C. Lee, T. H. Han, D. O. Kim, J. H. Lee, S. J. Kang, C. H. Chung, Y. Lee, S. M. Cho, H. G. Choi, T. Kim, E. Lee and J. D. Nam, J. Membr. Sci., 2008, 322, 441–445 CrossRef CAS PubMed.
- Y. M. Kim, K. W. Park, J. H. Choi, I. S. Park and Y. E. Sung, Electrochem. Commun., 2003, 5, 571–574 CrossRef CAS.
- W. C. Choi, J. D. Kim and S. I. Woo, J. Power Sources, 2001, 96, 411–414 CrossRef CAS.
- C. Pu, H. Wenhua, K. L. Ley and E. S. Smotkin, J. Electrochem. Soc., 1995, 142, L119–L120 CrossRef CAS PubMed.
- J. Prabhuram, T. S. Zhao, Z. X. Liang, H. Yang and C. W. Wong, J. Electrochem. Soc., 2005, 152, A1390–A1397 CrossRef CAS PubMed.
- W. C. Choi, J. D. Kim and S. I. Woo, Int. J. Hydrogen Energy, 2007, 32, 903–907 CrossRef PubMed.
- H. Sun, G. Sun, S. Wang, J. Liu, X. Zhao, G. Wang, H. Xu, S. Hou and Q. Xin, J. Membr. Sci., 2005, 259, 27–33 CrossRef CAS PubMed.
Footnote |
| † Equally contributed. |
| This journal is © The Royal Society of Chemistry 2015 |


