Cobalt phthalocyanine tetracarboxylic acid modified reduced graphene oxide: a sensitive matrix for the electrocatalytic detection of peroxynitrite and hydrogen peroxide

Ioana S. Hosu ab, Qian Wangac, Alina Vasilescud, Serban F. Peteu*b, Valentin Raditoiub, Svetlana Railianae, Vladimir Zaitsevef, Kostiantyn Turcheniuka, Qi Wangc, Musen Lic, Rabah Boukherrouba and Sabine Szunerits*a
aInstitut de Recherche Interdisciplinaire (IRI, USR 3078), Université Lille1, Parc de la Haute Borne, 50 Avenue de Halley, BP 70478, 59658 Villeneuve d'Ascq, France. E-mail: Sabine.Szunerits@iri.univ-lille1.fr
bNational Institute for R&D in Chemistry and Petrochemistry, Spl. Independentei 202, 060021 Bucharest, Romania. E-mail: serbanfpeteu@gmail.com
cKey Laboratory for Liquid–Solid Structural Evolution and Processing of Materials, Shandong University, Jinan 250061, China
dInternational Center of Biodynamics, 1B Intrarea Portocalelor, 060101, Bucharest, Romania
eDepartment of Analytical Chemistry, Taras Shevchenko National University of Kyiv, Volodymyrska str., 62a, 01601 Kyiv, Ukraine
fChemistry Department, Pontifical Catholic University of Rio de Janeiro, 225 Rua Marquês de São Vicente, 22451, Rio de Janeiro, Brazil

Received 4th September 2014 , Accepted 18th November 2014

First published on 21st November 2014


Abstract

The quantification of peroxynitrite (ONOO, PON) and hydrogen peroxide (H2O2) is intrinsically difficult as both species show similar oxidative features located within a narrow potential. The sub-second lifetime of ONOO at neutral pH further complicates the analysis. In this paper, we examine the electrocatalytic activity of cobalt phthalocyanine tetracarboxylic acid (CoPc–COOH) loaded reduced graphene oxide (rGO) films towards peroxynitrite and hydrogen peroxide detection. The rGO/CoPc–COOH matrix is synthesized by the reaction of graphene oxide (GO) and CoPc–COOH at 90 °C for 5 h under ultrasonication. The integration of CoPc–COOH and the reduction of GO to rGO was confirmed by X-ray photoelectron spectroscopy, FTIR, Raman, UV-vis spectroscopy and electrochemistry. The rGO/CoPc–COOH film showed high electrocatalytic activity and specificity for ONOO at anodic potential with a sensitivity of ≈11.5 ± 1 nA nM−1 and a peroxynitrite detection limit of ≈1.7 nM. The rGO/CoPc–COOH films further exhibited electrocatalytic reduction of H2O2 with a sensitivity of 14.5 μA mM−1 and a detection limit of ≈60 μM for H2O2.

1. Introduction

Metallophthalocyanines (MPcs) are transition metal complexes with several characteristic properties that contribute in a major way to their extraordinary versatility. Actual applications include: electrochromic devices, components in analytical devices or electrocatalytic and photocatalytic processes.1 Most of the applications rely critically upon the redox properties of MPcs.2–7 Due to their macrocyclic nature with extended π-systems, phthalocyanines are capable of undergoing fast redox processes.8 The central metal ion may be inert to redox processes in the usual electrochemical regimes for transition metal species such as Ni(II) or may be a transition metal such as Fe(II) that undergoes a redox process at potentials comparable to the phthalocyanine ring processes. Most unsubstituted MPc species have only very limited solubility in virtually all solvents, thereby limiting solution phase redox measurements.9 Ring substitution and good choice of the right metal ion center have proven to be efficient procedures for rendering MPcs water soluble.10,11

One research area where MPcs have found a wide range of applications is their use as electrocatalysts in electrochemical sensors. Electrodes modified with phthalocyanine-based macrocycles have shown to be outstanding electrocatalytic sensors for a variety of analytes, including oxygen,12 hydrogen peroxide,13 peroxynitrite, nitrite,3,14,15 nitrate,16 nitric oxide (NO)7 and others.1 We have demonstrated that hemin, a protoporphyrin with an iron center, allows for a sensitive and selective detection of ONOO.17–19 Next to iron, cobalt is widely used as transition metal in phthalocyanine complexes (CoPc), where the catalytic behavior is related to Co(II)/Co(III) or Co(II)/Co(I) redox couples.20–22 One major limitation of electrodes modified by physically adsorbed CoPc is that the complex is detaching from the electrode surface with time and that the complex has relatively low conductivity. Host matrixes forming stable electrochemical active electrode interfaces are thus required. The unique electrical and electrochemical properties of reduced graphene oxide (rGO) makes this material an ideal host for CoPc complexes.22–24 Immobilization of cobalt phthalocyanine onto graphene and graphene oxide derivatives has been reported to result in bioelectrochemical platforms for the electrooxidation of L-cysteine,24 electrochemical reduction of tert-butylhydroperoxide,22 detection of glucose[thin space (1/6-em)]25 or the oxidation of nitrite.23 Yang et al. investigated recently the adsorption/intercalation of cobalt phthalocyanine onto/into graphene oxide layer and studied in detail the interaction between GO and CoPc.21

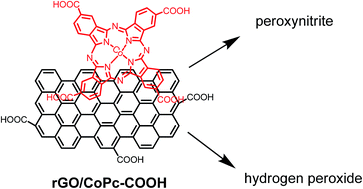
We examine in this paper the electrocatalytic activity of cobalt phthalocyanine tetracarboxylic acid (CoPc–COOH) (1) loaded reduced graphene oxide (rGO) films (Fig. 1A) towards peroxynitrite (ONOO, PON) and hydrogen peroxide (H2O2) detection, for the first time. The electrochemical detection of ONOO and H2O2 are complicated by the fact that both species show similar oxidative features located within a narrow potential range.26 The desire to study the key roles of both analytes in cellular signal transduction necessitates the development of an alternative sensing strategy. In addition, the accurate and rapid determination of hydrogen peroxide is of practical importance in various fields such as food, pharmaceutical, clinical, industrial and environmental analysis. A sensitive hydrogen peroxide sensor is also of prime interest for enzyme-based biosensing as hydrogen peroxide is the product of most oxidase enzyme reactions.27 The use of CoPc–COOH loaded rGO matrixes seems to be a step into these directions. This article discusses the fabrication of this matrix together with its sensitivity towards ONOO and H2O2.


image file: c4ra09781e-f1.tif
Fig. 1 (A) Synthesis of rGO/CoPc–COOH, (B) cyclic voltammogram of CoPc–COOH (1, 10 mM) in DMF/0.1 M TBATBF4, scan rate = 100 mV s−1 under argon (black), in air (blue).

2. Experimental part

2.1. Materials

Graphite powder (<20 micron), hydrogen peroxide (H2O2), sodium nitrite (NaNO2), sulfuric acid (H2SO4), dimethylsulfoxide (DMSO), potassium chloride (KCl), hydrazine monohydrate, sodium hydroxide (NaOH), ethanol, dimethyl formamide (DMF), ammonium chloride (NH4Cl), ammonium molybdate [(NH4)2MoO4], hydrochloric acid (HCl, 37%), urea, cobalt acetate tetrahydrate, trimellitic anhydride, potassium hydroxide (KOH), 3-(cyclohexylamino)-1-propanesulfonic acid (CAPS), tetrabutylammonium tetrafluoroborate (TBATBF4), CAPS buffer (pH 10), and manganese dioxide (MnO2) were purchased from Aldrich and used as received. Alumina (0.05 μm) and diamond (1 μm) polishing pastes were purchased from ALS, Japan. Glassy carbon electrodes (5 mm in diameter), platinum wire counter electrode and silver/silver chloride reference electrode were obtained from Cambria Scientific.

2.2. Synthesis of cobalt tetracarboxyl phthalocyanine CoPc–COOH (1)

Cobalt phthalocyanine tetracarboxylic acid (CoPc–COOH) was prepared in two steps similar to previous work.28–30 A mixture of trimellitic anhydride (5 g), cobalt acetate tetrahydrate (3.24 g), ammonium chloride (1 g), ammonium molybdate (0.5 g) and urea (10 g) was grounded in a ceramic mortar, transferred to a ceramic crucible and irradiated in a commercial microwave oven (EG 1031NP, 1000 W/2.45 GHz, Hyundai Guangdong, China) at 350 W power for 15 min mixing occasionally to homogenize the reaction mass. After reaction completion, the formed cobalt phthalocyanine tetracarboxamide was hydrolyzed by heating at 100 °C in an aqueous KOH solution (10 g, 90 cm3) for 600 min. The cobalt phthalocyanine tetracarboxylic acid (1) was formed, precipitated through the addition of HCl (37 wt%) and separated by filtration. All the inorganic compounds eventually present in the final product were removed by extraction in a Soxhlet apparatus using pure water. Yield: 62% after purification, 1H-NMR (400 MHz, DMSO-d6): δ 78.84–8.05 (m, 1H), 8.28 (s, 1H), 8.88–8.92 (m, 1H), 11.51 (br., s, 1H –COOH).31

2.3. Preparation of CoPc–COOH functionalized reduced graphene oxide (rGO/CoPc–COOH)

Graphene oxide (GO) was synthesized from graphite powder by a modified Hummers method.31 GO (1 mg mL−1) in DMF was mixed with CoPc–COOH (0.2–1 mg mL−1) dissolved in DMF and sonicated (464 W, 37 Hz) for 5 h at 90 °C. The precipitate formed at the end of the reaction was separated from the supernatant by centrifugation for 45 min at 14.000 rpm, washed three times with water and dried at 60 °C for 12 h.

2.4. Preparation of reduced graphene oxide using hydrazine

In a typical procedure, hydrazine hydrate (0.50 mL, 32.1 mM) was added to 5 mL of the yellow-brown GO aqueous suspension (0.5 mg mL−1) in a round bottom flask and heated in an oil bath at 100 °C for 24 h. During this time, the reduced GO gradually precipitated out of the solution. The product was isolated by filtration over a polyvinylidene difluoride (PVDF) membrane with a 0.45 μm pore size, washed copiously with water (5 × 20 mL) and methanol (5 × 20 mL), and dried in the oven at 60 °C for 6 h.32

2.5. Generation of peroxynitrite (ONOO)

2.5.1. From sodium nitrite. Peroxynitrite (PON) was synthesized as previously described.33 Briefly, a beaker containing sodium nitrite (1 M) is kept on ice with vigorous stirring. An ice-cold solution of hydrogen peroxide (1.2 M) in hydrochloric acid (0.1 M) was added rapidly, followed by ice-cold sodium hydroxide (7 M) to quench the reaction. Excess hydrogen peroxide was removed by passing the solution over manganese dioxide flakes. The obtained alkaline stock solution of peroxynitrite (pH = 13) was kept in the dark at −20 °C and used within a week. The concentration of the peroxynitrite stock solution was determined prior to each experiment by measuring the UV-vis absorbance at 302 nm (ε = 1670 L mol−1 cm−1).34
2.5.2. From 3-morpholino-syndonimine (SIN-1). 3-Morpholino-sydnonimine (SIN-1, stored at −20 °C) was used for the generation of peroxynitrite for each experiment; the stock solution was simply formed by mixing SIN-1 with deoxygenated PBS at pH 7.4 and room temperature. The SIN-1 complex releases both nitric oxide and superoxide in solution, in the presence of atmospheric oxygen with a 1/1 stoichiometry, and after reaching steady state, the PON is constant for at least 30–40 minutes, depending on specific experimental conditions.35–39

For chronoamperometric tests, a stock solution of 250 μM SIN-1 in deoxygenated PBS buffer (pH 7.4) was prepared and stored in leak-tight sealed vials. For cyclic voltammetric experiments, the stock solution concentration was 1 mM SIN-1 in deoxygenated PBS buffer (pH 7.4). A solution of SIN-1 (1 mM) releases peroxynitrite at a rate of 1 μM min−1. The ONOO concentration was assessed by UV-vis measurements at λ = 302 nm for ε302 = 1705 mol−1 cm−1 during, as well as after, every electroanalytical experiment, by adding a known aliquot of the stock solution to air-equilibrated PBS.40 The peak concentration linearly correlated with SIN-1 concentration, amounting to 1.2–3.6 % of added SIN-1. In between experiments, solutions were typically kept on ice to minimize any spontaneous degradation.

2.6. Electrode preparation

Glassy carbon electrodes (GCEs) were polished with alumina and diamond paste and then sonicated in a mixture of ethanol–acetone for 30 seconds before modification by drop casting 20 μL of rGO/CoPc–COOH two times (0.5 mg mL−1 in DMF), followed by drying in an oven at 60 °C for 30 min. after each deposition.

2.7. Instrumentation

2.7.1. X-Ray photoelectron spectroscopy. X-Ray photoelectron spectroscopy (XPS) experiments were performed on a PHl 5000 VersaProbe – Scanning ESCA Microprobe (ULVAC-PHI, Japan/USA) instrument at a base pressure below 5 × 10⁻⁹ mbar. Monochromatic AlKα radiation was used and the X-ray beam, focused to a diameter of 100 μm, was scanned on a 250 × 250 μm surface, at an operating power of 25 W (15 kV). Photoelectron survey spectra were acquired using a hemispherical analyzer at pass energy of 117.4 eV with a 0.4 eV energy step. Core-level spectra were acquired at pass energy of 23.5 eV with a 0.1 eV energy step. All spectra were acquired at 90° between X-ray source and analyzer and with the use of low energy electrons and low energy argon ions for charge neutralization. After subtraction of the Shirley-type background, the core-level spectra were decomposed into their components with mixed Gaussian–Lorentzian (30[thin space (1/6-em)]:[thin space (1/6-em)]70) shape lines using the CasaXPS software. Quantification calculations were performed using sensitivity factors supplied by PHI.
2.7.2. FTIR spectroscopy. Fourier transform infrared (FTIR) spectra were recorded using a ThermoScientific FTIR instrument (Nicolet 8700) at 4 cm−1. Dried rGO/CoPc–COOH (1 mg) was mixed with KBr powder (100 mg) in an agate mortar. The mixture was pressed into a pellet under 10 tons load for 2–4 min, and the spectrum was recorded immediately. Sixteen accumulative scans were collected. The signal from a pure KBr pellet was substracted as the background.
2.7.3. UV-vis measurements. Absorption spectra were recorded using a Jasco V-570 UV/VIS/NIR Spectrophotometer from Jasco Int. Co. Ltd., Tokyo, Japan in the 200–800 nm range.
2.7.4. Raman spectroscopy. Micro-Raman spectroscopy measurements were performed at room temperature with a Horiba Jobin Yvon LabRam HR800 spectrometer (λ = 633 nm). The scattered light is collected by the same objective in backscattering configuration and detected by a CCD.
2.7.5. Electron microscopy. Scanning electron microscopy (SEM) images were obtained using an FEI Nova NanoSEM 450 scanning electron microscope equipped with a FEG (field emission gun, Schottky type) system. The transmission electron microscopy (TEM) images were acquired using a JEOL JEM-2100 (JEOL, Japan) transmission electron microscope operating at an acceleration voltage of 200 kV. The samples were drop-coated from ethanolic dispersion of rGO/CPc–COOH onto carbon-coated copper TEM grids and the solvent was evaporated under gentle heating by a UV lamp.
2.7.6. Electrochemical measurements. Cyclic voltammetry (CV), chronoamperometric (CA) and differential pulse voltammetry (DPV) experiments were performed using an Autolab PGSTAT 101 potentiostat (Eco Chemie, Utrecht, The Netherlands). The electrochemical cell consisted of a working electrode (GCE), Ag/AgCl as reference electrode, and platinum wire as counter electrode. DPV experiments were performed under the following conditions: step potential 5 mV, modulation amplitude 25 mV, and scanning range from 0.35 V to 1.5 V.

3. Results and discussion

3.1. Characterization of the cobalt phthalocyanine tetracarboxylic acid (CoPc–COOH) (1)

Despite the many potential applications that graphene promises to offer, one of the major challenges remains the development of controlled functionalization schemes.41 Non-covalent functionalization approaches, taking advantage of π–π stacking interactions between aromatic molecules and the graphene basal plane, have shown to be easy and efficient means for the integration of organic molecules.19,42–46 Electron donating organic molecules such as dopamine,42 tetrathiafulvalene,43,44 4-aminophenylbenzoic acid,47 hemin19 or tyrosine48 allowed simultaneous reduction of graphene oxide (GO) to reduced graphene oxide (rGO) and insertion of the organic molecules via π–π stacking interactions. A comparable approach was used in this work to decorate rGO with cobalt phthalocyanine tetracarboxylic acid (CoPc–COOH) (1) (Fig. 1A). It is based on the intercalation/adsorption of CoPc–COOH into/onto layers of reduced graphene oxide through the π-stacking system of the two components. In the case of the phthalocyanine CoPc–COOH (1) a mixture of four possible constitutional isomers is obtained. This mixture of isomers can be used as such in obtaining sensing materials due to an enhanced solubility in common solvents and aqueous media caused by the disrupting effect on the crystal lattice.
3.1.1. Electrochemistry. The DMF soluble CoPc–COOH complex shows a reversible redox couple at E0 = −0.22 V vs. Ag/AgCl, attributed to CoII/CoI (Fig. 1B). Additional irreversible anodic bands at E = 0.65 V attributed to CoIII/CoII and E = 0.80 V corresponding to the oxidation of the phthalocyanide macrocycle are seen.8,21,49 An additional band at E = −0.80 V vs. Ag/AgCl was observed under air, being significantly decreased under argon. This band is believed to be to the one-electron catalytic oxidation of oxygen to O2˙ in aprotic solvents, catalyzed by the CoPc–COOH ligand.

The possibility of this electron rich macrocycle to rGO along with its intercalation/adsorption into/onto layers of rGO was achieved through the reaction of GO with CoPc–COOH (1) at elevated temperatures (Fig. 1A).

3.1.2. XPS characterization. The XPS analysis was performed to confirm the integration of CoPc–COOH (1) into GO and the chemical state of GO. The presence of N1s and Co2p next to C1s and O1s evidences the incorporation of CoPc–COOH (1) (Table 1). A 1/2 ratio of rGO/CoPc–COOH resulted in the highest amount of integrated complex and was used in the following for analysis. The ratio of N/Co is ≈8 suggesting that the complex is not destroyed during the chemical process. The high resolution Co2p XPS spectrum (Fig. 2A) shows bands at 780.6, 782.2, 784.2 and 788.8 eV assigned to the Co2p3/2 band of Co2+, while the bands at 795.2 and 797 eV correspond to the Co2p1/2 bands.50 The high resolution C1s XPS spectrum (Fig. 2B) of GO can be deconvoluted into four peaks with binding energies at 283.7, 284.6, 286.6 and 287.9 eV assigned to sp2-hybridized carbon, C–H/C–C, C–O and C[double bond, length as m-dash]O species, respectively. After reaction of GO with CoPc–COOH (1) with a ratio of 1/2 the XPS signature changes significantly. The C1s core level spectrum shows next to the band at 284.1 eV (Csp2), contributions at 285.3 (C–C/C–H), 286.6 (C–O, C–N), 287.9 (C[double bond, length as m-dash]O) and a small contribution at 290.1 eV (O–C[double bond, length as m-dash]O). The as-prepared hybrid material was further characterized using various techniques such as FTIR, Raman spectroscopy, UV-vis, and SEM and to investigate its structure and chemical composition.
Table 1 Composition in atomic percentage of the resulting rGO/CoPC–COOH as a function of the initial concentration ratio of GO/CoPC–COOH
Ratio GO/CoPC–COOH C1s O1s N1s Co2p C/O
GO only 66.2 33.8 1.96
1/0.5 63.5 32.2 3.8 0.5 1.97
1/1 45.1 22.5 28.8 3.6 2.10
1/2 59.4 25.3 13.6 1.7 2.35
1/4 58.7 27.7 12.1 1.5 2.12


image file: c4ra09781e-f2.tif
Fig. 2 High resolution XPS spectra of (A) Co2p and (B) C1s of GO (a) and rGO/CoPc–COOH (b); (C) FTIR spectra of GO (black) and rGO/CoPc–COOH (green).
3.1.3. FTIR spectroscopy. FTIR was further employed to evidence the GO reduction in rGO/CoPc–COOH hybrid sample. Fig. 2C corresponds to the transmission FTIR spectrum of GO. It comprises a broad and strong band at ∼3400 cm−1 assigned to the vibration of hydroxyl groups and/or adsorbed water molecules and features due to C[double bond, length as m-dash]O (–COOH) vibration, OH deformation, and C–O (alkoxy) and C–O (epoxy) stretching modes at 1735, 1420, 1223 and 1081 cm−1, respectively. A band at ∼1625 cm−1 assigned to C[double bond, length as m-dash]C stretching modes is also present in the FTIR spectrum of the initial GO. After reaction of GO with CoPc–COOH forming rGO/CoPc–COOH, the intensity of the bands associated with oxygen functionalities decreased significantly. The FTIR spectrum shows a band at ∼1640 cm−1 due to C[double bond, length as m-dash]C stretching modes, suggesting that the aromatic network has been restored upon reaction with CoPc–COOH. However, the persistence of O–H stretching vibration band (∼3430 cm−1) as well as other oxygen characteristic groups implies the incomplete removal of oxygen groups after GO reduction, in line with XPS results. The C[double bond, length as m-dash]O stretching bands of CoPc–COOH and/or residual carbonyl groups in rGO are observed at 1728 cm−1. The blue shift of C[double bond, length as m-dash]O stretching observed in GO (1735 cm−1) to 1728 cm−1 in rGO/CoPc–COOH might indicate a gain of the electron density on those groups due to electron transfer.21
3.1.4. UV-vis analysis. The UV-vis absorption spectra of hydrazine-reduced rGO, CoPc–COOH (1) and rGO/CoPc–COOH in DMF are displayed in Fig. 3A. The hydrazine-reduced rGO shows an absorption band at 273 nm consistent with the restoration of the sp2 structure in rGO. The UV-vis spectrum of rGO/CoPc–COOH displays similar bands as CoPc–COOH with increased absorption intensity. Compared to CoPc–COOH, the rGO/CoPc–COOH has the Q-bands and Soret band red shifted, from 670 nm to 679 nm and from 334 nm to 345 nm, respectively. This appears to indicate an adsorption and intercalation of CoPc–COOH onto and into the rGO sheets. In addition, it reveals a strong π–π interaction of the CoPc–COOH with the rGO nanosheets. For the rGO, the relocation of electrons from the graphene domain to the CoPc–COOH causes a slightly blue shift of the absorption band of rGO from 273 nm to 268 nm, through the π–π interaction between rGO and CoPc–COOH. The two peaks observed in the Q band zones (609–612) nm and (670–679) nm are related to the aggregates and monomeric species, respectively. In rGo/CoPc–COOH, Q band becomes more symmetric, sharper and intense, while the 607 nm CoPc–COOH spectrum shoulder shapes into a distinct absorption band, bathochromically shifted to 612 nm. In addition, for rGO/CoPc–COOH, both bands related to aggregates and monomer species become intense and are red shifted, confirming that this behavior is exclusively due to interactions established between rGO and CoPc–COOH21 and that it is not the result of the monomer–dimer equilibrium.50
image file: c4ra09781e-f3.tif
Fig. 3 (A) UV-vis spectra of CoPc–COOH (1 mM) in DMF (black line), hydrazine reduced GO (1 mg mL−1) in DMF (blue) and of rGO/CoPc–COOH (1 mg mL−1) in DMF (green); (B) Raman Spectrum of rGO/CoPc–COOH; (C) TEM of rGO/CoPc–COOH, (D) SEM image of rGO/CoPc–COOH.
3.1.5. Raman. Raman spectroscopy was in addition employed and the spectrum of rGO/CoPc–COOH as it is known as a useful technique to study the ordered/disordered crystal structures of carbonaceous materials, such as graphene nanosheets.51,52 Fig. 3B shows typical features of rGO with a broad D band at 1323 cm−1 and a G band at 1576 cm−1, which are usually assigned to the local defects/disorders (particularly located at the edges of the graphitic and graphene platelets) and the sp2 graphitized structures, respectively.53 No obvious peaks corresponding to CoPc–COOH have been observed which is due to the relatively-low concentration of CoPc–COOH and the insensitivity of the Raman method.21 The ID/IG intensity ratio for rGO/CoPc–COOH was found to be 0.89 (initial GO ID/IG = 1.19) with smaller ID/IG peak intensity ratios corresponding to lower defect/disorder in a graphitized structure such a rGO and the improvement in the sp2 graphitized rGO/CoPc–COOH structure.
3.1.6. Electron microscopy. The TEM images revealed that rGO/CoPc–COOH consist of randomly aggregated, crumpled sheets (Fig. 3C). The surface morphology of the rGO/CoPc–COOH matrix was characterized by SEM and shows that rGO/CoPc–COOH has a curled, nonporous structure (Fig. 3D) as observed for other rGO/cobalt nanocomposites.54

3.2. Electrocatalytic response rGO/CoPc–COOH modified glassy carbon electrodes

The electrochemical behavior of rGO/CoPc–COOH modified GCE in DMF is depicted in Fig. 4A. An irreversible redox band at 0.72 V vs. Ag/AgCl attributed to the CoIII/CoII redox couple is observed. Two redox bands at −0.31 V vs. Ag/AgCl and −0.53 V vs. Ag/AgCl are seen on the cathodic scan. Zagal and co-workers observed a similar behavior on carbon electrodes modified with a commercially available cobalt phthalocyanine.3 The first band was attributed to multilayer stacking of cobalt phthalocyanine, while the band at more negative potential was attributed to the CoII/CoI redox couple.
image file: c4ra09781e-f4.tif
Fig. 4 Cyclic voltammograms recorded on GCE modified by drop-casting rGO/CoPc–COOH in CAPS buffer (pH 10) in (A) the absence and in (B) the presence of 15 nM peroxynitrite in CAPS buffer (pH 10, blue) or PBS (pH = 7.4) 15 nM (black), scan rate: 100 mV s−1.
3.2.1. Detection of peroxynitrite. The electrocatalytic behavior of rGO/CoPc–COOH modified glassy carbon electrodes towards the oxidation of peroxynitrite was investigated. Though several strategies based on biochemical assays,55 optical via suitable dyes56–60 or electron (paramagnetic) spin resonance (ESR) spectroscopy61 have been developed for peroxynitrite detection, electrochemical quantification of ONOO has come into the forefront when it comes to real-time, label-free and direct measurements of these reactive species.4,18,19,62–64

Different strategies to synthesize PON were published and have been recently reviewed in some detail.62 While sufficiently stable for 30 to 60 minutes in alkaline solutions (pH ≈ 10),17 peroxynitrite decomposes in less than 1 s at neutral pH.65 Since using alkaline buffer PON solutions is customary in electrochemical sensing methods,66,67 the following experiments were conducted in CAPS buffer (pH 10). Fig. 4B shows the performance of the rGO/CoPc–COOH modified GCE in the presence of peroxynitrite. An increase in the oxidation current observed from 0.72 V vs. Ag/AgCl onwards is attributed to the electrocatalytic oxidation of peroxynitrite:

CoIIPc–COOH → CoIIIPc–COOH + e

CoIIIPc–COOH + O[double bond, length as m-dash]N–O–O → CoIIPc–COOH–OONO˙

CoIIPc–COOH–OONO˙ + e → CoIIIPc–COOH + ONO2˙

2ONO2˙ → O2 + NO2

While synthetic peroxynitrite alkaline buffer solutions help the general sensor development, as one comes closer to test peroxynitrite in vitro and in vivo, working under physiological pH is primordial. Consequently, the use of the PON donor 3-morpholino-sydnonimine (SIN-1) is gaining ground, especially for optical sensing techniques.68,69 Using peroxynitrite formed from SIN-1, rGO/CoPc–COOH modified GC electrode showed a comparable electrocatalytic behavior at pH 7.4 to that obtained in alkaline media (Fig. 4B). This strongly indicates that the rGO/CoPc–COOH modified GC electrode could potentially be used for in vivo conditions.

The sensitivity of the sensor was determined using chronoamperometry (Fig. 5A). The calibration curve in Fig. 5B indicates that the oxidation current scales linearly with increasing ONOO concentration. The sensitivity towards peroxynitrite was ≈11.5 ± 1.0 nA nM−1 with a limit of detection of ≈1.7 nM and a linear range up to 20 nM of peroxynitrite. The detection limit is an order of magnitude lower than that on manganese tetraaminophthalocyanine modified platinum or Pt/C microelectrodes (LOD = 5 μM), but is also inferior than those reported on nanostructured polymerized EDOT/hemin carbon fiber microelectrodes (LOD = 200 nM),17 poly(cyanocobalamin)-modified GE (LOD = 100 nM)70 and GC/rGO/hemin (≈5 nM).19


image file: c4ra09781e-f5.tif
Fig. 5 (A) Amperometric response curve in PBS (pH = 7.4) obtained using glassy carbon electrode modified with rGO/CoPc–COOH by drop-casting polarized at 1.1 V vs. Ag/AgCl with subsequent addition of peroxynitrite, (B) calibration curve.

The selectivity of the modified electrode was evaluated in the presence of various interfering substances. To account for higher concentrations of interfering species present in biological samples, the interference of a 1000 fold excess of the interfering analytes over the peroxynitrite species was examined (Fig. 6A), namely nitrite, nitrate, hydrogen peroxide, dopamine, ascorbic acid and glucose. The results indicated that the rGO/CoPc–COOH modified GC electrode has, beside nitrite, interference-free signals for peroxynitrite measurements similar to in vivo conditions. The electrocatalytic oxidation of nitrite on modified carbon based electrodes is reported to occur between 0.8–1.1 V per SCE.3,71,72 Fig. 6B shows the differential pulse voltammogram of nitrite, peroxynitrite and when in a mixture with nitrite 12 times more concentrated. The rGO/CoPc–COOH modified GC electrode shows two distinguished redox potentials for nitrite and peroxynitrite, being most possible the reason for the good selectivity.


image file: c4ra09781e-f6.tif
Fig. 6 Comparative study of the oxidative current determined on a set of rGO/CoPc–COOH modified GCEs for peroxynitrite (15 nM) and for interfering species: nitrate, nitrite, hydrogen peroxide, dopamine (DA), ascorbic acid (AA), glucose (Gl) at 1000 times excess (15 μM), (B) DPV of nitrite (180 μM, blue), peroxynitrite (15 nM, black) and their mixture (red).

The reproducibility of the rGO/CoPc–COOH modified GC electrode was investigated by measuring the current signal for 10 nM PON at five modified electrodes prepared under the same experimental conditions. A relative standard deviation (RSD) of 5.6% was determined, indicating a good reproducibility of the fabrication method. The long-term stability of the electrode was examined after storage in a refrigerator at 4 °C for a 3 week period. The sensor retained about 95.6% of its initial current response to 10 nM PON. The results demonstrate that the sensor exhibits a good stability.

3.2.2. Detection of hydrogen peroxide. Fig. 7A shows a typical cyclic voltammogram of the rGO/CoPc–COOH modified electrode in 0.1 M PBS in the absence of H2O2 at a scan rate of 50 mV s−1. The modified electrode exhibits no obvious electrochemical response. Upon addition of 2 mM H2O2, a remarkable increase of the current was observed, indicating a good electrocatalytic activity of the interface towards hydrogen peroxide reduction. The electrocatalytic response of the electrode towards H2O2 was further investigated by amperometric current–time response upon successive addition of different concentrations of H2O2 (Fig. 7B). The reduction current increases gradually upon injection of increasing concentrations of H2O2 into the PBS solution. From the corresponding calibration curve (Fig. 7C), a linear relationship between current and H2O2 concentration from 0.1–12 mM could be identified with an estimated sensitivity of 14.5 μA mM−1. A detection limit of ≈60 μM at a signal-to-noise ratio of 3 was achieved using the rGO/CoPc–COOH modified electrode. The detection limit for the sensors is in the same order of magnitude (1–10 μM) than other hydrogen peroxide sensors.73–75 The long-term stability was comparable to the PON case. The sensor retained 96.9% of its initial current response to 5 mM H2O2 when stored in a refrigerator at 4 °C for 3 weeks. The proposed strategy for the preparation of the matrix is moreover straightforward and simple. It furthermore allows the parallel detection of peroxynitrite without any interference.
image file: c4ra09781e-f7.tif
Fig. 7 (A) Cyclic voltammograms of rGO/CoPc–COOH modified GCE in N2 saturated 0.1 M PBS solution (pH 7.4) in the absence (grey, (a)) and presence (black, (b)) of 2 mM H2O2, scan rate = 50 mV s−1; (B) amperometric response of rGO/CoPc–COOH modified GCE polarized at −0.50 V vs. Ag/AgCl in N2-saturated 0.1 M KCl with subsequent addition of H2O2 (500 μM), (C) calibration curve of rGO/CoPc–COOH modified GCE polarized at −0.50 V vs. Ag/AgCl in N2-saturated 0.1 M KCl.

4. Conclusion

We have demonstrated that the reaction of GO and cobalt phthalocyanine tetracarboxylic acid (CoPc–COOH) (1) allows for the simultaneous reduction/functionalization of rGO with (1). The resulting rGO/CoPc–COOH matrices were successfully applied for the determination of peroxynitrite and hydrogen peroxide. Compared with other electrochemical methods for the detection of peroxynitrite, the rGO/CoPc–COOH modified GC electrode reported here has several advantages such a nanomolar sensitivity, high selectivity, good stability and response time of about 15 s. These results open an interesting perspective for the use of such electrodes to detect peroxynitrite in real biological samples. Miniaturization of the sensor might be an important step for achieving this goal. It is known that ultra-small sensors can afford rapid responses and better analyte sensitivity along with high spatial resolution and use in non-stirred solutions or soft solid matrices. Ongoing work aims to miniaturize these peroxynitrite and hydrogen peroxide sensitive-selective electrocatalytic interfaces.

Acknowledgements

Q. W. thanks the “Fundamental Research Funds of Shandong University” under grant no. 31370074614039. R.B. and S.S. gratefully acknowledge financial support from the Centre National de Recherche Scientifique (CNRS), the University Lille 1 and Nord Pas de Calais region. S.S thanks the Institut Universitaire de France (IUF) for financial support. A.V. was supported by the Autoritatea Nationala Romana pentru Cercetare Stiintifica (CNDI – UEFISCDI) through project PN-II-PT-PCCA-2011-3.1-1809 and V.R. was funded by CNDI-UEFISCDI through the project 3.2-1391. S.F.P. and I.S.H. acknowledge funding by CNDI-UEFISCDI, project PN-II PCE-2011-3-1076 and by Institut Français de Roumanie for Partenariat BHC 28684VM. Support from the European Union through FP7-PEOPLE-IRSES (no. 269009) is also acknowledged. Raluca Oprea, Ana-Maria Popescu and Veronica Andrei are credited for their initial assistance during the preliminary phase of this work.

References

  1. J. H. Zagal, S. Griveau, J. Francisco Silva, T. Nyokong and F. Bedioui, Coord. Chem. Rev., 2010, 254, 2755 CrossRef CAS PubMed.
  2. B. O. Agboola, K. I. Ozoemena and T. Nyokong, Electrochim. Acta, 2006, 51, 6470 CrossRef CAS PubMed.
  3. C. A. Caro, F. Bedioui and J. H. Zagal, Electrochim. Acta, 2002, 47, 1489 CrossRef CAS.
  4. J. S. Cortes, S. G. Granados, A. A. Ordaz, J. A. L. Jimenez, S. Griveau and F. Bedioui, Electroanalysis, 2007, 19, 61 CrossRef CAS.
  5. T. Malinski and Z. Taha, Nature, 1992, 358, 676 CrossRef CAS PubMed.
  6. Y. H. Tse, P. Janda, H. Lain and A. Lever, Anal. Chem., 1995, 67, 981 CrossRef CAS.
  7. C. M. Yap, G. Q. Xu and S. G. Ang, Anal. Chem., 2013, 85, 107 CrossRef CAS PubMed.
  8. K. Sakamoto and E. Ohno-Okomura, Mater. Today, 2009, 2, 1127 CrossRef CAS PubMed.
  9. F. Ghani, J. Kristen and H. Rigler, J. Chem. Eng. Data, 2012, 57, 439 CrossRef CAS.
  10. F. Dumoulin, M. Durmus, A. Ahsen and T. Nyokong, Coord. Chem. Rev., 2010, 254, 2792 CrossRef CAS PubMed.
  11. S. Makhseed, M. Machacek, W. Alfadly, A. Tuhl, M. Vinodh, T. Simunek, V. Navakova, P. Kubat, E. Rudolf and P. Zimcik, Chem. Commun., 2013, 49, 11149 RSC.
  12. A. Sivanesan and J. S. Abraham, Electrochim. Acta, 2008, 53, 6629 CrossRef CAS PubMed.
  13. P. Mashazi, C. Togo, J. Limson and T. Nyokong, J. Porphyrins phthalocyanines, 2010, 14, 252 CrossRef CAS.
  14. N. Nombona, P. Tau, N. Sehlotho and T. Nyokong, Electrochim. Acta, 2008, 53, 3139 CrossRef CAS PubMed.
  15. B. O. Agboola, K. I. Ozoemena and T. Nyokong, Electrochim. Acta, 2006, 51, 6470 CrossRef CAS PubMed.
  16. M. Shibata and N. Furuya, Electrochim. Acta, 2003, 48, 3953 CrossRef CAS.
  17. S. Peteu, P. Peiris, E. Gebremichael and M. Bayachou, Biosens. Bioelectron., 2010, 25, 1914 CrossRef CAS PubMed.
  18. S. F. Peteu and M. Bayachou, Anal. Chim. Acta, 2013, 780, 81 CrossRef CAS PubMed.
  19. R. Oprea, S. F. Peteu, P. Subramanian, Q. Wang, E. Pichonat, H. Happy, M. Bayachou, R. Boukherroub and S. Szunerits, Analyst, 2013, 138, 4345 RSC.
  20. C. A. Caro, F. Bedioui and J. H. Zagal, Electrochim. Acta, 2002, 47, 1489 CrossRef CAS.
  21. J.-H. Yang, Y. Gao, W. Zhang, P. Tang, J. Tan, A.-H. Lu and D. Ma, J. Phys. Chem. C, 2013, 117, 3785 CAS.
  22. L. Cui, L. Chen, M. Xu, H. Su and S. Ai, Anal. Chim. Acta, 2012, 712, 64 CrossRef CAS PubMed.
  23. L. Cui, T. Pu and X. He, Electrochim. Acta, 2013, 88, 559 CrossRef CAS PubMed.
  24. H. Hosseini, M. Mahyari, A. Bagheri and A. Shaabani, Biosens. Bioelectron., 2014, 52, 136 CrossRef CAS PubMed.
  25. Y.-Q. Zhang, Y.-J. Fan, L. Cheng, L.-L. Fan, Z.-Y. Wang, J.-P. Zhong, L.-N. Wu, X.-C. Shen and Z.-J. Shi, Electrochim. Acta, 2013, 104, 178 CrossRef CAS PubMed.
  26. C. Amatore, S. Arbault, D. Bruce, P. De Oliveira, M. Erard and M. Vuillaume, Chem.–Eur. J., 2001, 7, 4171 CrossRef CAS.
  27. J. Wang, Chem. Rev., 2008, 108, 814 CrossRef CAS PubMed.
  28. F. Dumoulin, M. Durmus, V. Ahsen and T. Nyokong, Coord. Chem. Rev., 2010, 254, 2792 CrossRef CAS PubMed.
  29. D. Villemin, M. Hammadi, M. Hachemi and N. Barr, Molecules, 2001, 6, 831 CrossRef CAS PubMed.
  30. G. P. Shaposhnikov, V. E. Maizlish and V. P. Kulinich, Russ. J. Gen. Chem., 2005, 75, 1480 CrossRef CAS PubMed.
  31. M. R. Das, R. K. Sarma, R. Saikia, V. S. Kale, M. V. Shelke and P. Sengupta, Colloids Surf., B, 2011, 83, 16 CrossRef CAS PubMed.
  32. S. Stankovich, D. A. Dikin, R. D. Piner, K. A. Kohlhaas, A. Kleinhammes, Y. Jia, Y. Wu, S. T. Nguyen and R. S. Ruoff, Carbon, 2007, 45, 1558 CrossRef CAS PubMed.
  33. M. N. Hughes and G. Nicklin, J. Chem. Soc. A, 1968, 2, 450 RSC.
  34. R. Beckman, Methods Enzymol., 2005, 396, 207 Search PubMed.
  35. N. Hogg, V. M. Darley-Usmar, M. T. Wilson and S. Moncada, Biochem. J., 1992, 281, 419 CAS.
  36. E. de la Fuente, G. Villagra and S. Bollo, Electroanalysis, 2007, 19, 1518 CrossRef CAS.
  37. J. B. Gramsbergen, T. R. Larsen, S. P. Rossen and P. Roepstorff, J. Neurochem., 2007, 101, 31 Search PubMed.
  38. L. K. Cuddy, A. C. Gordon, S. A. G. Black, E. Jaworski, S. S. G. Ferguson and R. J. J. Rylett, J. Neurosci., 2012, 32, 5573 CrossRef CAS PubMed.
  39. K. Konishi, N. Watanabe and T. Arai, Nitric Oxide, 2009, 20, 270 CrossRef CAS PubMed.
  40. D. S. Bohle, P. A. Glassbrenner and B. Hansert, Methods Enzymol., 1996, 269, 302 CAS.
  41. L. H. Liu and M. Yan, J. Mater. Chem., 2011, 21, 3273 RSC.
  42. I. Kaminska, A. Barras, Y. Coffinier, W. Lisowski, J. Niedziolka-Jonsson, P. Woisel, J. Lyskawa, M. Opallo, A. Siriwardena, R. Boukherroub and S. Szunerits, ACS Appl. Mater. Interfaces, 2012, 4, 5386 CAS.
  43. I. Kaminska, M. R. Das, Y. Coffinier, J. Niedziolka-Jonsson, J. Sobczak, P. Woisel, J. Lyskawa, M. Opallo, R. Boukherroub and S. Szunerits, ACS Appl. Mater. Interfaces, 2012, 4, 1016 CAS.
  44. I. Kaminska, M. R. Das, Y. Coffinier, J. Niedziolka-Jonsson, P. Woisel, M. Opallo, S. Szunerits and R. Boukherroub, Chem. Commun., 2012, 48, 1221 RSC.
  45. L. Q. Xu, W. J. Yang, K.-G. Neoh, E.-T. Kang and G. D. Fu, Macromolecules, 2010, 43, 8336 CrossRef CAS.
  46. D.-W. Lee, T. Kim and M. Lee, Chem. Commun., 2011, 47, 8259 RSC.
  47. Q. Wang, I. Kaminsak, J. Niedziolka-Jonsson, M. Opallo, L. Musen, R. Boukherroub and S. Szunerits, Biosens. Bioelectron., 2013, 50, 331 CrossRef CAS PubMed.
  48. Q. Wang, M. Li, S. Szunerits and R. Boukherroub, Electroanalysis, 2014, 26, 156–163 CrossRef CAS.
  49. D. W. Clack, N. S. Hush and I. S. Wolsey, Inorg. Chim. Acta, 1976, 129 CrossRef CAS.
  50. J. Yang, H. Liu, W. N. Martens and R. L. Frost, J. Phys. Chem. C, 2010, 114, 111 CAS.
  51. K. S. Kim, Y. Zhao, H. Jang, S. Y. Lee, J. M. Kim, K. S. Kim, J.-H. Ahn, P. Kim, J.-Y. Choi and B. H. Hong, Nature, 2009, 457, 706 CrossRef CAS PubMed.
  52. L. M. Malard, M. A. Pimenta, G. Dresselhaus and M. S. Dresselhaus, Phys. Rep., 2009, 473, 51 CrossRef CAS PubMed.
  53. D. Graf, F. Molitor, K. Ensslin, C. Stampfer, A. Jungen, C. Hierold and L. Wirtz, Nano Lett., 2007, 7, 238 CrossRef CAS PubMed.
  54. H.-W. Wang, Z.-A. Hu, Y.-C. Chang, Y.-L. Chen, Z.-Y. Zhang, Y.-Y. Yang and H.-Y. Wu, Mater. Chem. Phys., 2011, 130, 672 CrossRef CAS PubMed.
  55. A. Daiber, M. Mehl and V. Ulrich, Nitric Oxide, 1998, 2, 259 CrossRef CAS PubMed.
  56. Z. N. Sun, H. L. Wang, F. Q. Liu, Y. Chen, P. K. H. Tam and D. Yang, Org. Lett., 2009, 11, 1887 CrossRef CAS PubMed.
  57. P. Panizzi, M. Nahrendorf, M. Wildgruber, P. Waterman, J. L. Figueiredo, E. Aikawa, J. McCarthy, R. Weissleder and S. A. Hilderbrand, J. Am. Chem. Soc., 2009, 131, 15739 CrossRef CAS PubMed.
  58. D. Yang, H. L. Wang, Z. N. Sun, N. W. Chung and J. G. Shen, J. Am. Chem. Soc., 2006, 128, 6004 CrossRef CAS PubMed.
  59. J. C. Huang, D. J. Li, J. C. Diao, J. Hou, J. L. Yuan and G. L. Zou, Talanta, 2007, 72, 1283 CrossRef CAS PubMed.
  60. F. J. Martin-Romero, Y. Gutierrez-Martin, F. Henao and C. Gutierrez-Merino, J. Fluoresc., 2004, 14, 17 CrossRef CAS.
  61. D. Pietraforte and M. Minetti, Biochem. J., 1997, 325, 675 CAS.
  62. S. F. Peteu, R. Boukherroub and S. Szunerits, Biosens. Bioelectron., 2014, 58, 359–373 CrossRef CAS PubMed.
  63. S. Peteu, S. Banihani, M. M. Gunasekera, P. Peiris, O. A. Sicuia and M. Bayachou, in Oxidative Stress: Diagnostics, Prevention and Therapy, ed. S. Andreescu and M. Hepel, ACS Symp. Ser., 2011, vol. 1083, p. 311 Search PubMed.
  64. F. Bedioui, D. Quinton, S. Griveau and T. Nyokong, Phys. Chem. Chem. Phys., 2010, 12, 9976 RSC.
  65. R. Kissner, T. Nauser, P. Bugnon, P. G. Lye and W. H. Koppenol, Chem. Res. Toxicol., 1997, 10, 1285 CrossRef CAS PubMed.
  66. D. Quinton, A. Girard, L. T. T. Kim, V. Raimbault, L. Griscom, F. Razan, S. Griveau and F. Bedioui, Lab Chip, 2011, 11, 1342 RSC.
  67. E. Zakharova, T. A. Yurmazova, B. F. Nazarov, G. G. Wildgoose and R. G. Compton, New J. Chem., 2007, 31, 394 RSC.
  68. Q. Zhang, Z. Zhu, Y. Zheng, J. Cheng, N. Zhang, Y.-T. Long, J. Zhend, X. Qian and Y. Yang, J. Am. Chem. Soc., 2012, 134, 18479 CrossRef CAS PubMed.
  69. J. Tian, H. Chen, L. Zhuo, Y. Xie, N. Li and B. Tang, Chem.–Eur. J., 2011, 17, 6626 CrossRef CAS PubMed.
  70. T. Xue, S. Jiang, Y. Qu, Q. Su, R. Cheng, S. Dubin, C.-Y. Chiu, R. B. Kaner, Y. Huang and X. Duan, Angew. Chem., Int. Ed., 2012, 51, 3822 CrossRef CAS PubMed.
  71. D. Zheng, C.-C. Hu, Y. Peng and S. Hu, Electrochim. Acta, 2009, 54, 4910 CrossRef CAS PubMed.
  72. L. Jiang, R. H. Wang, X. Li, L.-Y. Jiang and G. Lu, Electrochem. Commun., 2005, 7, 597 CrossRef CAS PubMed.
  73. P. Zhang, X. Zhang, S. Zhang, X. Lu, S.-M. Li, Z. Su and G. Wei, J. Mater. Chem. B, 2013, 1, 6525 RSC.
  74. F. Xia, J. F. Song, H. Gao, X. Zan, R. Xu and H. Duan, ACS Nano, 2012, 6, 100 CrossRef PubMed.
  75. R. Liu, S.-M. Li, X. Yu, G. Zhang, S. Zhang, J. Yao, B. Keita, L. Nadjo and L. J. Zhi, Small, 2012, 8, 1398 CrossRef CAS PubMed.

Footnote

The two authors have made equal contributions.

This journal is © The Royal Society of Chemistry 2015