Cyclodextrin facilitated electrospun chitosan nanofibers†
Abstract
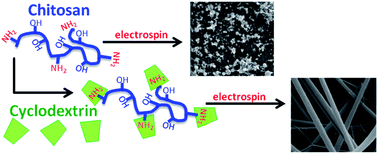
The use of chitosan, a cationic, biodegradable polysaccharide derived from sea-shells, in nanofibrous form offers a powerful platform to exploit its inherent benefits. However, chitosan nanofiber formation is difficult, requiring corrosive solvents or a carrier polymer blend to successfully electrospin. Our approach entails blending chitosan with a functional small molecule, cyclodextrin, to facilitate nanofiber formation of chitosan in acetic acid and trifluoroacetic acid. In this case the cyclodextrin, with its complexation properties, could serve to improve chitosan fiber formation, thus serving as a multi-functional blend. In this study, we examine the role of each component and the possibility of synergistic effects in nanofiber formation. Significant improvements in chitosan fiber formation were observed in concert with cyclodextrin at solvent concentrations not possible with just the individual components. Multiple fiber morphologies including three-dimensional fiber mats were also achieved. We examine the improved nanofiber formation in relation to solution viscosity, polymer entanglement, and chitosan–cyclodextrin associations. Rheological studies provide evidence of interactions between cyclodextrin and chitosan. NMR and FTIR studies further validate complexation between these two components.
 Please wait while we load your content...

