Concentration dependent speciation and mass transport properties of switchable polarity solvents

Aaron D. Wilson* and Christopher J. Orme
Idaho National Laboratory, P.O. Box 1625 MS 2208, Idaho Falls, ID 83415-2208, USA. E-mail: aaron.wilson@inl.gov; Fax: +1 (208)526-8511; Tel: +1 (208)526-1103

Received 12th August 2014 , Accepted 22nd December 2014

First published on 22nd December 2014


Abstract

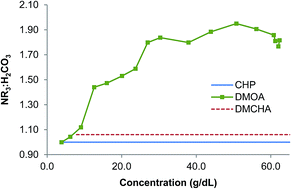
Tertiary amine switchable polarity solvents (SPS) consisting of predominantly water, tertiary amine, and tertiary ammonium and bicarbonate ions were produced at various concentrations for three different amines: N,N-dimethylcyclohexylamine, N,N-dimethyloctylamine, and 1-cyclohexylpiperidine. These amines exhibit either osmotic or non-osmotic character as observed through forward osmosis, which led to this study to better understand speciation and its influence on water transport through a semi-permeable membrane. For all concentrations, several physical properties were measured including viscosity, molecular diffusion coefficients, freezing point depression, and density. Based on these measurements, a variation on the Mark–Houwink equation was developed to predict the viscosity of any tertiary amine SPS as a function of concentration using the amine's molecular mass. The physical properties of osmotic SPS, which are identified as having an amine to carbonic acid salt ratio of ∼1 : 1, have consistent concentration dependence behavior over a wide range of concentrations, which suggests osmotic pressures based on low concentrations freezing point studies can be extrapolated reliably to higher concentrations. The observed physical properties also allowed the identification of solution state speciation of non-osmotic SPS, where the amine to carbonic acid salts ratio is significantly greater than one. These results indicate that, at most concentrations, the stoichiometric excess of amine is involved in solvating a proton with two amines.


Introduction

Switchable Polarity Materials (SPMs)1 are an exciting new class of materials that undergo a polarity shift upon being exposed to a chemical agent. For example, tertiary amines, which are charge neutral, can become ionic in the presence of water and an acid gas, such as CO2. The effects of the “switch” can cause profound changes to the SPM such as (1) solubility or phase (liquidorg → liquidaq, solid → solute, solid → liquid, liquid → solid), (2) solubility of a second solute (selective precipitation or salting out), (3) the solution's colligative properties (osmotic pressure and freezing point), (4) conductivity and pH, and (5) more subtle physical properties like solution polarity and surface tension (surfactants). This unique character suggests relevance to a variety of applications including extractions (natural products,2 algal oils,3–7 biomass,8 and oil sands9), pyrolysis oil fractionation,10 biomass pretreatment and fractionation,11,12 carbon capture,13–20 reaction media, and osmotically driven membrane processes (ODMP), such as forward osmosis (FO).21–23

In an ODMP, which also can be referred to as engineered osmosis (EO), water is transferred from a feed solution across a semi-permeable membrane to a draw solution with a higher osmotic concentration. ODMP can be used to extract energy from water transport in a process termed pressure retarded osmosis (PRO), or in a more specific application as an osmotic heat engine (OHE).24–34 If the goal of ODMP is water purification, which can be accomplished through water removal from a diluted draw, then the process can be referred to as forward osmosis (FO).35–37 FO's roots can be followed back to water selective “dialysis” used to remove water from organic solvent published as early as 1932.38

Despite early efforts, publications in the field of ODMP were intermittent and sporadic until a series of papers starting in 2005 reintroduced the topic with a promising draw solute based on the ammonia–CO2 chemistry, while highlighting the potential benefits of ODMP.39–46 Since this time, there has been an exponential growth in publications addressing ODMP in terms of draw solute and membrane development. Our focus has been on the use of SPM as draw solutes in Switchable Polarity Solvent Forward Osmosis (SPS FO) process.21,23 The potential for SPS FO to treat feed solutions over a wide range of total dissolved solids (TDS) concentrations in a cost effective manner solving problems with many other draw solute systems renders SPS FO an attractive water treatment technology.21,23

Due to their water compatibility and large range of osmotic concentrations, we have focused on a sub-class of SPM consisting of tertiary amines capable of switching between an aprotic non-ionic water-insoluble liquid and a water soluble ionic solute through the introduction and removal of CO2. This sub-class has been explored by more than one group and referred to as biphasic or lipophilic amine solvents,13,14,16,17 switchable hydrophilicity solvents,6–10,47,48 and our own use of the more general switchable polarity solvents (SPS)3,21,49 with explicit description of composition.

To advance our understanding of tertiary amine SPS, and related SPM, our group screened an array of tertiary amines and developed a functional-group contribution model to predict the performance of tertiary amine SPS.49 The functional-group contribution model suggested that 1-cyclohexylpiperdine (CHP) would be an effective draw solute which motivated an empirical investigation of CHP properties. CHP is currently considered a promising SPS draw solute for ODMP based on maximum possible osmotic pressure, initial flux studies, CO2 degassing kinetics, and expected production cost.50 While our tertiary amine screening allowed the selection of an optimized amine, it has limited ability to predict concentration dependent properties. Understanding concentration properties such as osmotic pressure, viscosity, ion diffusivity, and density are necessary for optimizing process conditions for the application of SPS, including ODMP.

Initial SPS FO work used N,N-dimethylcyclohexylamine (DMCHA) as an SPS draw solution.21 The shift to CHP represents an increase in molecular mass for the draw solute. The move to higher molecular mass is a common trend in draw solute research.22,51–57 High molecular weight draw solutes offer a number of advantages over lower molecular weight draw solutes including: (1) lower membrane permeability, which reduces solute loss into the feed, (2) solute removal processes beyond RO such as magnetic nanoparticles and Lower Critical Solution Temperature (LCST) behavior for some polymers, potentially circumventing the energy and concentration limitations of RO, and (3) better membrane/material compatibility. However, high molecular weight draw solutes (effectively >100 g mol−1) often have substantial mass fractions (>50 wt%) before reaching high osmotic strengths (>100 bar) producing conditions where mass transport phenomena can limit the kinetic flux performance of such systems.

The osmotic flux performance of a draw solute is primarily a product of two concentration dependent properties: osmotic pressure and mass transport (viscosity/diffusivity). As the draw solution concentration increases, so does the osmotic pressure providing a greater thermodynamic driving force for osmotic flux. At the same time, the mass transport rates usually decline, restricting the kinetics of osmotic flux. Osmotic pressure increases linearly with molal concentration while viscosity,58 a good proxy for multiple mass transport phenomena, generally increases exponentially with molal concentration.59 The relationship between osmotic pressure and viscosity varies between draw solutes due to differences in the van't Hoff indices and different relationships between concentration and viscosity. Higher molecular mass organic solutes generally have higher viscosities and lower diffusion coefficients relative to their concentration. To successfully design, model, and optimize an ODMP requires a mass transport-concentration model for the draw solute, for SPS FO it would be ideal if the model generalized to all possible SPS draw solutes.

To reach a generalized model requires the study of more than one representative example of tertiary amine SPS, which leads to the question of choosing amines. In our previous study we found that tertiary amines can react with CO2 in two distinct stoichiometries, one amine to one carbon dioxide and significantly more than one amine per carbon dioxide.49 The one amine to one carbon dioxide SPS functions effectively as a draw solute and is referred to as an osmotic SPS. The tertiary amines which react in ratios of significantly more than one amine per carbon dioxide do not function as draw solutes and are referred to as non-osmotic SPS. In this study, two osmotic SPS draw solutes, DMCHA and CHP were used. For the sake of comparison and to ensure osmotic SPS draw solutes under consideration are effective over their entire concentration range, we also investigated an amine, N,N-dimethyloctylamine (DMOA), which is non-osmotic. This work resulted not only in a generalized viscosity model for SPS but also the initial data indicating complex tertiary amine CO2 concentration dependent solution states which have not been previously reported.

Results and discussions

Solution structure speciation of SPS

The goal of this work is to characterize physical properties necessary for optimizing the performance of osmotic SPS as ODMP draw solute. To provide insight into osmotic behavior, a non-osmotic SPS was included to ensure that the osmotic SPS did not begin to display non-osmotic behaviors as the concentrations were increased. Osmotic and non-osmotic SPS differ in their stoichiometric ratio amine to carbonic acid salts which are largely bicarbonate (amine/H2CO3 ratio, ν). The amine/H2CO3 ratios for osmotic SPS are close to unity varying between 1.00 and 1.26 at maximum equilibrium concentrations, while non-osmotic SPS have been measured between 1.91 and 2.87.49 To understand what leads to these gross stoichiometries and associated macroscopic behaviors requires in investigation of what is happening in solution. The intermolecular interactions of water are often referred to as water structure.60 This concept can be extended to solutes to describe the transient but statically stable intermolecular structures that produce macroscopic properties; these interactions will be referred to as solution states or speciation. The solution state of the stoichiometric excess amine is expected to contribute to the properties in both the non-osmotic SPS and osmotic SPS (most of which have a modest excess of amine). Three different solution states of stoichiometric excess amine (up to the first equivalent) were initially considered during this study, Fig. 1. It is possible that the excess amine enters the aqueous phase due to a polarity shift, essentially improved solubility, and does not engage in acid base chemistry, Option 1 Fig. 1. Alternatively, the excess amine may assist in solvation of the acid base pair by either dually solvating the bicarbonate ion (Option 2, Fig. 1) or proton (Option 3, Fig. 1) with the bicarbonate loosely associated.
image file: c4ra08558b-f1.tif
Fig. 1 Three potential options for the dominant solution state molecular structure of the excess amine in non-osmotic SPS.

Concentration dependence of the amine to carbonic acid salts ratio based on quantitative 13C NMR

For a number of SPS, their stoichiometries and associated physical properties are known at their maximum equilibrium concentration.49 The data at maximum equilibrium concentrations offer a glimpse and provide suggestions on concentration dependent behaviors. However, no reliable trends can be obtained from the maximum equilibrium concentration data because each data point involves a change in two variables, the amine and the concentration. In this study, three amines are studied over a range of concentrations for the first time. These controlled studies provide context for the broader maximum equilibrium concentration studies and should allow for more informed and interesting models and predictions of SPM behavior. To generate the range of concentrations, three concentrated samples were diluted and their concentrations and stoichiometries were measured with nuclear magnetic resonance (NMR). The osmotic SPS diluted as would be expected for an aqueous solution containing a water soluble solute. No special precautions were made. Diluting the non-osmotic SPS DMOA was more complex. The non-osmotic SPS samples were prepared through the dilution of a concentrated sample, after which were then allowed to stabilize for several months. During preparation, the most concentrated samples included the starting solution (61.2–62.4 g dL−1, 15.4–16.3 mol kg−1 (total mole TDS) measured) clouded when shaken. Some of the dilute solutions did not cloud (60.8–37.9 g dL−1, 15.1–5.3 mol kg−1). The clouding suggested a loss in CO2, which was confirmed with the development of an organic layer and reduction in the observed amine/H2CO3 ratios. All solutions at concentrations of 30.4 g dL−1 (3.8 mol L−1) and less clouded when mixed, formed organic layers, and exhibited a lower amine/H2CO3 ratio. The more polar and dense phase was analyzed when an organic phase formed.

The amine/H2CO3 ratio was measured at various concentrations with quantitative 13C NMR spectroscopy, Fig. 2. The osmotic SPS amine/H2CO3 ratios are based on the average value of measurements where the carbonic acid salts shift was not peak clipped because of insufficient data points due to the carbonic acid salts' very narrow peak width relative to the acquisition window. There was no apparent change in these amine/H2CO3 ratios over the entire concentration range.


image file: c4ra08558b-f2.tif
Fig. 2 The amine/H2CO3 ratio, ν, plotted against total solute concentration (g dL−1) for the polar bicarbonate solutions of CHP (blue solid line) DMOA (green squares) with concentration/property defined regions, and DMCHA (red dashed line).

In general, the concentrations of the osmotic and non-osmotic SPS solutions were calculated based on quantitative 1H and 13C NMR as previously described.49 The 1H NMR spectrum contains chemical shifts, δ, which has been assigned to the exchangeable protons of water (H2O), carbonic acid salts (HCO3 and H2CO3), and ammonium (H+NR3) shifts. Based on 1H NMR spectrum integration, the ratio of water and carbonic acid salts to amine can be calculated. This ratio combined with the amine to carbonic acid salts ratio derived from the quantitative 13C NMR allow for the calculation of the relative mole ratio of amine[thin space (1/6-em)]:[thin space (1/6-em)]carbonic-acid[thin space (1/6-em)]:[thin space (1/6-em)]water. With the molecular mass and solution density, it is possible to calculate virtually any form of concentration. The amine/H2CO3 ratio as a function of concentration is plotted in Fig. 2.

This dilution behaviors combined with various physical properties was used to define working regions displaying different behaviors with amine/H2CO3 ratios being a clearly distinguishable property, Fig. 2. The first region in the DMOA data features an amine/H2CO3 ratio close to one like osmotic SPS and displays behaviors similar to osmotic SPS (0.3–6.2 g dL−1, 0.025–0.60 mol kg−1, region I). DMOA's region II appears to be dominated by a 3 amine to 2 carbonic acid salts stoichiometry with the amine/H2CO3 ratio rising from 1.44 to 1.59 with concentration (23.7–12.6 g dL−1, 2.7–1.2 mol kg−1, region II). DMOA's region III has approximately 2 amines for every carbonic acid salt with the amine/H2CO3 ratio rising from 1.90 to 1.95 with concentration (27.0–50.8 g dL−1, 3.1–9.3 mol kg−1, region III). The highest observed amine/H2CO3 ratio of 1.95 at 50.8 g dL−1 (9.3 mol L−1) that defines the border of regions III and IV has a concentration that lies in the middle of ”non-clouding” samples (37.9–60.8 g dL−1) discussed above. This 1.95 value sets the lower limit of the initial amine/H2CO3 ratio in the undiluted starting solution, indicating all other solutions (and likely this one) lost carbon dioxide when given a chance to stabilize. DMOA's final region includes the concentrated samples that clouded when mixed and is defined by a modest decline in the amine/H2CO3 ratio from 1.95 to 1.77 relative to concentration (50.8–62.4 g dL−1, 9.3–16.3 mol kg−1, region IV). These regions will be used throughout the remaining text when evaluating the data.

Viscosity and molecular mass based model of viscosity

For many applications of SPM, the viscosity and its effect on molecular diffusion are critical factors that must be examined. In our work, osmotic pressure of SPS increases linearly with molal concentration while viscosity,58 a good proxy for multiple mass transport phenomena, generally increases exponentially,59 Fig. 3.
image file: c4ra08558b-f3.tif
Fig. 3 The circles are the total species molality including tertiary amines, tertiary ammonium ions, and carbonic acid salts plotted against osmotic pressure (left axis) based on observed freezing point osmolality (concentration (Osm kg−1) × 24.5 (L atm Osm−1) × σ (kg L−1)).58 The open circles are the same concentration units plotted against the viscosity in cP recorded at 15 °C (right axis).

Viscosity is a composite of a solution's mass transport properties. In this study we measured the absolute viscosity for each of the materials, Fig. 4. When the viscosity is plotted relative to osmotic pressure, Fig. 5, there is a significant difference between the profiles considering a relative small 21 wt% change in formula mass (CHP 229 g mol−1 vs. DMCHA 189 g mol−1). Characterizing the relationship between molecular weight and viscosity is important relationship in the selection of the optimal SPS draw solute. Low viscosity is not intrinsically required for an ODMP, its possible for a stationary phase or near stationary phases to change the potential of water at their surface. Capillary action is when a solid phase adjusts the solution structure or potential of water, which is directly related to osmotic pressure where a solute adjusts the solution structure or potential of water. At the molecular scale the differences between the phenomena are minor. Despite the theoretical viability, highly viscous draw solutions generally have mass transfer issues that reduce pure water flux during an FO process. These mass transport issues include difficulty in achieving proper draw solution mixing due to shear thickening or thinning, which are examples of non-ideal behaviors which generally increase with viscosity.


image file: c4ra08558b-f4.tif
Fig. 4 The absolute viscosity (cP) recorded at 15 °C plotted against total solute concentration (g dL−1) for the polar bicarbonate solutions of CHP (blue diamonds) DMOA (green squares), and DMCHA (red circles).

image file: c4ra08558b-f5.tif
Fig. 5 The absolute viscosity (cP) recorded at 15 °C (Fig. 4) plotted against osmotic pressure for the polar bicarbonate solutions of CHP (blue diamonds) and DMCHA (red circles). DHP and DMCHA data extends beyond depicted osmotic pressure and viscosity range. The trend lines are based on 3rd order polynomials.

At 25 °C, high concentration SPS solutions were prone to degassing due to the physical agitation involved in the falling bob experiment used to measure viscosity. All viscosities were determined at 15 °C to allow measurements of viscosity up to maximum concentrations. It is difficult to compare the absolute viscosity of materials directly to theoretical models as there are many choices of viscosity models.59 For the SPS system, converting the absolute viscosity to an inherent viscosity (ηinh) (eqn (1)) removes the exponential component of the system and linearizes both the CHP and DMCHA data, Fig. 6. Plotting inherent viscosity of DMOA reveals some very distinct trends. There is a general rise in the inherent viscosity through regions II and III with a peak at approximately 40 g dL−1, followed by a decline in region IV. Low concentration inherent viscosities are perturbed by minor errors due to the similarity of the measured viscosity, η, to the solution's neat viscosity, η0, and thus region I is not considered in this evaluation.

 
image file: c4ra08558b-t1.tif(1)


image file: c4ra08558b-f6.tif
Fig. 6 The inherent viscosity (cP) 15 °C (η0 = 1.14 cP at 15 °C) plotted against total solute concentration (g dL−1) for the polar bicarbonate solutions of CHP (blue diamonds) DMOA (green squares), DMCHA (red circles) as well as CHP (blue open diamonds & dotted line) and DMOA (green open-squares & dashed line) mass and amine/H2CO3 ratio normalized to DMCHA.

According to the Mark–Houwink equation (eqn (2)) as inherent viscosity approaches zero the material's intrinsic viscosity [η], which is proportional to the material's molecular mass, is revealed. In eqn (2), both K and α are constants for similar materials in the same solvent. The exponent, α, ranges between 0.5 and 0.8 for flexible polymers up to 2.0 for a rigid polymers that do not tumble in solution. The small tertiary amines under consideration here are more rigid than a flexible polymer but can tumble and are likely to have an α value between 0.8 and 2.0. Because the inherent viscosities of SPS are linear over most of the concentration range, it suggests that the entire dataset is proportional to molecular mass. If the inherent viscosity was molecular mass normalized according the Mark–Houwink equation, the data would be co-linear.

The molecular mass M, of polar SPS is a non-trivial question. Depending on what solution state speciation dominates, Fig. 1, the effective molecular mass may be defined by independent ions, molecules, or ion pairs (Option 1) or a more complex solution species (Options 2 & 3). Significant ion pairing for both Options 2 & 3 suggests that the effective molecular mass increases, νM, varies proportionally with the amine/H2CO3 ratio, ν, Fig. 2. Including the amine/H2CO3 ratio in the normalization equation, eqn (3), co-linearizes the inherent viscosity of DMCHA, CHP, and DMOA regions II and III, Fig. 6.

 
image file: c4ra08558b-t2.tif(2)
 
image file: c4ra08558b-t3.tif(3)
 
image file: c4ra08558b-t4.tif(4)

This co-linearization indicates that α is near 1 and that Options 2 or 3 are the most likely solution states for excess amine in polar SPS solution over the co-linear range. eqn (1) and (3) can be solved to yield eqn (4). The viscosity of a tertiary amine osmotic SPS can be predicted for any concentration and molecular mass with eqn (4), an estimated amine/H2CO3 ratio, and known measured data for a characterized osmotic SPS (Fig. 6). This predictive capability extends to non-osmotic SPS with known amine/H2CO3 ratio for most concentrations, up to 50.8 g dL−1 9.3 mol kg−1, in the case on DMOA.

In region IV, the DMOA viscosity vs. concentration trends change; the slope of the absolute viscosity changes (Fig. 4), the slope of the inherent viscosity becomes negative (Fig. 6), and the normalized inherent viscosity deviates from the normalized data osmotic SPS (Fig. 6). At these high concentrations, greater than 50.8 g dL−1, there are only 5 and 6.5 water molecules for every amine and the solution has likely shifted in polarity. It could be argued that this shift in polarity would drive an amine into a hydrogen bonded conformation, Option 2 or 3, especially for water miscible amines. This is not expected for DMOA which is miscible only in acidic water. Non-polar solutions, especially under basic conditions, better accommodate independent non-polar amines like DMOA. At high concentrations the bulk solution polarity is more non-polar and may support independent non-polar amines as featured in solution state, Option 1. Option 1 or 2 would also minimize ion pair charge separation which would be favored in a nonpolar environment. A shift from Option 2 or 3 to Option 1 would mean a progressive shift from two amines paired in solution to isolated amines, thus reducing the amine's the effective molecular mass. A decline in effective molecular mass and would result in a decline in the anticipated viscosity relative to concentration which is observed in all plots of DMOA's viscosity over region IV. Furthermore, Option 1 would be the least effective at stabilizing bicarbonate and in turn less effective at retaining carbon dioxide in solution than the other options. The decline in the amine/H2CO3 ratio over region IV, Fig. 2, is most likely a result of carbon dioxide loss followed by amine separation. A shift to Option 1 over region IV matches with the decline in the amine/H2CO3 ratio and changes in viscosity trends.

Molecular diffusion data for amine, carbonic acid salts, and solvent

Diffusion of solutes in a solvent is a molecular property that drives many properties like viscosity, extraction efficiency, and various fluxes. Diffusion values are used in a variety of process models were SPS may find application. For ODMP in particular, diffusion coefficients are a component of most concentration polarization models which predicts water flux. Some of the most advanced concentration polarization models consider the concentration dependence of diffusion.61,62 The diffusion rates of the amine, carbonic acid salts, and exchangeable protons predominantly associated with the solvent were measured with 1H and 13C DOSY experiments over a range of concentrations of neat solutions, Fig. 7. The solvent diffusion rates were found by assuming the exchangeable proton peak was a mole weighted average of the ammonium, carbonic acid salts, and solvent diffusion rates. The observed exchangeable proton peak was adjusted for the contributions of the ammonium and carbonic acid salts based on the relative concentrations (solvent > solute) and relative diffusion rates (solvent > solute), Fig. 7F. The adjustment resulted in a maximum correction of 27% for the most concentrated solution. A 27% correction can be considered a minor shift on a logarithmic scale on which the diffusion rates are investigated, Fig. 7.
image file: c4ra08558b-f7.tif
Fig. 7 The diffusion coefficients of for the amine (solid), carbonic acid salts (open), and water (greyed) derived for 1H and 13C DOSY experiments plotted against total solute concentration (g dL−1) for the polar bicarbonate solutions of CHP (blue diamonds) DMOA (green squares), and DMCHA (red circles).

Diffusion coefficients are often considered single values when in fact they are reported under specific conditions, such as at infinite dilution. Such an infinite dilution can be projected for the osmotic SPS using a third order polynomial using the data is Fig. 7D, resulting in DMCHA 6.69 × 10⁻¹⁰ m2 s−1 and CHP 5.87 × 10⁻¹⁰ m2 s−1. Diffusion coefficients have been useful for approximating the molecular mass of simple molecules with relationships such as those featured in eqn (5).63–65 DMCHA and CHP's infinite dilution values are consistent with eqn (5) with an error of 1.2%. The value of eqn (5) is limited as it is not useful for the non-osmotic SPS (DMOA) data and is only useful at infinite dilution for osmotic SPS. A theoretical model has not been found to characterize the diffusion behavior over broad concentration ranges. While there may not be a quantitative model for the observed concentration dependent trend in diffusion, the data can still be used to qualitatively identify concentration dependent trends.

 
image file: c4ra08558b-t5.tif(5)

The DOSY data shows that diffusion coefficients for the amine and carbonic acid salts of osmotic SPS, DMCHA and CHP, while separate appear to be associated in the way they respond to concentration. When plotted logarithmically the amine and carbonic acid salts diffusion coefficients decline proportionally with increasing concentration, Fig. 7A (DMCHA) and C (CHP). The amine and carbonic acid salts diffusion coefficients of the non-osmotic SPS, DMOA, are less associated. The magnitude of the difference between DMOA's amine and carbonic acid salts diffusion coefficients (Fig. 7B) is greater than osmotic SPS (Fig. 7A and C). After region I the carbonic acid salts associated with DMOA generally diffuses faster for a given concentration than either DMCHA or CHP, Fig. 7E; while the diffusion rate of DMOA is slower than either DMCHA or CHP, Fig. 7D. The viscosity data suggested DMOA solution structure includes two amines per solvated proton (Option 3) or two amines solvating a carbonic acid salt (Option 2). The separation between the amine and carbonic acid salts diffusion coefficients for DMOA compared to the osmotic SPS supports the solution state speciation where two amines per solvated proton (Option 3). The fact that the separation is greater for non-osmotic SPS than osmotic SPS further supports Option 3 because it indicates that the bicarbonate has reduced involvement in solvating the acidic proton which is presumably solvated by two amines. DMOA's ions are also less associated in terms of the relative change of DMOA's amine and carbonic acid salts diffusion coefficients. DMOA's amine and carbonic acid salts diffusion coefficients do not change proportionally (Fig. 7B) in contrast to osmotic SPS. The magnitude and non-parallelism between the amine and carbonic acid salts diffusion coefficients strongly suggests that the amines are solvating a proton with the carbonic acid salts acting as an independent species, Option 3 Fig. 1.

DMOA also displays differences from the osmotic SPS in the trends of the amine's diffusion coefficient as a function of concentrations, Fig. 7D. The amine diffusion coefficient for DMOA begins to plateau at 50.8 g dL−1, the beginning of region IV, while the osmotic SPS has a slope more negative than linear over their entire range. This supports a shift of solution state speciation from Option 3 to Option 1; a progressive shift from two amines paired in solution to isolated amines, reducing the amine's effective molecular mass, which effectively compensates for the expected decline diffusivity (based on osmotic SPS) over region IV.

At very low concentrations the water diffusion coefficients are similar for DMOA and the osmotic SPS, Fig. 7F. This similarity could be expected because at these low concentrations DMOA has a similar amine/H2CO3 ratio and would have an influence more like an osmotic SPS. As concentrations increase, the diffusion coefficients of water in the osmotic SPS decline more quickly. Despite having a higher viscosity than the osmotic SPS at all concentrations (Fig. 4) water diffuses faster in DMOA, Fig. 7F. A disconnect between water's diffusion coefficients and the DMOA amine's diffusion coefficients is consistent with the DMOA solutions being non-osmotic.

Freezing point osmometry and higher-order solution states

SPS, and SPM in general, can radically change the amount of solute they contain when they “switch”. In the case of DMCA, the aqueous solute concentration can be shifted from 0.14 to 35.2 mol kg−1 with the addition of ∼1 atm of CO2.49 By definition, the amount of solute in solution defines the colligative properties of the solution. For ODMP, thermodynamics, including the driving force for water flux across a membrane, are a function of the osmotic pressure, a colligative property. Osmotic pressure is extremely difficult to directly measure and is thus frequently indirectly studied through a second colligative property, freezing point depression. Freezing point osmometry is a quick method to obtain an accurate empirically derived osmotic pressure including SPS systems.58

The relationship between the TDS (ionic and neutral solutes) in molality (mol kg−1) units and osmolality (Osm kg−1) is linear for osmotic SPS. The relationship is more complex for non-osmotic SPS, Fig. 8. The first complexity was in obtaining the non-osmotic amine/H2CO3 ratio at low concentrations. For osmotic SPS the amine/H2CO3 ratio has been obtained at moderate to high concentrations and assumed to be the same for dilute samples. This assumption cannot be made for non-osmotic SPS and it was not possible to measure the amine/H2CO3 ratio with the most dilute DMOA samples (0.025–0.20 mol kg−1) with quantitative 13C NMR spectroscopy. The first measurable solution (0.37 mol kg−1) has an amine/H2CO3 ratio of 1.00. Starting from an amine/H2CO3 ratio of 1.00 at 0.37 mol kg−1 the amine/H2CO3 ratio increases as a function of concentration until an amine/H2CO3 ratio of 1.95 (9.3 mol L−1) after which there is a modest decline, Fig. 2. The trend would predict a decline amine/H2CO3 ratio with declining concentration for the two unmeasurable samples, 0.025 and 0.20 mol kg−1 but it is unlikely that the ratio would be lower than unity (i.e. more carbonic acid salts than amine). Without the presence of the amine, the equilibrium value of all carbonic acid salts would be less than 0.0002 mol kg−1 (Henry constant of [CO2]/pCO2 ≈ 3.4 × 10⁻² (mol L−1) atm−1, a carbon dioxide hydration equilibrium constant of [H2CO3]/[CO2] ≈ 1.7 × 10⁻³, and carbonic acid acidity of ([H+][HCO3])/[H2CO3] ≈ 2.5 × 10⁻⁴ mol L−1); two orders of magnitude lower than our lowest calculated value of 0.025 mol kg−1 at 1 atm of CO2. The overall trends in amine/H2CO3 ratio and the provided thermodynamic data support the assumption of an amine/H2CO3 ratio of 1.00 for the 0.025 and 0.20 mol kg−1 samples which was used to calculate their concentrations for use in Fig. 8.


image file: c4ra08558b-f8.tif
Fig. 8 The observed freezing point osmolality plotted against total solute concentration (total molecule & ion solute molality) for the polar bicarbonate solutions of CHP (blue diamonds) DMOA (green squares), and DMCHA (red circles). Trend line based on the first four DMOA data points (0.025–0.6 mol kg−1).

The second complexity is in interpreting the relationship between molality and osmolality for non-osmotic SPS. The concentrations based regions used in Fig. 2 have been applied to the data in Fig. 8. region I of the DMOA data features an amine/H2CO3 ratio similar to osmotic SPS, Fig. 2, and quantitatively similar van't Hoff index to the indices of the osmotic SPS, Fig. 8. Region II has a highly reduced rise in osmolality versus molality.

Between 0.6 and 2.65 mol kg−1 (region II) the van't Hoff index was only 0.088 Osm mol−1, which is significantly lower than the values predicted by a simple first-order colligative model for solution states Options 1–3. This supports an intermediate nanostructured (micellar) state based on higher-order equilibria involving many individual carbonic acid salts and amines. Data from Fig. 2 suggests a stable 3 amine to 2 carbonic acid salts ratio in region II. The data presented thus far suggests that region I primarily consists of one bicarbonate ion and one ammonium ion and one and region III primarily consists of Option 3, one bicarbonate ion and a proton dually solvated by two amines. These different solution states of amine may both be present in region II, for the purposes of discussion a proton solvated by one amine has been labeled as an α ammonium and proton solvated by two amines has been labeled as a β ammonium in Fig. 9. This 3[thin space (1/6-em)]:[thin space (1/6-em)]2 amine to carbonic acid salt ratio in region II does not appear to be fully driven by the amine's transition from an α to a β ammonium; the bicarbonate must play a role. In the crystal structure of dimethylcyclohexylammonium bicarbonate the core of the unit cell is two dimerized bicarbonates.66 Acetic acid has the same structure in the solid state and also in the solution state under specific conditions.67 Dianions, such as the bicarbonate dimer featured in Option 4 and 5 (Fig. 9), would have the potential to facilitate the formation of higher-order structures.


image file: c4ra08558b-f9.tif
Fig. 9 Solution state molecular structures which could provide a stable 3 amine to 2 bicarbonate speciation.

Option 4 and 5 are intended to illustrate likely molecular and structural components of the solution states. The molecular components are the building blocks for more complex nanostructures suggested by the freezing point studies. In region II, there is a reasonable degree of confidence in the presence of a β ammonium, as it accounts for excess amine stoichiometry, and bicarbonate dimers (contributing to nanostructures) and thus are included in both Options 4 and 5, in Fig. 9. These two components do not provide a balanced stoichiometry. Option 4 uses a “free” proton to balance is stoichiometry which would likely be incorporated into a bicarbonate nanostructure. A “free” proton or a proton associated with a bicarbonate dimer is not predicted by first order pKa values. First order pKa values predict that every “free” proton would associate with an amine, like Option 5, but the presence of nanostructure indicates that higher order equilibria dominates making an adaptation of Option 4 a valid possibility. It is likely that region II, at least in part, depends on the amine concentration which would suggest that an ammonium ion is incorporated into the bicarbonate nanostructure. A β ammonium is not expected to be part of an extended hydrogen bond structure however an α ammonium could incorporate into an extended hydrogen bond structure. The bicarbonate dimer nanostructures would be stabilized by the addition of an equivalent of accessible proton which could be supplied by an α ammonium (Option 5). Option 5 provides a total of 3 protons for 6 oxygen atoms in the dimer allowing every oxygen atom to hydrogen bond with one other oxygen atom, Fig. 10. The structure in Fig. 10 is dependent on the α ammonium ion concentration due to its incorporation into the bonding structure but also the β ammonium concentration for its role as counter ion.


image file: c4ra08558b-f10.tif
Fig. 10 A possible formula unit for a nanostructure consisting of 1 ammonium ion and to 2 bicarbonate ions related to Option 5 in Fig. 9.

Option 5 is also expressed in most reduced stoichiometric terms possible. Option 5 features three amines and two bicarbonates while Option 4 requires twice as many of each to balance stoichiometry. To its credit, Option 5 is (1) consistent with first order pKa values, (2) is dependent on both the amine and carbonic acid salt concentrations, (3) provides the building blocks for a nanostructure that explains the observed freezing point depression data in region II, (4) uses solution components that allow every bicarbonate oxygen to hydrogen bond to another bicarbonate oxygen, and (5) features the most reduced stoichiometry possible to explain the 3 amine to 2 bicarbonate stoichiometric ratio. Thus, Option 5 provides a strong candidate for the dominant solution state components in region II but further study is required to demonstrate this conclusively.

In region III the van't Hoff index is measured as 0.17 Osm mol−1 but this value may be low because of degassing that could not be distinguished from slush formation. Solutions at greater concentration than 3.68 mol kg−1 visually foamed when agitated by the osmometer and thus did not freeze properly for a measurement, limiting the scope of the freezing point study. Assuming region III has a van't Hoff index of 0.17 Osm mol−1 (or slightly higher), it is higher than region II, but still lower than what is predicted by a simple first-order colligative model. In region III, the amine/H2CO3 ratio is nearly two amines for every bicarbonate ion and likely has a solution state akin to Option 3 or possibly two β ammonium per bicarbonate dimer. This suggests that region III has higher-order nanostructured solution state but structure with a lower average mass than region II. This trend of first order van't Hoff behavior (region I) followed by higher-order nanostructured solution states (region II) that are partially disrupted at higher concentrations (region III) is similar to trends observed for glycol ethers featuring lower critical solution temperature (LCST) phase behavior.68

Density and apparent molar properties

The densities of various solvents and solutes are not necessarily additive when mixed. Finding the concentration dependence density relationship for SPS has an impact on the design of industrial processes, like ODMP. Density also has implications on the solution state structures with notable differences between osmotic SPS and non-osmotic SPS.

The density of osmotic SPS rises steadily with concentration, DMCHA showing only a slight plateauing above 70 g dL−1 while CHP shows almost no plateauing, Fig. 11. The density of non-osmotic SPS DMOA rises slightly at lower concentrations which correspond to region I in Fig. 2 or 8, but then decreases at concentrations >6.2 g dL−1, Fig. 11. The initial rise in DMOA density suggests a speciation that is more dense than water, similar to the osmotic SPS speciation of HNR3–HCO3, which is also consistent with the DMOA freezing point data. The subsequent decline in density is consistent with the lower density of non-osmotic SPS that has been seen at maximum concentrations as compared to osmotic SPS.49 This could be expected given that non-osmotic SPS have a higher relative concentration of amine with molar densities generally less than that of water and lower relative concentrations of carbonic acid salts (with molar density higher than water).


image file: c4ra08558b-f11.tif
Fig. 11 The density and calculated density based on molar volumes plotted against total solute concentration (g dL−1) for the polar bicarbonate solutions of CHP (observed solid blue diamonds, calculated open blue diamonds) DMOA (observed solid green squares, calculated open green squares), and DMCHA (observed solid red circles, calculated open red circles).

To quantitatively investigate how the density changes with concentration, “ideal” densities of SPS solutions can be calculated based on molecular densities. The density of the amine is 0.849 g mL−1 for DMCHA, 0.914 g mL−1 for CHP, and 0.765 g mL−1 for DMOA. The calculated molecular volume of 37.2 ml mol−1 for carbonic acid yields a density of 1.67 g mL−1. Water can be assumed to have a density of 1.0 g mL−1. Using the mass fractions of all solution species an “ideal” density which ignores the effects of partial molar volume can be calculated for all solutions, open symbols Fig. 11. The experimentally observed densities are higher than the “ideal” calculated. This difference or delta in density is representative of the mixtures partial molar properties.69 Partial molar properties are a measure of how intensive properties, such as density, change with component concentrations in a mixture. Deviations from ideal mixtures are usually attributed to a solute's influence on the solution structure of water.60 The structure of water is related to an aqueous solution's chemical potential and osmotic pressure. The partial molar properties are better visualized by plotting the delta, Δ, between the experimentally observed and “ideal” calculated values, Fig. 12.


image file: c4ra08558b-f12.tif
Fig. 12 The difference (Δ) between the empirically observed and “ideal” calculated densities, partial molar properties, listed in Fig. 8 plotted against total solute concentration (g dL−1) for the polar bicarbonate solutions of CHP (blue diamonds) DMOA (green squares), and DMCHA (red circles).

The consistent rise in the delta with concentration for osmotic SPS is indicative of a consistent rise in partial molar properties with concentration. This correlation between partial molar properties and concentration suggests a proportional increase in solute–solvent interactions with concentration and in turn steady increase in osmotic pressure. The Δ density for osmotic SPS appears to have nearly the same dependence on concentration (g dL−1) which suggests that the densities of unknown SPS should be predictable. The non-osmotic SPS, DMOA, was similar to the osmotic SPS in region I but displays a negative deviation from the osmotic SPS trend at higher concentrations. The non-osmotic SPS's smaller Δ density for a given concentration represents reduced solute–solvent interactions for the given concentration. These differences in partial molar properties are another example of how osmotic and non-osmotic SPS differ in behavior. The consistent proportionality between the Δ density and concentration supports the assertion that the osmotic SPS should have consistent osmotic behavior throughout the observed concentrations ranges.

Conclusion

In this study a method was developed to predict the viscosity of untested SPS draw solutes. This ability to predict viscosity complements the ability to predict the maximum concentration of osmotic SPS and empirically derived range for van't Hoff indices for osmotic SPS (ionic and molecular TDS van't Hoff index range from (0.73–0.94)). These predictive models provide powerful design tools for future variations of SPS draw solutes, and SPM, in general.

Concentration dependent solution states were characterized for non-osmotic SPS over a range of concentrations using freezing point depression, density, DOSY, quantitative NMR, and falling bob viscometry. This data indicates previously unknown solution states dominate at different concentrations. At dilute conditions, non-osmotic SPS behaved similarly to an osmotic SPS. This overlap in behavior between osmotic and non-osmotic SPS has not been demonstrated previously. As the concentration was increased, non-osmotic SPS could be described by solution states where protons are solvated by two amines (Option 3 and 5), which eventually transitioned to a solution state where the excess amine was not tightly associated with the acidic proton and was freely dissolved in the reduced polarity solution (Option 1). The osmotic SPS showed consistent behaviors for inherent viscosity, amine diffusion, and density based partial molar properties over the full range of known concentrations. This consistency of behavior for the osmotic SPS suggests that the osmotic pressures derived from low concentrations (<2 Osm kg−1, <100 atm) freezing point studies can be projected to higher concentrations.

Experimental

General experimental

Deionized water was used for these experiments. N,N-Dimethylcyclohexylamine (DMCHA) and N,N-dimethyloctylamine (DMOA) were obtained from Aldrich and used as received. 1-Cyclohexylpiperidine (CHP) was obtained from Alfa Aesar and used as received. All equipment was used in accordance with manufacturer specification unless stated otherwise. Freezing point depression osmometry was performed using an Advanced Instruments Inc. Model 3250 Osmometer. Viscosity measurements were made using the falling bob method with a Cambridge Applied Systems VL4100 viscometer. Densities were measured by filling a 10 ml volumetric flask with a sample and measuring the total mass and then accounting for the mass of the flask.

Generation of osmotic and non-osmotic SPS

As an example, deionized water (160.51 g) and N,N-dimethyloctylamine (328.95 g) are placed in a bottle equipped with a gas diffuser and exposed steady stream of carbon dioxide 50 ml min−1 delivered by a mass flow controller while being stirred with a magnetic stirring bar. After ∼24 h the reaction had reached an equilibrium point with ∼50 g of the amine unreacted. The reaction was run for another ∼24 h. The heavier polar phase was isolated with a separatory funnel. This polar phase was diluted with deionized water to produce 10–19 samples of various concentrations. When mixed after dilution, the osmotic SPS remained clear or quickly returned to a clear state. After dilution, the some samples of the non-osmotic SPS remained clear while others samples were cloudy. Given days to stabilize both the cloudy and non-cloudy non-osmotic SPS samples resolved into a polar phase and an organic phase.

In the case of osmotic SPS N,N-dimethylcyclohexylamine and 1-cyclohexylpiperidine, diluted samples were used promptly. The non-osmotic SPS N,N-dimethyloctylamine was allowed to equilibrate for several months to allow complete separation. Samples for various experiments were obtained by withdrawing solution from the polar phase with a needle or volumetric pipet. All concentrations used in this study were determined with quantities NMR measurements described previously.49

NMR experiments

Nuclear magnetic resonance (NMR) spectra were acquired on a Bruker Avance III 600 MHz spectrometer running Topspin Version 3.0 with a magnetic field strength of 14.093 Tesla, corresponding to operating frequencies of 600.13 MHz (1H), and 150.90 MHz (13C). All NMR spectra were acquired on samples using a co-axial insert containing C6D6 (Cambridge Isotopes Laboratories) with temperature regulated to 298 K. 1H NMR spectra were collected with a 30 degree pulse and 10 s delays between scans, the T1 of every integrated shift was verified. Most T1 relaxations well under 1 s and none above 2 s. The integration was set to a known peak in of the tertiary amine providing the relative concentration of (H2O + H2CO3)[thin space (1/6-em)]:[thin space (1/6-em)]tertiary amine. 13C NMR spectra with quantifiable integration were obtained with inverse gated decoupling spectra with a 30 degree pulse and 60 s delays between scans. The 13C T1 values were verified and found to range between 2.5 s and 10.5 s for the carbonic acid salts peak, all other peaks had shorter relaxation times. The integration of the carbonic acid salts peaks was set to unity providing the relative concentration of tertiary amine[thin space (1/6-em)]:[thin space (1/6-em)]carbonic acid salts. Standard DOSY (stimulated echo bipolar gradient pulses for diffusion with 1 spoil gradient, pulse sequence, stebpg1s) protocols where used for 1H DOSYs. For 13C DOSYs an inverse-gated pulse sequence was supplied by Bruker to ensure the protonated and unprotonated carbons (such as bicarbonate) quantifiable integration. For the amines, each chemical shift was independently evaluated; the reported diffusion coefficients are averaged values of the best fit data based on intensity or area. The reported diffusion coefficient are derived from the exchangeable proton (1H DOSY) and carbonic acid salts (13C DOSY) peaks.

Acknowledgements

This work was supported by the United States Department of Energy through contract DE-AC07-05ID14517. Funding was supplied by Idaho National Laboratory via the Laboratory Directed Research and Development program. The authors thank Nicole K. Kruse of Bruker BioSpin for supplying the 13C DOSY pulse sequence.

References

  1. P. G. Jessop, S. M. Mercer and D. J. Heldebrant, Energy Environ. Sci., 2012, 5, 7240–7253 CAS.
  2. R. Vijayaraghavan and D. R. MacFarlane, ACS Sustainable Chem. Eng., 2014, 2, 1724–1728 CrossRef CAS.
  3. C. Samorì, D. L. Barreiro, R. Vet, L. Pezzolesi, D. W. F. Brilman, P. Galletti and E. Tagliavini, Green Chem., 2013, 15, 353–356 RSC.
  4. C. Samorì, C. Torri, G. Samorì, D. Fabbri, P. Galletti, F. Guerrini, R. Pistocchi and E. Tagliavini, Bioresour. Technol., 2010, 101, 3274–3279 CrossRef PubMed.
  5. Y. Du, B. Schuur, C. Samorì, E. Tagliavini and D. W. F. Brilman, Bioresour. Technol., 2013, 149, 253–260 CrossRef CAS PubMed.
  6. A. R. Boyd, P. Champagne, P. J. McGinn, K. M. MacDougall, J. E. Melanson and P. G. Jessop, Bioresour. Technol., 2012, 118, 628–632 CrossRef CAS PubMed.
  7. C. Samorì, L. Pezzolesi, D. L. Barreiro, P. Galletti, A. Pasteris and E. Tagliavini, RSC Adv., 2014, 4, 5999–6008 RSC.
  8. P. G. Jessop, L. Kozycz, Z. G. Rahami, D. Schoenmakers, A. R. Boyd, D. Wechsler and A. M. Holland, Green Chem., 2011, 13, 619–623 RSC.
  9. A. Holland, D. Wechsler, A. Patel, B. M. Molloy, A. R. Boyd and P. G. Jessop, Can. J. Chem., 2012, 90, 805–810 CrossRef CAS.
  10. D. Fu, S. Farag, J. Chaouki and P. G. Jessop, Bioresour. Technol., 2014, 154, 101–108 CrossRef CAS PubMed.
  11. Q. Zhang, N. S. Oztekin, J. Barrault, K. De Oliveira Vigier and F. Jérôme, ChemSusChem, 2013, 6, 593–596 CrossRef CAS PubMed.
  12. I. Anugwom, V. Eta, P. Virtanen, P. Mäki-Arvela, M. Hedenström, M. Hummel, H. Sixta and J.-P. Mikkola, ChemSusChem, 2014, 7, 1170–1176 CrossRef CAS PubMed.
  13. D. Agar, Y. Tan and Z. Xiahui, US Pat., US8470079 B2, 2013 Search PubMed.
  14. J. Zhang, J. Chen, R. Misch and D. W. Agar, Chem. Eng. Trans., 2010, 21, 169–174 CrossRef.
  15. J. Zhang, R. Misch, Y. Tan and D. W. Agar, Chem. Eng. Technol., 2011, 34, 1481–1489 CrossRef CAS.
  16. J. Zhang, D. W. Agar, X. Zhang and F. Geuzebroek, Energy Procedia, 2011, 4, 67–74 CrossRef CAS.
  17. J. Zhang, Y. Qiao and D. W. Agar, Energy Procedia, 2012, 23, 92–101 CrossRef CAS.
  18. J. Zhang, Y. Qiao and D. W. Agar, Chem. Eng. Res. Des., 2012, 90, 743–749 CrossRef CAS.
  19. D. D. D. Pinto, S. A. H. Zaidy, A. Hartono and H. F. Svendsen, Int. J. Greenhouse Gas Control, 2014, 28, 318–327 CrossRef CAS.
  20. J. R. Switzer, A. L. Ethier, E. C. Hart, K. M. Flack, A. C. Rumple, J. C. Donaldson, A. T. Bembry, O. M. Scott, E. J. Biddinger, M. Talreja, M.-G. Song, P. Pollet, C. A. Eckert and C. L. Liotta, ChemSusChem, 2014, 7, 299–307 CrossRef CAS PubMed.
  21. M. L. Stone, C. Rae, F. F. Stewart and A. D. Wilson, Desalination, 2013, 312, 124–129 CrossRef CAS.
  22. Y. Cai, W. Shen, R. Wang, W. B. Krantz, A. G. Fane and X. Hu, Chem. Commun., 2013, 49, 8377–8379 RSC.
  23. D. L. Shaffer, J. R. Werber, H. Jaramillo, S. Lin and M. Elimelech, Desalination, 2015, 356, 271–284 CrossRef CAS.
  24. M. Olsson, G. L. Wick and J. D. Isaacs, Science, 1979, 206, 452–454 CAS.
  25. K. L. Lee, R. W. Baker and H. K. Lonsdale, J. Membr. Sci., 1981, 8, 141–171 CrossRef CAS.
  26. S. E. Skilhagen, J. E. Dugstad and R. J. Aaberg, Desalination, 2008, 220, 476–482 CrossRef CAS.
  27. T. Thorsen and T. Holt, J. Membr. Sci., 2009, 335, 103–110 CrossRef CAS.
  28. A. Achilli and A. E. Childress, Desalination, 2010, 261, 205–211 CrossRef CAS.
  29. N. Y. Yip and M. Elimelech, Environ. Sci. Technol., 2011, 45, 10273–10282 CrossRef CAS PubMed.
  30. N. Y. Yip and M. Elimelech, Environ. Sci. Technol., 2012, 46, 5230–5239 CrossRef CAS PubMed.
  31. I. Alsvik and M.-B. Hägg, Polymers, 2013, 5, 303–327 CrossRef.
  32. M. S. Islam, T. Ali, A. U. Ahmed, S. A. Karim and H. Mursalin, Adv. Mater. Res., 2013, 684, 680–685 CrossRef.
  33. A. P. Straub, N. Y. Yip and M. Elimelech, Environ. Sci. Technol. Lett., 2014, 1, 55–59 CrossRef CAS.
  34. F. Helfer, C. Lemckert and Y. G. Anissimov, J. Membr. Sci., 2014, 453, 337–358 CrossRef CAS.
  35. T. Y. Cath, A. E. Childress and M. Elimelech, J. Membr. Sci., 2006, 281, 70–87 CrossRef CAS.
  36. L. A. Hoover, W. A. Phillip, A. Tiraferri, N. Y. Yip and M. Elimelech, Environ. Sci. Technol., 2011, 45, 9824–9830 CrossRef CAS PubMed.
  37. T.-S. Chung, S. Zhang, K. Y. Wang, J. Su and M. M. Ling, Desalination, 2012, 287, 78–81 CrossRef CAS.
  38. R. H. Shaack, US1885393 A, 1932.
  39. J. R. McCutcheon, R. L. McGinnis and M. Elimelech, Desalination, 2005, 174, 1–11 CrossRef CAS.
  40. G. T. Gray, J. R. McCutcheon and M. Elimelech, Desalination, 2006, 197, 1–8 CrossRef CAS.
  41. J. R. McCutcheon and M. Elimelech, J. Membr. Sci., 2006, 284, 237–247 CrossRef CAS.
  42. J. R. McCutcheon, R. L. McGinnis and M. Elimelech, J. Membr. Sci., 2006, 278, 114–123 CrossRef CAS.
  43. R. L. McGinnis and M. Elimelech, Desalination, 2007, 207, 370–382 CrossRef CAS.
  44. R. L. McGinnis, J. R. McCutcheon and M. Elimelech, J. Membr. Sci., 2007, 305, 13–19 CrossRef CAS.
  45. R. L. McGinnis, N. T. Hancock, M. S. Nowosielski-Slepowron and G. D. McGurgan, Desalination, 2013, 312, 67–74 CrossRef CAS.
  46. N. Hancock, Engineered Osmosis for Energy Efficient Separations: Optimizing Waste Heat Utilization FINAL SCIENTIFIC REPORT DOE F 241.3 DE-EE0003467, 2013.
  47. J. R. Vanderveen, J. Durelle and P. G. Jessop, Green Chem., 2014, 16, 1187–1197 RSC.
  48. J. Durelle, J. R. Vanderveen and P. G. Jessop, Phys. Chem. Chem. Phys., 2014, 16, 5270–5275 RSC.
  49. A. D. Wilson and F. F. Stewart, RSC Adv., 2014, 4, 11039–11049 RSC.
  50. A. D. Wilson and C. J. Orme, unpublished results, 2014.
  51. G. Carmignani, S. Sitkiewitz and J. W. Webley, US20120267308 A1, 2012.
  52. P. G. Jessop, S. M. Mercer, T. Robert, R. S. Brown, T. J. Clark, B. Mariampillai, R. Resendes and D. Wechsler, US20140076810 A1, 2014.
  53. Q. Ge, J. Su, G. L. Amy and T.-S. Chung, Water Res., 2012, 46, 1318–1326 CrossRef CAS PubMed.
  54. R. Ou, Y. Wang, H. Wang and T. Xu, Desalination, 2013, 318, 48–55 CrossRef CAS.
  55. Y. Mok, D. Nakayama, M. Noh, S. Jang, T. Kim and Y. Lee, Phys. Chem. Chem. Phys., 2013, 15, 19510–19517 RSC.
  56. C. X. Guo, D. Zhao, Q. Zhao, P. Wang and X. Lu, Chem. Commun., 2014, 50, 7318–7321 RSC.
  57. M. L. Stone, A. D. Wilson, M. K. Harrup and F. F. Stewart, Desalination, 2013, 312, 130–136 CrossRef CAS.
  58. A. D. Wilson and F. F. Stewart, J. Membr. Sci., 2013, 431, 205–211 CrossRef CAS.
  59. D. E. Goldsack and R. Franchetto, Can. J. Chem., 1977, 55, 1062–1072 CrossRef CAS.
  60. Y. Marcus, J. Mol. Liq., 2011, 158, 23–26 CrossRef CAS.
  61. S. Zhao and L. Zou, J. Membr. Sci., 2011, 379, 459–467 CrossRef CAS.
  62. Y. Fang, L. Bian and X. Wang, J. Membr. Sci., 2013, 437, 72–81 CrossRef CAS.
  63. J. F. Greco, M. J. McNevin, R. K. Shoemaker and J. R. Hagadorn, Organometallics, 2008, 27, 1948–1953 CrossRef CAS.
  64. P. Timmerman, J.-L. Weidmann, K. A. Jolliffe, L. J. Prins, D. N. Reinhoudt, S. Shinkai, L. Frish and Y. Cohen, J. Chem. Soc., Perkin Trans. 2, 2000, 2077–2089 RSC.
  65. A. R. Waldeck, P. W. Kuchel, A. J. Lennon and B. E. Chapman, Prog. Nucl. Magn. Reson. Spectrosc., 1997, 30, 39–68 CrossRef CAS.
  66. J. S. McNally and A. D. Wilson, manuscript in preparation, 2014.
  67. J. M. Briggs, T. B. Nguyen and W. L. Jorgensen, J. Phys. Chem., 1991, 95, 3315–3322 CrossRef CAS.
  68. D. Nakayama, Y. Mok, M. Noh, J. Park, S. Kang and Y. Lee, Phys. Chem. Chem. Phys., 2014, 16, 5319–5325 RSC.
  69. F. Franks and H. H. Johnson, Trans. Faraday Soc., 1962, 58, 656–661 RSC.

This journal is © The Royal Society of Chemistry 2015