Unprecedented formation of organo-ruthenium(II) complexes containing 2-hydroxy-1-naphthaldehyde S-benzyldithiocarbazate: synthesis, X-ray crystal structure, DFT study and their biological activities in vitro†
Paranthaman
Vijayan
a,
Periasamy
Viswanathamurthi
*a,
Paramasivam
Sugumar
b,
Mondikalipudur Nanjappagounder
Ponnuswamy
b,
Manickam Dakshinamoorthi
Balakumaran
c,
Pudupalayam Thangavelu
Kalaichelvan
c,
Krishnaswamy
Velmurugan
d,
Raju
Nandhakumar
d and
Ray Jay
Butcher
e
aDepartment of Chemistry, Periyar University, Salem - 636 011, India. E-mail: viswanathamurthi72@gmail.com; Fax: +91 427 2345124
bCentre of Advanced Studies in Crystallography and Biophysics, University of Madras, Guindy Campus, Chennai - 600 025, India
cCentre for Advanced Study in Botany, School of Life Sciences, University of Madras, Guindy Campus, Chennai - 600 025, Tamil Nadu, India
dDepartment of Chemistry, Karunya University, Karunya Nagar, Coimbatore - 641 114, India
eDepartment of Chemistry, Howard University, 525 College Street NW, Washington, DC 20059, USA
First published on 11th May 2015
Abstract
As a contribution to the development of new ruthenium complexes with pharmacologically interesting properties, two new mononuclear ruthenium(II) complexes of the general formula [Ru(H-Nap-sbdtc)Cl(CO)(EPh3)2] (1 & 2) [H-(Nap-sbdtc) = 2-hydroxy-1-naphthaldehyde-S-benzyl-dithiocarbazate; E = P or As] were synthesized. The new ruthenium(II) carbonyl complexes are remarkably stable and were obtained in good yields. Their identities have been established by satisfactory elemental analyses and various spectroscopic techniques (IR, UV/visible, (1H, 13C, and 31P) NMR, and ESI-MS). For a better definition, the molecular structure of complexes 1 and 2 has been determined by X-ray crystallography, which confirms the coordination mode of the ligand and reveals a distorted octahedral geometry around the ruthenium ion. The molecular structure of complexes 1 and 2 has been optimized by DFT calculations. The binding affinity and binding mode of the ligand and their ruthenium(II) complexes toward calf thymus CT-DNA were determined by the emission spectral method, the fluorescent indicator displacement (FID) assay and viscosity measurements. Further, the interactions of the ligand and their complexes 1 and 2 with bovine serum albumin (BSA) were investigated using UV-Vis and fluorescence spectroscopic methods. Absorption and emission spectral studies indicate that complexes 1 and 2 interact with CT-DNA and BSA protein more strongly than their parent ligand. In addition, the interactions of the complexes with DNA/BSA were followed by electrophoretic mobility spectrometry studies and the results show that these complexes exhibited good cleavage properties. In vitro anticancer activity has been scrutinized by the MTT assay, acridine orange/ethidium bromide (AO/EB) and diamidino-2-phenylindole (DAPI) staining against the human cervical cancer (HeLa) cell line.
Introduction
The present challenges of inorganic medicinal chemistry are (a) to improve the therapeutic performance of classic platinum anticancer drugs such as cisplatin, carboplatin and oxaliplatin, based on over 30 years of research and successful clinical use1 and (b) to open a new scenario by investigating the potential activity of metal drugs for the diagnosis and therapy of other pathologies, mainly cancer diseases, where an aberrant biochemistry of endogenous metals seems to have a relevant role.2 Nevertheless, there is limited effectiveness due to severe side effects and acquired resistance due to prolonged treatment has spurred investigators to find alternative metal based drugs.3 Among them, ruthenium-based complexes, which exhibit considerable promise in antiproliferation activity and lower toxicity than platinum drugs, have been developed in the last two epochs. In particular, the ruthenium complexes, [HIm][trans-RuCl4(DMSO)(Im)] (NAMI-A) and [ImH][trans-Ru-Cl4(Im)2] (KP1019), have progressed into clinical trials with very promising results.4,5 The mechanism of action of the above ruthenium complexes has been widely studied in order to establish the basis for their unique properties, and it would appear that three main features are relevant: first, they interact with serum proteins such as albumin and transferrin that endows them with tumor seeking properties;6a second, ruthenium(III) complexes appear to be activated through intracellular reduction to allow generation of toxic ruthenium(II) species;6b and third, at the tumor site reactions (binding) with proteins are preferred to DNA binding, which contrasts with the behavior of platinum(II) complexes such as cisplatin.6c Extrapolation of these pathways led to the direct evaluation of ruthenium(II) complexes.6d,e On the other hand, most of the recent research on anticancer ruthenium(II) compounds has shown that drugs (metal complexes) not only bind to the primary target DNA, but also strongly interact with serum albumin proteins such as BSA and HSA. It is essential to explore drug–protein interactions as most of the drugs bound to serum albumin are usually transported as a protein complex. Attention has also been focused on the proteins that drive and control cell cycle progression.7 Therefore, development of the anticancer agents targeting both DNA and BSA proteins are highly sought after.Schiff bases derived from S-alkyl/aryl esters of dithiocarbazic acid have backbones similar to those of thiosemicarbazones, differing only in the terminal non-coordinating functional group attached to the thiocarbonyl moiety. Metal chelates of dithiocarbazic acid derivatives represent a class of organic compounds that have been explored because of their broad range of biological activities.8 Although the synthesis of S-benzyldithiocarbazates and its derivatives has been under study for many years, considerable attention continues to be given to their metal complexes, since their properties can be greatly modified by introducing different substituents.9 The presence of nitrogen and sulfur atoms as medium and low crystal-field donors (hard–soft ligands) gives dithiocarbazates good ability to coordinate metal ions, yielding metal complexes with interesting structural and electronic properties.10 In S-substituted dithiocarbazate compounds, owing to thione–thiol tautomer (Scheme 1), N and S donor atoms were linked to the metal ion with the construction of five- or six-membered rings.11,12 The coordination of S-benzyldithiocarbazate to ruthenium ions hopefully gives better bioactive performance.
 | ||
| Scheme 1 Thione and thiol forms of 2-hydroxy-1-naphthaldehyde-S-benzyldithiocarbazate [H2-(Nap-sbdtc)]. | ||
In this paper, we have described two new organo-ruthenium complexes comprising naphthaldehyde based dithiocarbazates, as shown in Scheme 2, together with DFT study and their binding ability towards calf thymus (CT) DNA/BSA protein. Furthermore, their manifest cytotoxic activity towards normal Vero cell line and HeLa (human cervical cancer) cell line is evaluated using the MTT assay and cell death analysis by AO/EB and DAPI staining.
 | ||
| Scheme 2 Synthetic strategy of the complexes described in this work. Unprecedented coordinating groups are shown in distinct colors. | ||
Experimental section
Materials
The dithiocarbazate ligand [H2-(Nap-sbdtc)] was synthesized according to a previously published method with slight modifications.13a The ruthenium precursor [RuHCl(CO)(EPh3)3] [E = P or As] was synthesized based on the standard procedures.13b All synthetic manipulations were routinely performed under an oxygen atmosphere. All the reagents used in this study were of reagent grade and used without further purification. Solvents were purified and dried according to the standard procedures. Doubly distilled water was used to prepare buffers. Calf thymus DNA (CT-DNA), agarose, protein markers and bovine serum albumin (BSA) were obtained from Genei, Bangalore and Himedia, India respectively. RuCl3·3H2O, ethidium bromide (EB), methylene blue, and tris(hydroxymethyl) amino methane were purchased from Sigma-Aldrich and used as received.General methods
Elemental analyses (C, H, N and S) were carried out on a Vario EL III CHNS analyzer at SAIF-Cochin, India. Infrared spectra were recorded as KBr pellets using a Perkin-Elmer FT-IR spectrophotometer in the range 4000–400 cm−1. 1H and 13C NMR spectra were recorded on a Bruker Ultra Shield at 300 MHz using CDCl3 as a solvent and TMS as an internal reference. Mass spectra for the complexes were recorded on an advanced Q-TOF micro™ mass spectrometer using an electrospray ionization probe. Electronic spectra have been obtained on a JASCO V-570 spectrophotometer. Geometry optimization by the density functional theory (DFT) method was performed using the GAUSSIAN09 (B3LYP/LANL2DZ) package. Fluorescence spectral data were obtained on a JASCO FP-8200 fluorescence spectrophotometer at room temperature. Gel electrophoresis was carried out using a Bio-Rad UV transilluminator and their image has taken by a Sony cyber shot WX60. Single crystal X-ray diffraction data collections were carried out at 173 K on a Bruker Apex-II CCD diffractometer equipped with a liquid nitrogen cryostat. The melting points were checked on a technico micro heating apparatus and are uncorrected. Stock solutions of ruthenium(II) complexes (1.0 × 10⁻³ M in DMSO) were stored at 4 °C and required concentrations prepared for all experiments. All the stock solutions were used after no more than four days. Solutions of compounds were freshly prepared 1 hour prior to biochemical evaluation. Data were expressed as the mean ± standard deviation from three independent experiments.Synthetic procedure for new ruthenium(II) complexes
A solution of [H2-(Nap-sbdtc)] (0.029 g; 0.1 mmol) in 20 mL of MeOH/CHCl3 (1![[thin space (1/6-em)]](https://www.rsc.org/images/entities/char_2009.gif) :
:![[thin space (1/6-em)]](https://www.rsc.org/images/entities/char_2009.gif) 1 v/v) was added dropwise to a boiling solution of [RuHCl(CO)(EPh3)3] (E = P or As) (0.100 g; 0.1 mmol) in an MeOH/CHCl3 solvent mixture (1
1 v/v) was added dropwise to a boiling solution of [RuHCl(CO)(EPh3)3] (E = P or As) (0.100 g; 0.1 mmol) in an MeOH/CHCl3 solvent mixture (1![[thin space (1/6-em)]](https://www.rsc.org/images/entities/char_2009.gif) :
:![[thin space (1/6-em)]](https://www.rsc.org/images/entities/char_2009.gif) 1 v/v) (20 mL). The mixture was gently heated under reflux for 8 hours, which resulted in a rapid change of color from light orange to dark red (maroon). The reaction was monitored by thin-layer chromatography (TLC) using a silica gel on aluminum sheets with a 20/80 mixture of ethyl acetate/pet. ether as the mobile phase. After refluxing, the resulting solution was filtered and the filtrate was left unperturbed for the slow evaporation of the solvent. After four days yellowish orange colored big crystals suitable for X-ray diffraction were obtained.
1 v/v) (20 mL). The mixture was gently heated under reflux for 8 hours, which resulted in a rapid change of color from light orange to dark red (maroon). The reaction was monitored by thin-layer chromatography (TLC) using a silica gel on aluminum sheets with a 20/80 mixture of ethyl acetate/pet. ether as the mobile phase. After refluxing, the resulting solution was filtered and the filtrate was left unperturbed for the slow evaporation of the solvent. After four days yellowish orange colored big crystals suitable for X-ray diffraction were obtained.
![[double bond, length as m-dash]](https://www.rsc.org/images/entities/char_e001.gif) N); 1290 ν(C–O), 771 ν(C–S), 1952 ν(C
N); 1290 ν(C–O), 771 ν(C–S), 1952 ν(C![[triple bond, length as m-dash]](https://www.rsc.org/images/entities/char_e002.gif) O), 1064 ν(N–N), 1442 ν{Ph(P–Ph)}; UV-vis (CHCl3), λmax (nm): 261, 338, 382, 408, 427. 1H NMR (300.13 MHz, CDCl3, ppm): 3.90 (s, 2H, –CH2); 8.84 (s, 1H, –CH
O), 1064 ν(N–N), 1442 ν{Ph(P–Ph)}; UV-vis (CHCl3), λmax (nm): 261, 338, 382, 408, 427. 1H NMR (300.13 MHz, CDCl3, ppm): 3.90 (s, 2H, –CH2); 8.84 (s, 1H, –CH![[double bond, length as m-dash]](https://www.rsc.org/images/entities/char_e001.gif) N); 9.19 (s, 1H, –OH); 6.97–7.78 (m, 11H, Ar); 13C NMR (300.13 MHz, CDCl3, ppm): 204.04 (C
N); 9.19 (s, 1H, –OH); 6.97–7.78 (m, 11H, Ar); 13C NMR (300.13 MHz, CDCl3, ppm): 204.04 (C![[triple bond, length as m-dash]](https://www.rsc.org/images/entities/char_e002.gif) O), 185.42 (C–S), 159.56 (–CH
O), 185.42 (C–S), 159.56 (–CH![[double bond, length as m-dash]](https://www.rsc.org/images/entities/char_e001.gif) N), 151.81 (C–O), 134.54 (Ar C), 134.25 (Ar C), 133.96 (Ar C), 133.83 (Ar C), 133.74 (Ar C), 133.66 (Ar C), 133.10 (Ar C), 132.80 (Ar C), 132.51 (Ar C), 3132.01 (Ar C), 134.54 (Ar C), 129.42 (Ar C), 129.35 (Ar C), 128.91 (Ar C), 128.67 (Ar C), 128.49 (Ar C), 128.16 (Ar C), 128.08 (Ar C), 127.88 (Ar C), 127.82 (Ar C), 127.76 (Ar C), 127.67 (Ar C), 127.63 (Ar C), 127.11 (Ar C), 126.85 (Ar C), 126.73 (Ar C), 122.74 (Ar C), 122.01 (Ar C), 118.46 (Ar C), 118.28 (Ar C), 34.76 (–CH2); 31P NMR (162 MHz, DMSO-d6, ppm) 32.13; ESI-MS (calcd, found, m/z) = 1005.1, 1005.4 (M − Cl)+. Single crystals suitable for X-ray determination were grown by slow evaporation of a methanol–chloroform (1
N), 151.81 (C–O), 134.54 (Ar C), 134.25 (Ar C), 133.96 (Ar C), 133.83 (Ar C), 133.74 (Ar C), 133.66 (Ar C), 133.10 (Ar C), 132.80 (Ar C), 132.51 (Ar C), 3132.01 (Ar C), 134.54 (Ar C), 129.42 (Ar C), 129.35 (Ar C), 128.91 (Ar C), 128.67 (Ar C), 128.49 (Ar C), 128.16 (Ar C), 128.08 (Ar C), 127.88 (Ar C), 127.82 (Ar C), 127.76 (Ar C), 127.67 (Ar C), 127.63 (Ar C), 127.11 (Ar C), 126.85 (Ar C), 126.73 (Ar C), 122.74 (Ar C), 122.01 (Ar C), 118.46 (Ar C), 118.28 (Ar C), 34.76 (–CH2); 31P NMR (162 MHz, DMSO-d6, ppm) 32.13; ESI-MS (calcd, found, m/z) = 1005.1, 1005.4 (M − Cl)+. Single crystals suitable for X-ray determination were grown by slow evaporation of a methanol–chloroform (1![[thin space (1/6-em)]](https://www.rsc.org/images/entities/char_2009.gif) :
:![[thin space (1/6-em)]](https://www.rsc.org/images/entities/char_2009.gif) 1 v/v) solution of 1 at room temperature.
1 v/v) solution of 1 at room temperature.
![[double bond, length as m-dash]](https://www.rsc.org/images/entities/char_e001.gif) N); 1282 ν(C–O), 779 ν(C–S), 1961 ν(C
N); 1282 ν(C–O), 779 ν(C–S), 1961 ν(C![[triple bond, length as m-dash]](https://www.rsc.org/images/entities/char_e002.gif) O), 1072 ν(N–N), 1433 ν{Ph(As–Ph)}; UV-vis (CHCl3), λmax (nm): 266, 342, 370, 400, 432; 1H NMR (300.13 MHz, CDCl3, ppm): 3.95 (s, 2H, –CH2); 9.14 (s, 1H, –CH
O), 1072 ν(N–N), 1433 ν{Ph(As–Ph)}; UV-vis (CHCl3), λmax (nm): 266, 342, 370, 400, 432; 1H NMR (300.13 MHz, CDCl3, ppm): 3.95 (s, 2H, –CH2); 9.14 (s, 1H, –CH![[double bond, length as m-dash]](https://www.rsc.org/images/entities/char_e001.gif) N); 11.42 (s, 1H, –OH); 6.78–7.65 (m, 11H, Ar); 13C NMR (300.13 MHz, CDCl3, ppm) 203.82 (C
N); 11.42 (s, 1H, –OH); 6.78–7.65 (m, 11H, Ar); 13C NMR (300.13 MHz, CDCl3, ppm) 203.82 (C![[triple bond, length as m-dash]](https://www.rsc.org/images/entities/char_e002.gif) O), 184.83 (C–S), 158.22 (–CH
O), 184.83 (C–S), 158.22 (–CH![[double bond, length as m-dash]](https://www.rsc.org/images/entities/char_e001.gif) N), 150.81 (C–O), 136.69 (Ar C), 133.56 (Ar C), 133.43 (Ar C), 133.35 (Ar C), 132.96 (Ar C), 132.22 (Ar C), 132.16 (Ar C), 129.30 (Ar C), 128.60 (Ar C), 128.37 (Ar C), 128.25 (Ar C), 128.11 (Ar C), 127.87 (Ar C), 127.46 (Ar C), 127.18 (Ar C), 126.87 (Ar C), 122.82 (Ar C), 121.88 (Ar C), 118.22 (Ar C), 108.98 (Ar C), 34.79 (–CH2); ESI-MS (Calcd, found, m/z) = 1093.0, 1093.5 (M − Cl)+. Single crystals suitable for X-ray determination were grown by slow evaporation of an ethanol–dichloromethane (1
N), 150.81 (C–O), 136.69 (Ar C), 133.56 (Ar C), 133.43 (Ar C), 133.35 (Ar C), 132.96 (Ar C), 132.22 (Ar C), 132.16 (Ar C), 129.30 (Ar C), 128.60 (Ar C), 128.37 (Ar C), 128.25 (Ar C), 128.11 (Ar C), 127.87 (Ar C), 127.46 (Ar C), 127.18 (Ar C), 126.87 (Ar C), 122.82 (Ar C), 121.88 (Ar C), 118.22 (Ar C), 108.98 (Ar C), 34.79 (–CH2); ESI-MS (Calcd, found, m/z) = 1093.0, 1093.5 (M − Cl)+. Single crystals suitable for X-ray determination were grown by slow evaporation of an ethanol–dichloromethane (1![[thin space (1/6-em)]](https://www.rsc.org/images/entities/char_2009.gif) :
:![[thin space (1/6-em)]](https://www.rsc.org/images/entities/char_2009.gif) 1 v/v) solution of 2 at room temperature.
1 v/v) solution of 2 at room temperature.
X-ray structure determination
Suitable single crystals of complexes 1 and 2 were mounted on a glass fiber with epoxy cement. The crystals were cut into a fitting size (less than collimator cross section diameter). The crystal data collections were performed with an automated Xcalibur, Ruby, Gemini at 123(2) and a Bruker SMART APEX 2 at 296(2) CCD diffractometer using graphite monochromatized Mo (Kα) (λ = 0.71073 Å). The data were corrected for Lorentz and polarization effects with the SMART14 suite programs and for absorption effects with SADABS. A data collection strategy using ω and φ scans at 0.5° scan technique yielded full hemispherical data with excellent intensity statistics. Structure solutions and refinements were performed using the programs SHELXS-9715 and SHELXL-13. The structures were solved by direct methods to locate the heavy atoms, followed by difference maps for the light non-hydrogen atoms. Anisotropic thermal parameters were refined for the rest of the non-hydrogen atoms. Hydrogen atoms were placed geometrically and refined isotropically. Crystal data and experimental details for the crystals 1 and 2 are shown in Table 2.Computational method (DFT)
All computations were performed using the GAUSSIAN09 (G09) program. Full geometry optimizations of complexes 1 and 2 were carried out using the DFT method at the Becke's three-parameter hybrid exchange functional (B3LYP) level of theory.16 This functional has been shown to give more accurate results for organometallic complexes. The metal atom was described using the Lee–Yang–Parr nonlocal correlation functional (LANL2DZ) basis set while all the non-metal atoms were described using the 6-31G* basis set. Gauss sum was used to calculate the fractional contributions of various groups to each molecular orbital. A difference between the experimental and theoretical studies is that computations were done in the gas phase, whereas the X-ray data were obtained in the solid phase for complexes. Geometry optimizations have been done without any symmetry restriction by X-ray coordinates of the molecule. Frequencies of all complexes have been computed at the same level of theory to confirm that all optimized structures are at true minima, which means they have no imaginary frequencies. At the same level and basis sets, calculations of the natural electron population, natural charge for each atom and frontier molecular orbitals of the complexes have been performed by natural bond orbital (NBO) analysis on the gas phase optimized structures.17 The molecular orbital plots have been generated using the Chemcraft program package (http://www.chemcraftprog.com).DNA interaction studies
Bovine serum albumin interaction studies
![[thin space (1/6-em)]](https://www.rsc.org/images/entities/char_2009.gif) :
:![[thin space (1/6-em)]](https://www.rsc.org/images/entities/char_2009.gif) 2
2![[thin space (1/6-em)]](https://www.rsc.org/images/entities/char_2009.gif) :
:![[thin space (1/6-em)]](https://www.rsc.org/images/entities/char_2009.gif) 7 v/v) and destaining was done with a water–methanol–acetic acid mixture (5
7 v/v) and destaining was done with a water–methanol–acetic acid mixture (5![[thin space (1/6-em)]](https://www.rsc.org/images/entities/char_2009.gif) :
:![[thin space (1/6-em)]](https://www.rsc.org/images/entities/char_2009.gif) 4
4![[thin space (1/6-em)]](https://www.rsc.org/images/entities/char_2009.gif) :
:![[thin space (1/6-em)]](https://www.rsc.org/images/entities/char_2009.gif) 1 v/v) for 4 h. The gels after destaining were scanned and the images were photographed.
1 v/v) for 4 h. The gels after destaining were scanned and the images were photographed.
MTT assay
The IC50 values were determined by nonlinear regression analysis using Origin 6.0 software.
Results and discussion
Synthesis and characterization
We have relied on the use of the stable starting materials [RuHClCO(EPh3)3] (E = P or As) during the synthesis of our ruthenium(II) carbonyl complexes. The dithiocarbazate ligand [H2-(Nap-sbdtc)] was synthesized via the typical condensation route from their parent S-benzyldithiocarbazate and 2-hydroxy-1-naphthaldehyde. Successively, complexes 1 and 2 were prepared via refluxing the equimolar amount of [H2-(Nap-sbdtc)] with [RuHCl(CO)(EPh3)3] (E = P or As). In this reaction, the ligand H2-(Nap-sbdtc) acted as a monobasic bidentate ligand with a NS fashion replacing a hydride and a triphenylphosphine/triphenylarsine ligand from the corresponding starting complexes and resulted in a rapid change of color from light orange to dark red (maroon). The slow evaporation of the subsequent solution afforded red crystalline ruthenium(II) carbonyl complexes [Ru(H-Nap-sbdtc)(CO)Cl(PPh3)2] (1) and [Ru(H-Nap-sbdtc)(CO)Cl(AsPh3)2] (2) (Scheme 2).The complexes under investigation are crystalline and non-hygroscopic solids, air-stable in solution and in the solid state at room temperature, soluble in common organic solvents such as methanol, ethanol, benzene, chloroform, dichloromethane, acetone, dimethylsulfoxide, dimethylformamide, and insoluble in hexane, petroleum ether, and diethyl ether. These have been characterized by satisfactory elemental analyses, ESI-MS, IR, NMR (1H, 13C, 31P) and UV-vis spectral studies. In addition, the structures of complexes 1 and 2 were confirmed by single crystal X-ray crystallography.
Spectroscopic studies
IR spectra of the free ligand were compared with new ruthenium(II) complexes in order to confirm the significant indications regarding coordination of dithiocarbazate. No attempt has been made to assign each individual band to a specific vibration. However the IR spectrum of H2-(Nap-sbdtc) exhibited many intense bands at 3394, 1621 and 817 cm−1 corresponding to (νOH), (νC![[double bond, length as m-dash]](https://www.rsc.org/images/entities/char_e001.gif) N) and (νC
N) and (νC![[double bond, length as m-dash]](https://www.rsc.org/images/entities/char_e001.gif) S) respectively.21 In the IR spectra of the new complexes, the absorption of a broad signal at 3394 cm−1 due to the uncoordinated phenolic –OH group was observed in complexes 1 and 2. This may be due to the formation of intramolecular hydrogen bonding between phenolic –OH and either N1 nitrogen atom.22 A sharp band appeared at 1601 and 1609 cm−1 corresponding to the azomethine ν(C
S) respectively.21 In the IR spectra of the new complexes, the absorption of a broad signal at 3394 cm−1 due to the uncoordinated phenolic –OH group was observed in complexes 1 and 2. This may be due to the formation of intramolecular hydrogen bonding between phenolic –OH and either N1 nitrogen atom.22 A sharp band appeared at 1601 and 1609 cm−1 corresponding to the azomethine ν(C![[double bond, length as m-dash]](https://www.rsc.org/images/entities/char_e001.gif) N) group, which has been lowered by 20–12 cm−1 in the complexes, indicating the coordination of the azomethine nitrogen group bound to the ruthenium atom. Furthermore, a strong band that appeared at 818 cm−1 in the spectra of the ligand is indicative of ν(C
N) group, which has been lowered by 20–12 cm−1 in the complexes, indicating the coordination of the azomethine nitrogen group bound to the ruthenium atom. Furthermore, a strong band that appeared at 818 cm−1 in the spectra of the ligand is indicative of ν(C![[double bond, length as m-dash]](https://www.rsc.org/images/entities/char_e001.gif) S). This band completely disappeared in the new complexes and a new band that appeared at 771 and 779 cm−1 in the form of ν(C–S) can be attributed to negative coordination of the ligands and ruthenium metal atom, indicating the tautomerism of the –NH–C
S). This band completely disappeared in the new complexes and a new band that appeared at 771 and 779 cm−1 in the form of ν(C–S) can be attributed to negative coordination of the ligands and ruthenium metal atom, indicating the tautomerism of the –NH–C![[double bond, length as m-dash]](https://www.rsc.org/images/entities/char_e001.gif) S group and subsequent coordination of thiolate sulfur after deprotonation.23a The parallel properties were witnessed in other dithiocarbazate compounds such as S-methyl dithiocarbazates.23b All the complexes display a medium to strong band in the region 1962–1945 cm−1, which is attributed to the terminally coordinated carbonyl group (C
S group and subsequent coordination of thiolate sulfur after deprotonation.23a The parallel properties were witnessed in other dithiocarbazate compounds such as S-methyl dithiocarbazates.23b All the complexes display a medium to strong band in the region 1962–1945 cm−1, which is attributed to the terminally coordinated carbonyl group (C![[triple bond, length as m-dash]](https://www.rsc.org/images/entities/char_e002.gif) O) and is observed at a slightly higher frequency than in the precursor complexes.24
O) and is observed at a slightly higher frequency than in the precursor complexes.24
The UV-Vis spectra of the complexes recorded in chloroform showed intense absorption and in the near ultraviolet region and they displayed four bands in the region around 261–432 nm. The electronic spectra of complexes 1 and 2 showed two bands in the 261 and 265 nm regions which can be assigned to intra-ligand transitions in the complexes. The lowest energy absorption maxima located in the 338–408 nm range may be assigned to an S(pπ) → Ru(dπ) LMCT transition caused by the promotion of the electron from the full HOMO of the ligand, of primarily sulfur pπ character, to the empty LUMO of ruthenium dπ character.25 The bands at 426–431 nm can be designated as forbidden (d → d) transition bands of a spin-paired d6 species with a distorted octahedral structure (Fig. S2A†). As shown in Fig. S2B†, the emission spectra of complexes 1 and 2 recorded in DMSO showed a shoulder peak at 450 nm when excited at 426 nm.
The clearest characterization of the synthesized compounds that can be seen from the 1H and 13C NMR spectra for complexes 1 and 2 is summarized in the Experimental section, and the resulting spectra are depicted in the ESI.† The 1H NMR spectrum of the ligand showed a singlet at 10.81 ppm that is due to the –N2–H–C![[double bond, length as m-dash]](https://www.rsc.org/images/entities/char_e001.gif) S group. In complexes 1 and 2, there was no detectable resonance attributable to –N2H, supporting coordination of enolization and the thiolate sulphur of the ligand under the anionic form upon deprotonation at N(2).26 In addition, a sharp singlet observed at 11.31 ppm corresponding to the phenolic –OH group in the free ligand has appeared at 11.41–11.42 ppm in both complexes indicating the non-participation of phenolic oxygen in coordination (Fig. S3 and S4†).22 In addition, the complexes showed a sharp singlet for the azomethine (–H–C
S group. In complexes 1 and 2, there was no detectable resonance attributable to –N2H, supporting coordination of enolization and the thiolate sulphur of the ligand under the anionic form upon deprotonation at N(2).26 In addition, a sharp singlet observed at 11.31 ppm corresponding to the phenolic –OH group in the free ligand has appeared at 11.41–11.42 ppm in both complexes indicating the non-participation of phenolic oxygen in coordination (Fig. S3 and S4†).22 In addition, the complexes showed a sharp singlet for the azomethine (–H–C![[double bond, length as m-dash]](https://www.rsc.org/images/entities/char_e001.gif) N1) proton at 9.14 and 8.84 for complexes 1 and 2. The methylene protons of the ligand and complexes 1 and 2, appearing at 4.01, 3.90, 3.95 ppm respectively, indicate that the S-benzyl sulfur is not involved in coordination.27 The multiple protons of the aromatic ring moiety of the ligands and metal complexes were observed as multiplets in the range of 6.78–7.78 ppm.
N1) proton at 9.14 and 8.84 for complexes 1 and 2. The methylene protons of the ligand and complexes 1 and 2, appearing at 4.01, 3.90, 3.95 ppm respectively, indicate that the S-benzyl sulfur is not involved in coordination.27 The multiple protons of the aromatic ring moiety of the ligands and metal complexes were observed as multiplets in the range of 6.78–7.78 ppm.
The 13C NMR spectra show the expected signals in the appropriate regions. For the uncoordinated dithiocarbazates, the C![[double bond, length as m-dash]](https://www.rsc.org/images/entities/char_e001.gif) N and C
N and C![[double bond, length as m-dash]](https://www.rsc.org/images/entities/char_e001.gif) S signals of dithiocarbazate residues appear in the regions around 146.56 and 196.44 ppm respectively. Upon the coordination and formation of complexes, a downfield shift is observed for the 13C NMR signals of the C
S signals of dithiocarbazate residues appear in the regions around 146.56 and 196.44 ppm respectively. Upon the coordination and formation of complexes, a downfield shift is observed for the 13C NMR signals of the C![[double bond, length as m-dash]](https://www.rsc.org/images/entities/char_e001.gif) N (around 12 ppm), while C
N (around 12 ppm), while C![[double bond, length as m-dash]](https://www.rsc.org/images/entities/char_e001.gif) S carbon signals appeared in the upfield region at 184.83 and 185.42 for complexes 1 and 2 respectively.28 These are consistent with unprecedented N,S coordination and thio-enolization of the C
S carbon signals appeared in the upfield region at 184.83 and 185.42 for complexes 1 and 2 respectively.28 These are consistent with unprecedented N,S coordination and thio-enolization of the C![[double bond, length as m-dash]](https://www.rsc.org/images/entities/char_e001.gif) S of dithiocarbazate moieties. In both complexes, aromatic carbon atoms of the phenoxy group observed at 151.81 ppm (complex 1) and 150.81 ppm (complex 2) are comparable to the literature values.26 The C
S of dithiocarbazate moieties. In both complexes, aromatic carbon atoms of the phenoxy group observed at 151.81 ppm (complex 1) and 150.81 ppm (complex 2) are comparable to the literature values.26 The C![[triple bond, length as m-dash]](https://www.rsc.org/images/entities/char_e002.gif) O carbon resonating at 204.04 (1) and 203.82 ppm (2) is comparable with earlier observations. In addition the S–CH2 carbon atom in the S-benzyl group showed a signal at 34.76 (1) and 34.79 ppm (2) respectively (Fig. S5†).29
O carbon resonating at 204.04 (1) and 203.82 ppm (2) is comparable with earlier observations. In addition the S–CH2 carbon atom in the S-benzyl group showed a signal at 34.76 (1) and 34.79 ppm (2) respectively (Fig. S5†).29
The coordination of the triphenylphosphine ligand and their configuration in the new complexes has been confirmed by 31P NMR spectra. The appearance of only one sharp singlet at 32.13 ppm in complex 1 suggested the presence of two magnetically equivalent triphenylphosphines trans to each other (Fig. S6†).24 Furthermore, ESI-MS data (in the positive-ion mode) for complexes 1 and 2 have been listed in the Experimental section. The ESI-MS analyses of complexes 1 and 2 show that the most abundant peaks at m/z 1005.4, 1093.5 respectively were assigned to [M − Cl]+ ions revealing that the identity of the complexes was retained in solution. The observed isotopic distributions and their simulation patterns are in agreement with the assigned formulations, as shown in Fig. S7.†
Description of the crystal structure of complexes 1 and 2
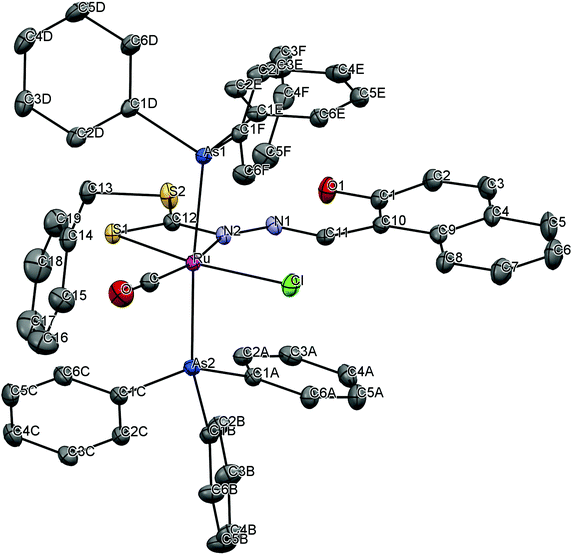
To gain insight into the coordination chemistry and structural parameters of these complexes, 1 and 2 were isolated as good quality single crystals by slow evaporation of a concentrated MeOH/CHCl3 solution and characterized by X-ray diffraction. Details of the data collection, solution, and refinement are gathered in the Experimental section and Table 1. The ORTEP view of the molecular structure along with a partial atom numbering scheme is shown in Fig. 1, 2 and important bond lengths and angles for the ruthenium(II) complexes are summarized in Table 2.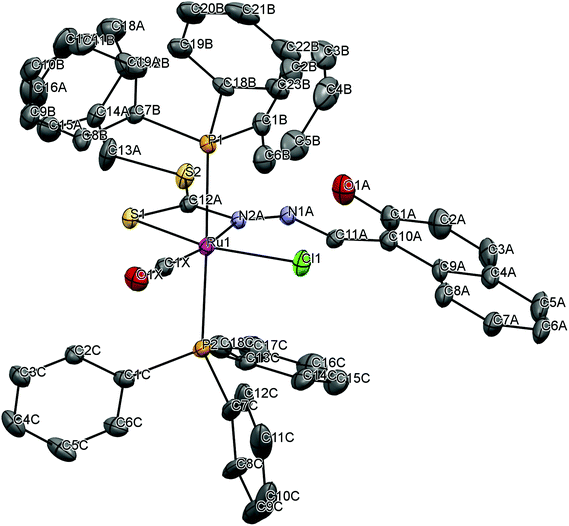 | ||
| Fig. 1 ORTEP plot of the complex [Ru(H-Nap-sbdtc)(CO)Cl(PPh3)2] (1). Thermal ellipsoids are drawn at the 30% probability level. Hydrogen atoms are omitted to aid in clarity. | ||
| 1 | 2·CHCl3 | |
|---|---|---|
| Identification code | Shelxl | Shelxl |
| Chem. formula | C56H44ClN2O2P2RuS2 | C57H46As2Cl4N2O2RuS2 |
| Formula weight | 1039.53 | 1247.79 |
| Temperature (K) | 296(2) | 123(2) |
| Wavelength (Å) | 0.71073 | 0.71073 |
| Crystal system | Triclinic | Monoclinic |
| Space group |
P![[1 with combining macron]](https://www.rsc.org/images/entities/char_0031_0304.gif) |
P2(1)/c |
| Unit cell dimensions | ||
| a (Å) | 14.1173(5) | 13.0014(5) |
| b (Å) | 14.4593(8) | 16.8333(6) |
| c (Å) | 14.6783(8) | 24.6941(9) |
| α (°) | 88.900(2) | 90 |
| β (°) | 71.657(2) | 100.082(4) |
| γ (°) | 85.455(2) | 90 |
| Volume (Å3) | 2835.0(2) | 5321.0(3) |
| Z | 2 | 4 |
| Density (calcd) (Mg M−3) | 1.218 | 1.558 |
| Absorption coefficient | 0.492 | 1.411 mm−1 |
| F(000) | 1066.0 | 2512 |
| Theta range for data collection | 0.970 to 31.60° | 2.986 to 41.152° |
| Index ranges | −17 ≤ h ≤ 20 | −23 ≤ h ≤ 23 |
| −20 ≤ k ≤ 21 | −29 ≤ k ≤ 31 | |
| −19 ≤ l ≤ 21 | −45 ≤ l ≤ 40 | |
| Reflections collected | 35![[thin space (1/6-em)]](https://www.rsc.org/images/entities/char_2009.gif) 422 422 |
67![[thin space (1/6-em)]](https://www.rsc.org/images/entities/char_2009.gif) 233 233 |
| Independent reflections | 19![[thin space (1/6-em)]](https://www.rsc.org/images/entities/char_2009.gif) 045 [R(int) = 0.0472] 045 [R(int) = 0.0472] |
34![[thin space (1/6-em)]](https://www.rsc.org/images/entities/char_2009.gif) 128 [R(int) = 0.0523] 128 [R(int) = 0.0523] |
| Max. and min. transmission | 0.8345 and 0.7661 | 1.00000 and 0.91954 |
| Data/restraints/parameters | 19![[thin space (1/6-em)]](https://www.rsc.org/images/entities/char_2009.gif) 045/0/619 045/0/619 |
34![[thin space (1/6-em)]](https://www.rsc.org/images/entities/char_2009.gif) 128/6/669 128/6/669 |
| Goodness-of-fit on F2 | 1.022 | 1.013 |
| Final R indices [I > 2σ(I)] | R 1 = 0.0642, wR2 = 0.1228 | R 1 = 0.0601, wR2 = 0.0939 |
| R indices (all data) | R 1 = 0.1172, wR2 = 0.1499 | R 1 = 0.1199, wR2 = 0.1124 |
| 1 | 2 | ||||
|---|---|---|---|---|---|
| X-ray data | DFT data | X-ray data | DFT data | ||
| Bond lengths (Å) | |||||
| C1X–Ru1 | 1.836(8) | 1.854 | C–Ru | 1.843(2) | 1.859 |
| N2A–Ru1 | 2.195(6) | 2.233 | N2–Ru | 2.1783(16) | 2.194 |
| S1–Ru1 | 2.390(2) | 2.514 | S1–Ru | 2.3979(5) | 2.515 |
| Cl1–Ru1 | 2.406(2) | 2.531 | Cl–Ru | 2.4301(5) | 2.532 |
| P1–Ru1 | 2.4642(10) | 2.521 | As1–Ru | 2.4576(2) | 2.573 |
| P2–Ru1 | 2.4590(10) | 2.507 | As2–Ru | 2.4617(3) | 2.567 |
| Bond angles (°) | |||||
| C1X–Ru1–N2A | 168.0(3) | 164.822 | C–Ru–N2 | 166.22(7) | 165.713 |
| C1X–Ru1–S1 | 101.9(2) | 98.716 | C–Ru–S1 | 100.04(6) | 99.544 |
| N2A–Ru1–S1 | 66.17(16) | 66.123 | N2–Ru–S1 | 66.19(4) | 66.173 |
| C1X–Ru1–Cl1 | 95.5(3) | 96.459 | C–Ru–Cl | 94.56(6) | 94.946 |
| N2A–Ru1–Cl1 | 96.48(16) | 98.714 | N2–Ru–Cl | 99.21(4) | 99.336 |
| S1–Ru1–Cl1 | 162.42(8) | 164.786 | S1–Ru–Cl | 165.378(18) | 165.507 |
| C1X–Ru1–P2 | 89.9(2) | 91.260 | C–Ru–As1 | 92.83(6) | 90.15 |
| N2A–Ru1–P2 | 89.27(16) | 89.781 | N2–Ru–As1 | 87.36(4) | 90.055 |
| S1–Ru1–P2 | 91.37(6) | 90.919 | S1–Ru–As1 | 88.835(14) | 92.091 |
| Cl1–Ru1–P2 | 91.22(7) | 87.654 | Cl–Ru–As1 | 89.699(14) | 90.152 |
| C1X–Ru1–P1 | 89.0(2) | 89.969 | C–Ru–As2 | 93.76(6) | 90.43 |
| N2A–Ru1–P1 | 91.60(16) | 90.036 | N2–Ru–As2 | 86.59(4) | 90.305 |
| S1–Ru1–P1 | 87.69(6) | 92.687 | S1–Ru–As2 | 91.458(14) | 91.50 |
| Cl1–Ru1–P1 | 90.09(7) | 88.395 | Cl–Ru–As2 | 88.319(14) | 90.469 |
| P2–Ru1–P1 | 178.34(4) | 175.971 | As1–Ru–As2 | 173.255(9) | 176.21 |
| C1B–P1–Ru1 | 118.1(3) | 116.537 | C1E–As1–Ru | 110.05(5) | 116.988 |
| C7B–P1–Ru1 | 116.4(2) | 115.633 | C1F–As1–Ru | 121.45(6) | 114.621 |
| C18B–P1–Ru1 | 113.8(2) | 113.983 | C1D–As1–Ru | 117.10(6) | 117.273 |
| C7C–P2–Ru1 | 118.1(4) | 117.697 | C1C–As2–Ru | 118.06(6) | 117.221 |
| C1C–P2–Ru1 | 116.0(2) | 116.734 | C1A–As2–Ru | 110.31(6) | 115.343 |
| C13C–P2–Ru1 | 113.3(2) | 111.969 | C1B–As2–Ru | 119.48(6) | 116.184 |
| C12A–S1–Ru1 | 82.7(3) | 79.901 | C12–S1–Ru | 81.97(7) | 79.822 |
| O1X–C1X–Ru1 | 178.0(7) | 175.925 | O–C–Ru | 178.48(19) | 176.72 |
| C12A–N2A–Ru1 | 100.3(4) | 101.484 | C12–N2–Ru | 100.90(12) | 101.796 |
| N1A–N2A–Ru1 | 144.5(5) | 141.683 | N1–N2–Ru | 144.08(12) | 141.187 |
The complex 1 crystallized in the triclinic belonging to the P![[1 with combining macron]](https://www.rsc.org/images/entities/char_0031_0304.gif) space group with 2 independent molecules within the unit cell, whereas complex 2 crystallized in the monoclinic system belonging to the space group P21/c with 4 independent molecules within the unit cell (Fig. S1†). The ruthenium(II) ion exhibits a hexa coordination with an octahedral geometry, where the equatorial coordination that comes from NS bidentate chelating ligand [H2-(Nap-sbdtc)], a chloride, a carbonyl carbon and a pair of triphenylphosphines/triphenylarsines completes the axial coordination.30 The NS chelated dithiocarbazate ligand coordinates in a bidentate manner to the ruthenium(II) ion via hydrazinic nitrogen N(2) and a thiolate sulphur atom forming a more strained four membered chelate ring. Formation of the four-membered chelate ring, even after removal of the hydroxy group from the naphthyl ring to prevent intramolecular hydrogen bonding, points to the other possibility that steric interaction of the dithiocarbazate ligands with the PPh3/AsPh3 has forced them to take up such an unprecedented coordination mode.31 Though the PPh3/AsPh3 ligands usually prefer to occupy mutually cis position for a better π-interaction, in these complexes the presence of CO, a stronger π-acidic ligand, might have forced the bulky PPh3/AsPh3 ligands to take trans position for steric reasons.13 The ruthenium(II) ion is therefore sitting in a core RuCClNSP2/As2 coordination environment, which is distorted octahedral in nature as reflected in all the bond parameters around ruthenium.
space group with 2 independent molecules within the unit cell, whereas complex 2 crystallized in the monoclinic system belonging to the space group P21/c with 4 independent molecules within the unit cell (Fig. S1†). The ruthenium(II) ion exhibits a hexa coordination with an octahedral geometry, where the equatorial coordination that comes from NS bidentate chelating ligand [H2-(Nap-sbdtc)], a chloride, a carbonyl carbon and a pair of triphenylphosphines/triphenylarsines completes the axial coordination.30 The NS chelated dithiocarbazate ligand coordinates in a bidentate manner to the ruthenium(II) ion via hydrazinic nitrogen N(2) and a thiolate sulphur atom forming a more strained four membered chelate ring. Formation of the four-membered chelate ring, even after removal of the hydroxy group from the naphthyl ring to prevent intramolecular hydrogen bonding, points to the other possibility that steric interaction of the dithiocarbazate ligands with the PPh3/AsPh3 has forced them to take up such an unprecedented coordination mode.31 Though the PPh3/AsPh3 ligands usually prefer to occupy mutually cis position for a better π-interaction, in these complexes the presence of CO, a stronger π-acidic ligand, might have forced the bulky PPh3/AsPh3 ligands to take trans position for steric reasons.13 The ruthenium(II) ion is therefore sitting in a core RuCClNSP2/As2 coordination environment, which is distorted octahedral in nature as reflected in all the bond parameters around ruthenium.
In complex 1, the ruthenium atom is in a distorted octahedral environment with trans angles of [P(1)–Ru(1)–P(2)] 178.34(4)° and [Cl(1)–Ru(1)–S(1)] 101.9(2)°. The carbonyl group trans to the coordinated N(2)A atom [N(2)A–Ru(1)–C(1)X] with an angle of 168.0(3). The trans angles deviate from linearity and N(2)A, S(1) (four membered ring) leads to a small N(2)A–Ru(1)–S(1) bite angle of 66.17(16)°.32a The ruthenium–ligand distances, namely, Ru(1)–C(1)X 1.836(8) Å, Ru(1)–N(2)A 2.195(6) Å, Ru(1)–S(1)2.390(2) Å, Ru(1)–Cl(1) 2.406(2) Å, Ru(1)–P(2) 2.4590(10) Å, Ru(1)–P(1) 2.4642(10) Å, found in the complexes agree well with that reported for similar other ruthenium complexes containing triphenylphosphine in trans position and the chlorine is trans to the sulfur atom.32b The same prodigy occurred with technetium and rhenium complexes in different oxidation states containing the same type of dithiocarbazates.23b Furthermore, there exists intermolecular hydrogen bonding between the OH group and the N(1) hydrazinic nitrogen atom of the dithiocarbazate ligand that was also found in complex 1 (Table 3).
| Compound | D–H⋯A | d(D–H) | d(H⋯A) | d(D⋯A) | <(DHA) |
|---|---|---|---|---|---|
| a Symmetry operation: complex 1: x, y, z; −x, −y, −z, complex 2: x, y, z; −x, y + 1/2; −z + 1/2; −x, −y, −z; x, −y − 1/2; z − 1/2 [D = donor, A = acceptor]. | |||||
| 1 | O2–H1–N1 | 0.81 | 3.09 | 2.571(2) | 43.9 |
| 2 | O1–H1–S2 | 0.84 | 2.87 | 3.5841(15) | 144.6 |
| O1–H1–N1 | 0.84 | 1.83 | 2.569(2) | 145.8 | |
| C11–H11A–Cl | 0.95 | 2.59 | 3.494(2) | 158.5 | |
| C13–H13A–S1 | 0.99 | 2.56 | 3.232(2) | 125.1 | |
| C2B–H2BA–Cl | 0.95 | 2.93 | 3.550(2) | 124.4 | |
| C1S–H1SA–Cl | 1.00 | 2.83 | 3.662(5) | 141.4 | |
In complex 2, the ruthenium atom is in a distorted octahedral environment with trans angles of [As(1)–Ru(1)–As(2)] 173.255(9)° and [Cl(1)–Ru(1)–S(1)] 165.378(18)°. The carbonyl group trans to the coordinated N(2)A atom [N(2)–Ru(1)–C(1)] with an angle of 166.22(7)°. The trans angles deviate from linearity and N(2), S(1) (four membered ring) leads to a small N(2)–Ru(1)–S(1) bite angle of 66.19(4)°.12,32c The ruthenium–ligand distances, namely, Ru(1)–C(1) 1.843(2) Å, Ru(1)–N(2) 2.1783(16) Å, Ru(1)–S(1) 2.3979(5) Å, Ru(1)–Cl(1) 2.4301(5) Å, Ru(1)–As(2) 2.4576(2) Å, Ru(1)–As(1) 2.4617(3) Å, found in the complexes agree well with that reported for other similar ruthenium complexes containing triphenylarsine in trans position and the chlorine is trans to the sulfur atom. Furthermore, there exists intermolecular hydrogen bonding between the OH group and the N(1) nitrogen atom (O–H⋯N contact) of the dithiocarbazate ligand that was also found in complex 2 (Table 3). The unit cell packing diagram of complexes 1 and 2 along with hydrogen bonding is given in Fig. S1.†
Structure of complexes 1 and 2: density functional theory calculations
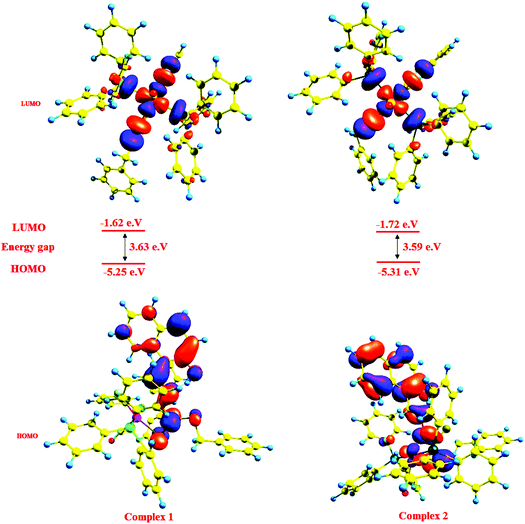
The calculations using the density functional theory (DFT) method of GAUSSIAN-09 were carried out to obtain an insight into the bonding properties of the complexes. The initial geometries were taken from the single-crystal X-ray data of complexes 1 and 2 and subjected to optimization (Fig. S8†). The geometrical parameters viz. bond lengths, bond angles and bond energies were calculated using the GAUSSIAN-09 package. Some theoretically calculated geometric parameters are collected in Table 2 and the general trends observed in the experimental data are reproduced in the calculations. The calculated and experimental values of bond angles are reasonably close. A correlation to some extent between the HOMO–LUMO energy gap of a complex and its chemical reactivity is expected. This is because the chemical reactivity is related to chemical hardness, defined as the resistance to perturbation in the electron distribution in a molecule. Contour plots of molecular orbitals of the complexes were generated using Gauss view 9.0 and the frontier molecular orbitals in 1–4 were calculated (Fig. 3). Positive and negative regions are shown in red and blue colors respectively.It is seen that in complexes 1 and 2, the electron density of the HOMO is localized largely on the naphthyl ring, sulphur atoms in the ligand [H2-(Nap-sbdtc)] and to a lesser extent on the metal ion without relevant contributions, while in the LUMO, major contributions from the metal ion and to a lesser extent from the dithiocarbazate ligand and PPh3/AsPh3 rings.33a So the electron transfer occurs from the highest occupied molecular orbital (HOMO) to the lowest unoccupied molecular orbital (LUMO); it can be inferred that the electron transfer in complexes is related to LMCT. These transitions from HOMO to LUMO explain the first allowed excitation. The calculated HOMO energies of the complexes vary as 1 (−5.25) < 2 (−5.31) and those of LUMO exhibit a similar trend: 1 (−1.62) < 2 (−1.72). The HOMO–LUMO energy gaps in complex 1 (3.63 eV) and 2 (3.59 eV) are almost the same, which is consistent with the experimentally observed order of biological efficiencies of complexes. The calculated atomic charge and electron configurations of donor and ruthenium center atoms are listed in Table 4.
| Complex 1 | Complex 2 | |||
|---|---|---|---|---|
| Atom | Charge | Natural electronic configuration | Charge | Natural electronic configuration |
| Ru | −0.219 | [core]5s(0.37)4d(7.70)5p(0.59)5d(0.02)6p(0.28) | −0.441 | [core]5s(0.39)4d(7.74)5p(0.92)5d(0.02)6p(0.01) |
| P/As | 0.723 | [core]3s(1.15)3p(2.65)4p(0.02) | 0.901 | [core]4s(1.18)4p(2.36)5p(0.02) |
| P/As | 0.727 | [core]3s(1.15)3p(2.65)4p(0.02) | 0.897 | [core]4s(1.18)4p(2.36)5p(0.02) |
| Cl | −0.365 | [core]3s(1.87)3p(5.53) | −0.319 | [core]3s(1.87)3p(5.53) |
| S | 0.123 | [core]3s(1.69)3p(4.22)4p(0.01) | 0.104 | [core]3s(1.69)3p(4.23)4p(0.01) |
| C | 0.044 | [core]2s(1.09)2p(2.13)3s(0.02)3p(0.03) | 0.077 | [core]2s(1.09)2p(2.12)3s(0.02)3p(0.03) |
According to this table, the electron populations on s and p orbitals of oxygen, nitrogen and sulfur donor atoms in both complexes are less than the expected values of valence orbitals, while the computed electron population in the central ion in both complexes is more than the expected value in Ru2+ with d6 electronic configuration. The calculated formal charge on the ruthenium ion (1 = −0.219; 2 = −0.441) in the complexes was lower than the formal charge +2, confirming a significant charge donation from the ligands. This confirms the electron transmission of donor atoms toward the central metal. The calculated electronic configurations (Table 4) of the donor atoms with reference to s and p orbitals are consistent with electron donation towards the ruthenium ion.33b,c
DNA interaction studies
| CF = CT[(I/I0) − P]/[1 − P] |
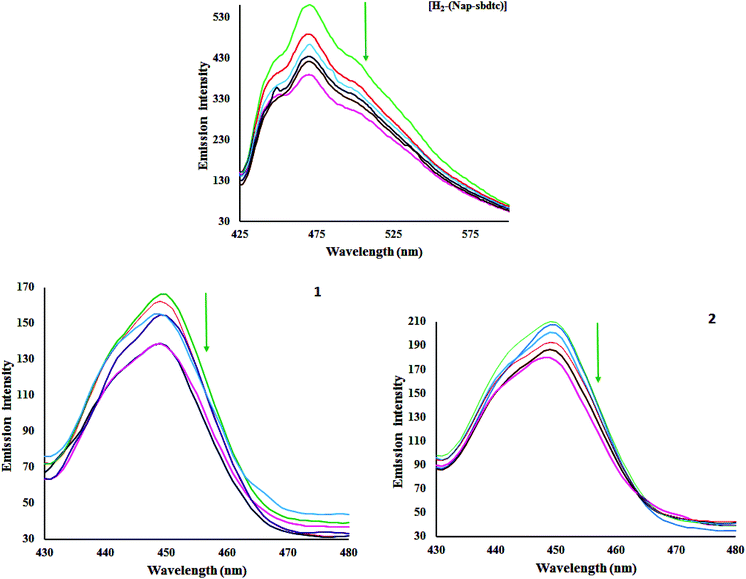 | ||
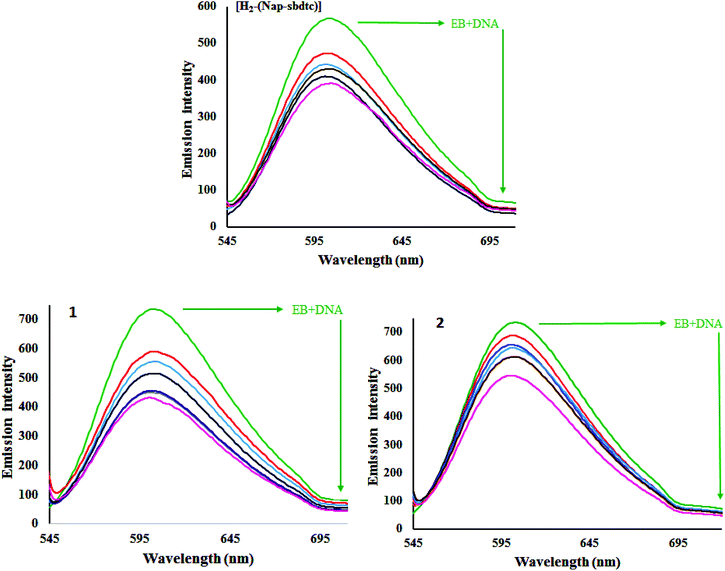
| Fig. 4 Emissive titration of the compounds [H2-(Nap-sbdtc)], 1 and 2 (50 μM) with CT-DNA (0–50 μM). Arrows indicate increasing amounts of DNA concentration. | ||
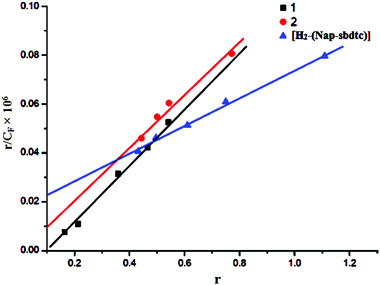 | ||
| Fig. 5 Scatchard plots of r/Cfvs. r for compounds [H2-(Nap-sbdtc)], 1 and 2 with increasing concentration of CT-DNA. | ||
A plot of r/CFversus r (= CB/[DNA]) gives the intrinsic binding constant (Kb) values. It has been found that the intrinsic binding constant (Kb) values for the interaction of H2-(Nap-sbdtc), 1 and 2 with CT-DNA are listed in Table 5. The results derived from the emissive titration experiments suggest that all the compounds (H2-(Nap-sbdtc), 1 and 2) can bind to DNA. However the complexes interact with CT-DNA more strongly than the corresponding ligand.36 The Kb values suggested that the DNA-binding affinities of the compounds follow the order 1 > 2 > H2-(Nap-sbdtc). For the intercalative ligand with an extended aromatic plane and good conjugation, effects from the substituted group can greatly enhance the DNA-binding ability of the ruthenium(II) complexes.
| Compound | K b (M−1) | K q (M−1) | K app (M−1) |
|---|---|---|---|
| [H 2 -(Nap-sbdtc)] | 5.69 × 10⁴ | 5.36 × 10³ | 4.02 × 10⁵ |
| 1 | 1.21 × 10⁵ | 7.89 × 10³ | 5.90 × 10⁵ |
| 2 | 9.38 × 10⁴ | 5.90 × 10³ | 4.42 × 10⁵ |
Ethidium bromide displacement study
To gain deep insight into interaction of the ligand and its ruthenium(II) complexes to bind CT-DNA was studied by evaluating the fluorescence emission intensity of the ethidium bromide (EB)–DNA system upon the addition of different amounts of the selected compounds. EB is a DNA intercalating agent that fluoresces when bound to the polynucleotide molecule (actually the fluorescence intensity of EB increases by almost 20-fold after binding to DNA).37 The fluorescence of EB increases after intercalating into DNA. If the metal complexes intercalate into DNA, it leads to a decrease in the binding sites of DNA available for EB, resulting in a decrease in the fluorescence intensity of the EB–DNA system.38a The fluorescence intensity of EB–DNA decreases rapidly with increasing concentrations of the compounds. This illustrates that, as the concentration of the ligand and complexes 1 and 2 increases, the emission band at 604 nm for EB exhibited hypochromism up to 45.51, 71.43 and 78.64% with a slight red/blue shift from the initial fluorescence intensity respectively. Results depicted in Fig. 6 underlined that the ligand and their ruthenium(II) complex efficiently quenched the fluorescence emission of EB. Notably, the fluorescence quenching constant was evaluated using the Stern–Volmer equation:38b| F0/F = 1 + Kq[Q] |
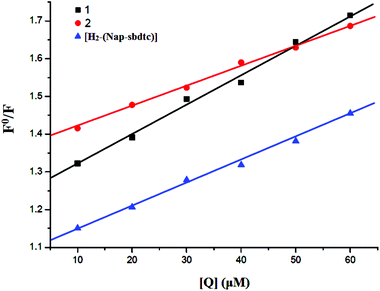 | ||
| Fig. 7 Stern–Volmer plots of fluorescence titration of compounds [H2-(Nap-sbdtc)], 1 and 2 with CT-DNA. | ||
The selected test compounds can quench the EB emission by either competing with EB for binding sites or by accepting the excited state photon. It is unlikely that the ligand and their ruthenium complexes can compete with EB for intercalative binding sites. Further the apparent DNA binding constant (Kapp) values were also calculated using the following equation:38c
| KEB[EB] = Kapp[M50%] |
Viscosity measurement
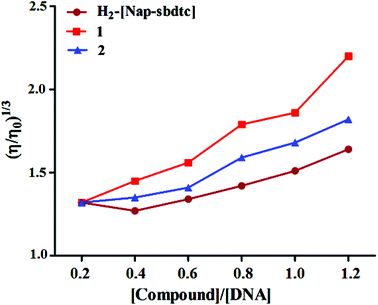
To clarify the nature of the interaction between the compounds and CT-DNA, viscosity measurements were performed. These measurements provide sensitive detection of the binding mode of the present compounds. Hydrodynamic measurements that are sensitive to changes in length (i.e., viscosity and sedimentation) are regarded as the least ambiguous and the most critical tests of a binding model in solution in the absence of crystallographic or NMR structural data.40,41 In general, the viscosity of CT-DNA increases when a compound binds DNA in an intercalating mode but remains unchanged when a compound binds DNA in an electrostatic mode. If the groove binding mode occurs, there is only a little effect on the viscosity of DNA. The length of the DNA helix increases upon intercalation as base pairs are separated to accommodate the binding ligand, which results in the increased viscosity of the DNA. The viscosity measurements and the effect of compounds on the relative viscosities of CT-DNA are shown in Fig. 8.When the ligands and their ruthenium(II) complexes 1, 2 were treated with CT-DNA (200 μM) and the concentrations of ruthenium complexes (0–120 μM) are increased from a ratio of R = 0–1.2 (1/R = [Ru]/[DNA]), the relative viscosity of DNA increases steadily in the order 1 > 2 > H2-(Nap-sbdtc). The selected compounds which contain planar ligands can deeply intercalate into DNA base pairs and increase DNA viscosity similarly to some known intercalators indicative of a classical intercalation.42 These results are consistent with our above mentioned hypothesis.
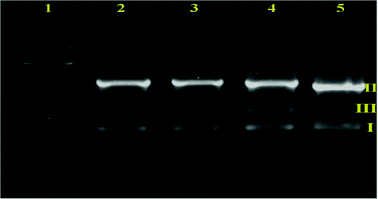
Nuclease activity
The nuclease activity of ruthenium(II) complexes was investigated by the electrophoretic mobility shift assay using supercoiled plasmid DNA. This method is commonly used to study the DNA cleavage activity of metal complexes. This can be achieved by monitoring the transition from the naturally occurring, covalently closed circular form (form I) to the open circular relaxed form (form II). This occurs when one of the strands of the plasmid is nicked, and can be determined by gel electrophoresis of the plasmid.24,43 Extended irradiation results in a buildup of nicks on both strands of the plasmid, which eventually results in its opening to the linear form (form III). Hence, uncut plasmids (form I) will appear to migrate more rapidly than the same plasmid when linearized (form III). Moreover, the nicked circles (form II), which are the bulkiest, will be the slowest migrating species in the gel (since the separation is not only by charge but also by size).44a As mentioned in the Introduction, the ability of the ruthenium(II)–Schiff base complexes to cleave DNA was assayed with the aid of gel electrophoresis on pBR322 DNA as the substrate in the medium of 5 mM tris-(hydroxymethyl)aminomethane (Tris)-HCl/50 mM NaCl buffer (pH 7.2) in the absence of external additives. The DNA was mixed with fixed concentrations (25 μM) of the ligand and their ruthenium(II) complexes and was incubated at 37 °C for 4 h (Fig. 9).Moreover, control experiments performed using DNA alone (lane 2) and the ligand (lane 3) in separate lanes did not reveal any apparent cleavage of DNA. From lanes 4 and 5, the fixed concentration of the complexes (25 μM) converts SC DNA (form I) into NC DNA (form II).44b In addition the linear form (form III) was obtained from the cleavage of SC DNA (form I). The complexes did not require any addition of external agents to affect DNA cleavage activity. As depicted in Fig. 9, complexes 1 and 2 exhibited more effective DNA cleavage activity than the ligand under identical experimental conditions.
Protein interaction studies (BSA)
![[thin space (1/6-em)]](https://www.rsc.org/images/entities/char_2009.gif) :
:![[thin space (1/6-em)]](https://www.rsc.org/images/entities/char_2009.gif) 9
9![[thin space (1/6-em)]](https://www.rsc.org/images/entities/char_2009.gif) :
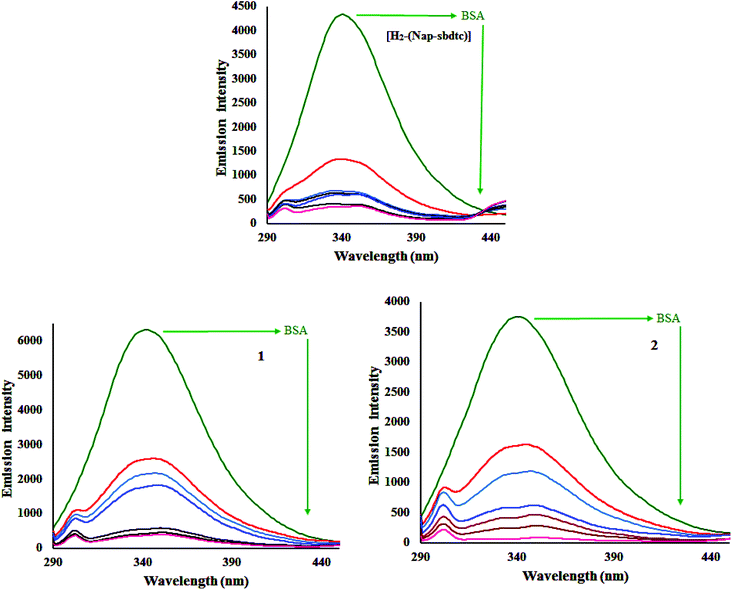
:![[thin space (1/6-em)]](https://www.rsc.org/images/entities/char_2009.gif) 0.5, and thus the intrinsic fluorescence intensity of BSA when excited at 295 nm mainly comes from the tryptophan residues such as Trp-134 and Trp-212 more exposed to the environment.46 Therefore, the fluorescence behavior of BSA can provide significant information about the structure, dynamics, and protein folding. A solution of BSA (5 mM) was titrated with various concentrations of the compounds H2-(Nap-sbdtc), 1 and 2 (0–50 mM) in the range of 230–530 nm (λexc 280 nm). Fig. 10 shows that the effect of increasing concentration of compounds on the fluorescence emission of BSA.
0.5, and thus the intrinsic fluorescence intensity of BSA when excited at 295 nm mainly comes from the tryptophan residues such as Trp-134 and Trp-212 more exposed to the environment.46 Therefore, the fluorescence behavior of BSA can provide significant information about the structure, dynamics, and protein folding. A solution of BSA (5 mM) was titrated with various concentrations of the compounds H2-(Nap-sbdtc), 1 and 2 (0–50 mM) in the range of 230–530 nm (λexc 280 nm). Fig. 10 shows that the effect of increasing concentration of compounds on the fluorescence emission of BSA.
An examination of the spectra showed a noteworthy decrease in fluorescence intensity at ∼343 nm between the test compounds and BSA protein. The observed red shift is mainly due to the fact that the active site in protein is buried in a hydrophobic environment. It suggested that some interaction is taking place between the complexes and the BSA protein. To obtain a deep insight into the quenching progression, the quenching constant (Kq) was evaluated following the Stern–Volmer and Scatchard equations:47
log[I0 − I/I] = log![[thin space (1/6-em)]](https://www.rsc.org/images/entities/char_2009.gif) Kbin + n Kbin + n![[thin space (1/6-em)]](https://www.rsc.org/images/entities/char_2009.gif) log[Q] log[Q] |
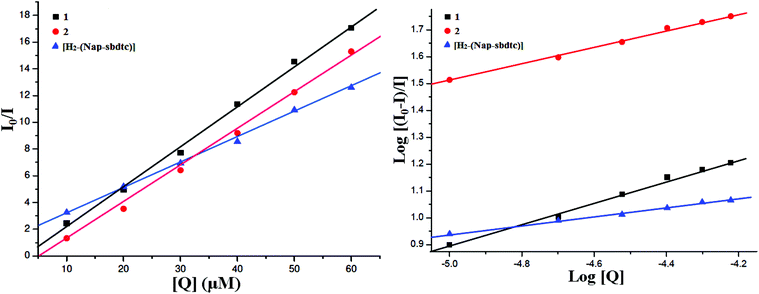 | ||
| Fig. 11 Stern–Volmer plots and Scatchard plots of the fluorescence titration of the compounds [H2-(Nap-sbdtc)], 1 and 2 with BSA. | ||
The calculated Kq, Kbin, and n values are given in Table 6. The value of n indicates the existence of a single binding site in BSA for the complexes or ligand.13 The larger values of Kq and Kbin indicate a strong interaction between the BSA protein and the complexes over the ligand used in this study. The DNA binding ability of the compounds follows the order 2 > 1 > H2-(Nap-sbdtc), which is consistent with the results obtained from the above binding affinity studies.
| Compound | K q (M−1) | K bin (M−1) | n value |
|---|---|---|---|
| [H 2 -(Nap-sbdtc)] | 1.84 × 10⁵ | 2.95 × 10⁵ | 0.94 |
| 1 | 3.03 × 10⁵ | 4.43 × 10⁵ | 1.12 |
| 2 | 3.62 × 10⁵ | 1.53 × 10⁶ | 1.66 |
UV-Vis spectral study
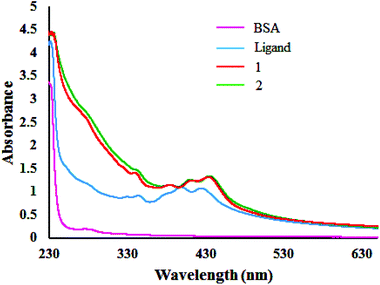
The fluorescence quenching mechanisms are usually classified as either static or dynamic quenching. Static quenching usually results from the formation of a complex between the quencher and the fluorophore in the ground state, whereas in dynamic quenching the fluorophore and the quencher get in touch with each other during the transient existence of the excited state.48a One can get an idea of the type of quenching from UV-Vis absorption spectral studies. UV-Vis spectra of BSA in the presence of compounds displayed (Fig. 12) an increase in absorption intensity of the BSA, suggesting static interaction due to the formation of the ground state complex as reported earlier.48bProtein cleavage study
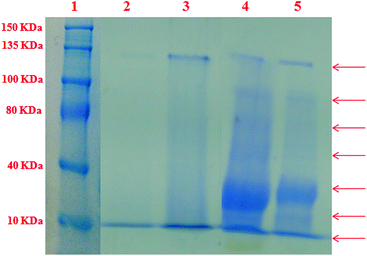
In order to access the ability of the ligand and their complexes 1 and 2 to serve as synthetic metalloproteases, the BSA photocleavage activity of the compounds was studied using 4 mM BSA in 50 mM Tris-HCl buffer staining with CBR-250 at room temperature. The extent of protein photocleavage for a fixed concentration of the compounds (50 μM) was compared with the untreated BSA band.49 As depicted in Fig. 13, in the SDS-PAGE gel diagrams it was observed that BSA alone and the ligand (lanes 2 and 3) did not show any apparent cleavage under the same experimental conditions whereas complexes 1 and 2 (lanes 4 and 5) with BSA display more electrophoretic bands corresponding to protein fragments of 20 kDa, 60 kDa, 100 kDa and 120 kDa. Complexes 1 and 2 showed significant smearing or fading of the BSA band indicating photocleavage of BSA.50 Among them, the fading of the band suggested non-specific binding of the complexes to BSA, leading to cleavage into very small fragments, which is supported by BSA binding studies as reported earlier.Anticancer activity in vitro
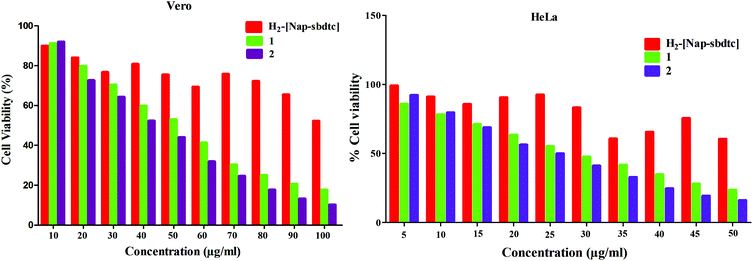 | ||
| Fig. 14 Cytotoxicity of the compounds [H2-(Nap-sbdtc)], 1 and 2 after 24 h of incubation on Vero and HeLa cell lines. | ||
The amount of cell proliferation significantly decreased in a dose-dependent manner on supplementation with compounds, as observed within 24 h of incubation against HeLa/Vero cells under identical experimental conditions. The ligand is not significantly active against (HeLa/Vero) cells, in contrast to the complexes (Table 7). The ruthenium complexes exhibited higher cytotoxicity in vitro against the selected cell lines than cisplatin, which is a widely used clinical antitumor drug in the low micromolar concentration.51b This is due to the fact that ruthenium complexes have a capacity to reduce the energy status in tumors as well as to enhance tumor hypoxia, which also influences their antitumor activities. It is known that naphthalene ring compartment ligand-containing ruthenium complexes have a wide range of biological activities such as antitumor, apoptosis and interaction with DNA inhibiting replication, transcription and other nuclear functions and arresting cancer cell proliferation so as to arrest tumor growth.52 The results indicate that these complexes have beneficial features for potential anticancer agents.
Morphological changes in AO/EB and DAPI fluorescence study
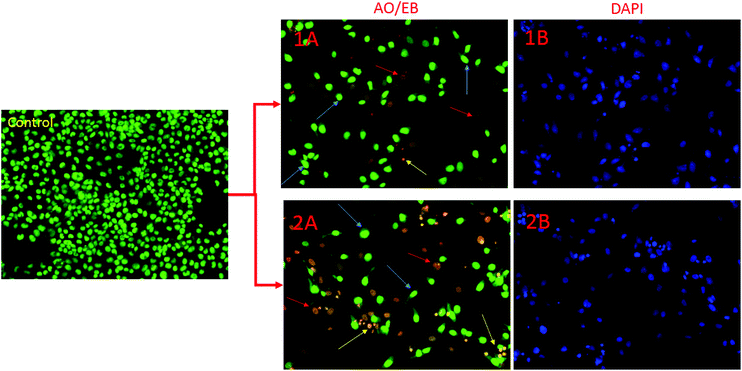
Apoptotic pathways are important targets that should be considered in the design of potential anticancer agents. It is especially advantageous if the new compound triggers the death of cancer cells by apoptosis. Apoptosis induction is an anti-proliferative mechanism by which the cancer cells undergo programmed death. Cells undergoing apoptosis are characterized by several morphological and biochemical changes including cell shrinkage, chromatin condensation and DNA fragmentation.53 Apoptotic cells exhibit increased plasma membrane permeability to certain fluorescent dyes, e.g., AO/EB, Hoechst, AO/PI, DAPI etc. In this study, we used AO/EB and DAPI staining assays. The cytological changes observed in the treated cells are classified into four types on the basis of the fluorescence emission and morphological features of chromatin condensation in the AO/EB stained nuclei: (i) viable cells, which have highly organized nuclei, fluoresce green; (ii) early apoptotic cells, which show nuclear condensation, emit orange-green fluorescence; (iii) in late apoptotic cells with highly condensed or fragmented chromatin the nuclei fluoresce orange to red; and (iv) necrotic cells fluoresce orange to red with no indication of chromatin fragmentation.54 All these morphological changes were observed after treatment of the cancer cells with the complexes. To investigate the morphological changes, AO/EB and DAPI fluorescence staining was performed, and the resulting images of the control and treated HeLa cells are depicted in Fig. 15.In this figure, yellow arrows show early apoptotic HeLa cells with membrane blebbing which is seen at fixed concentration of complexes 1, 2 and blue arrows exhibit late apoptotic cells with chromatin aggregation, that is, highly condensed chromatin. Necrotic cells having uniform orange to red nuclei with condensed structure were observed.12 Overall results indicate that complexes 1 and 2 induced cell death by necrosis in good agreement with the above toxicity results.
Conclusion
Two new organo-ruthenium(II) complexes of 2-hydroxy-1-naphthaldehyde-S-benzyldithiocarbazate have been synthesized and characterized by various spectral techniques. The characterization of the ruthenium(II) complexes was accomplished by analytical and spectral (IR, UV-vis, NMR, and ESI-MS) methods. The solid state structure of the two complexes was confirmed by single-crystal X-ray crystallography. Interestingly, the S-benzyldithiocarbazate coordinated in an NS fashion through the hydrazinic nitrogen and thiolate sulfur by forming a four-membered chelate ring. The XRD study also reveals the presence of a distorted octahedral geometry around the ruthenium(II) ion. The structural parameters of the complexes that are in good agreement with X-ray analysis were obtained by DFT calculations. Complex 2 has the lowest energy gap between the HOMO and LUMO. Various physico-chemical techniques demonstrated that these complexes effectively bind with DNA through intercalative interactions. The gel electrophoresis assay demonstrated that the complexes have been found to promote the cleavage ability of the pBR322 plasmid DNA. In addition, the binding ability to BSA proteins has also been explored to be a static one, which is the requisite for a drug to act as an anticancer agent. Moreover, they all exhibit significant cytotoxic activity towards normal Vero cell line and HeLa cancer cell line and the characteristics of apoptosis in cell morphology have been observed using AO/EB and DAPI staining.Acknowledgements
The authors Dr P.V. and P.V. gratefully acknowledge UGC [F. No. 40-66/2011 (SR)] for financial support. The author (R.N.) is thankful to DST for financial assistance (project no. SR/FT/CS-95/2010). The authors would like to thank the Director, CAS in Botany, School of Life Sciences, University of Madras for providing laboratory facilities to perform the cell line studies.References
- (a) N. P. E. Barry and P. J. Sadler, Chem. Commun., 2013, 49, 5106–5131 RSC; (b) B. W. Harper, A. M. Krause-Heuer, M. P. Grant, M. Manohar, K. B. Garbutcheon-Singh and J. R. Aldrich-Wright, Chem. – Eur. J., 2010, 16, 7064–7077 CrossRef CAS PubMed; (c) N. J. Wheate, S. Walker, G. E. Craig and R. Oun, Dalton Trans., 2010, 39, 8113–8127 RSC.
- L. Breydo and V. N. Uversky, Metallomics, 2011, 3, 1163–1180 RSC.
- N. P. E. Barry and P. J. Sadler, Chem. Commun., 2013, 49, 5106–5131 RSC.
- P. C. A. Bruijnincx and P. J. Sadler, Curr. Opin. Chem. Biol., 2008, 12, 197–206 CrossRef CAS PubMed.
- (a) G. Suess-Fink, Dalton Trans., 2010, 39, 1673–1688 RSC; (b) A. C. G. Hotze, B. M. Kariuki and M. J. Hannon, Angew. Chem., Int. Ed., 2006, 118, 4957–4960 CrossRef PubMed.
- (a) W. H. Ang and P. J. Dyson, Eur. J. Inorg. Chem., 2006, 20, 4003–4018 CrossRef PubMed; (b) P. Schluga, C. G. Hartinger, A. Egger, E. Reisner, M. Galanski, M. A. Jakupec and B. K. Keppler, Dalton Trans., 2006, 1796–1802 RSC; (c) D. Wang and S. J. Lippard, Nat. Rev. Drug Discovery, 2005, 4, 307–320 CrossRef CAS PubMed; (d) P. J. Dyson, Chimia, 2007, 61, 698–703 CrossRef CAS; (e) E. R. Jamieson and S. J. Lippard, Chem. Rev., 1999, 99, 2467–2498 CrossRef CAS PubMed.
- A. R. Timerbaev, C. G. Hartinger, S. S. Aleksenko and B. K. Keppler, Chem. Rev., 2006, 106, 2224–2248 CrossRef CAS PubMed.
- M. R. Maurya, A. Kumar, A. R. Bhat, A. Azam, C. Bader and D. Rehder, Inorg. Chem., 2006, 45, 1260–1269 CrossRef CAS PubMed.
- M. Akbar Ali, A. H. Mirza, R. J. Fereday, R. J. Butcher, J. M. Fuller, S. C. Drew, L. Gahan, G. R. Hanson, B. Moubaraki and K. S. Murray, Inorg. Chim. Acta, 2005, 358, 3937–3948 CrossRef PubMed.
- N. Bharti, R. Maurya, F. Naqvi, A. Bhattacharya, S. Bhattacharya and A. Amir, Eur. J. Med. Chem., 2000, 35, 481–486 CrossRef.
- R. Takjoo, M. Yazdanbakhsh, A. A. Kaju and Y. Chen, Chin. J. Chem., 2010, 28, 221–228 CrossRef CAS PubMed.
- P. Vijayan, P. Viswanathamurthi, V. Silambarasan, D. Velmurugan, K. Velmurugan, R. Nandhakumar, R. J. Butcher, T. Silambarasan and R. Dhandapani, J. Organomet. Chem., 2014, 768, 163–177 CrossRef CAS PubMed.
- (a) G. Sethuraman, B. M. Yamin, M. Shamsuddin, A. Usman, I. Abdul Razak and H. K. Fun, Acta Crystallogr., Sect. E: Struct. Rep. Online, 2002, 58, o649–o651 CAS; (b) N. Ahmed, J. J. Levision, S. D. Robinson and M. F. Uttley, Inorg. Synth., 1974, 15, 45–64 Search PubMed.
- SMART & SAINT Software Reference manuals, version 5.0, Bruker AXS Inc., Madison, WI, 1998 Search PubMed.
- G. M. Sheldrick, SHELXL97, Program for Crystal Structure Refinement, University of Gottingen, Germany, 1997 Search PubMed.
- M. J. Frisch, G. W. Trucks, H. B. Schlegel, G. E. Scuseria, M. A. Robb, J. R. Cheeseman, G. Scalmani, V. Barone, B. Mennucci, G. A. Petersson, H. Nakatsuji, M. Caricato, X. Li, H. P. Hratchian, A. F. Izmaylov, J. Bloino, G. Zheng, J. L. Sonnenberg, M. Hada, M. Ehara, K. Toyota, R. Fukuda, J. Hasegawa, M. Ishida, T. Nakajima, Y. Honda, O. Kitao, H. Nakai, T. Vreven, J. A. Montgomery, J. E. Peralta, F. Ogliaro, M. Bearpark, J. J. Heyd, E. Brothers, K. N. Kudin, V. N. Staroverov, T. Keith, R. Kobayashi, J. Normand, K. Raghavachari, A. Rendell, J. C. Burant, S. S. Iyengar, J. Tomasi, M. Cossi, N. Rega, J. M. Millam, M. Klene, J. E. Knox, J. B. Cross, V. Bakken, C. Adamo, J. Jaramillo, R. Gomperts, R. E. Stratmann, O. Yazyev, A. J. Austin, R. Cammi, C. Pomelli, J. W. Ochterski, R. L. Martin, K. Morokuma, V. G. Zakrzewski, G. A. Voth, P. Salvador, J. J. Dannenberg, S. Dapprich, A. D. Daniels, O. Farkas, J. B. Foresman, J. V. Ortiz, J. Cioslowski and D. J. Fox, Gaussian 09, Inc., Wallingford, CT, 2010 Search PubMed.
- E. Reed, L. A. Curtiss and F. Weinhold, Chem. Rev., 1988, 88, 899–926 CrossRef.
- A. C. G. Hotze, E. P. L. van der Geer, S. E. Caspers, H. Kooijman, A. L. Spek, J. G. Haasnoot and J. Reedijk, Inorg. Chem., 2004, 43, 4935–4943 CrossRef CAS PubMed.
- (a) R. Loganathan, S. Ramakrishnan, E. Suresh, A. Riyasdeen, M. A. Akbarsha and M. Palaniandavar, Inorg. Chem., 2012, 51, 5512–5532 CrossRef CAS PubMed; (b) U. K. Laemmli, Nature, 1970, 227, 680–685 CrossRef CAS PubMed.
- T. Mosmann, J. Immunol. Methods, 1983, 65, 55–63 CrossRef CAS.
- M. Ali, A. Mirza, R. Butcher, M. Tarafder, B. Tan and A. Ali, J. Inorg. Biochem., 2002, 92, 141–148 CrossRef.
- P. Kalaivani, R. Prabhakaran, P. Poornima, F. Dallemer, K. Vijayalakshmi, V. Vijayapadma and K. Natarajan, Organometallics, 2012, 31, 8323–8332 CrossRef CAS.
- (a) R. Ramachandran, G. Prakash, S. Selvamurugan, P. Viswanathamurthi, J. G. Malecki and V. Ramkumar, Dalton Trans., 2014, 43, 7889–7902 RSC; (b) A. Marchi, R. Rossi, L. Magon, A. Duatti, R. Pasqualini, V. Ferretti and V. Bertolasi, J. Chem. Soc., Dalton Trans., 1990, 1411–1416 RSC.
- P. Kalaivani, R. Prabhakaran, E. Vaishnavi, B. T. Rueffer, H. Lang, P. Poornima, R. Renganathan, V. VijayaPadmad and K. Natarajan, Inorg. Chem. Front., 2014, 1, 311–324 RSC.
- (a) M. I. Bruce, J. Howard, I. W. Nowell, G. Shaw and P. Woodward, J. Chem. Soc., Chem. Commun., 1972, 1041–1042 RSC; (b) D. Pandiarajan and R. Ramesh, J. Organomet. Chem., 2013, 723, 26–35 CrossRef CAS PubMed.
- D. Senthil Raja, G. Paramaguru, N. S. P. Bhuvanesh, J. H. Reibenspies, R. Renganathan and K. Natarajan, Dalton Trans., 2011, 4548–4559 RSC.
- P. Kalaivani, R. Prabhakaran, F. Dallemer, P. Poornima, E. Vaishnavi, E. Ramachandran, V. Vijaya Padma, R. Renganathan and K. Natarajan, Metallomics, 2012, 4, 101–113 RSC.
- N. Chitrapriya, T. S. Kamatchi, M. Zeller, H. Lee and K. Natarajan, Spectrochim. Acta, Part A, 2011, 81, 128–134 CrossRef CAS PubMed.
- T. SathiyaKamatchi, N. Chitrapriya, H. Lee, C. F. Fronczek, F. R. Fronczek and K. Natarajan, Dalton Trans., 2012, 41, 2066–2077 RSC.
- J. G. Malecki, A. Maron, M. Serda and J. Polanski, Polyhedron, 2013, 56, 44–54 CrossRef CAS PubMed.
- R. Prabhakaran, P. Kalaivani, S. V. Renukadevi, R. Huang, K. Senthilkumar, R. Karvembu and K. Natarajan, Inorg. Chem., 2012, 51, 3525–3532 CrossRef CAS PubMed.
- (a) F. Basuli, S. M. Peng and S. Bhattacharya, Inorg. Chem., 2000, 39, 1120–1127 CrossRef CAS; (b) F. Basuli, S.-M. Peng and S. Bhattacharya, Inorg. Chem., 2001, 40, 1126–1133 CrossRef CAS PubMed; (c) R. Prabhakaran, P. Kalaivani, R. Huang, M. Sieger, W. Kaim, P. Viswanathamurthi, F. Dallemer and K. Natarajan, Inorg. Chim. Acta, 2011, 376, 317–324 CrossRef CAS PubMed.
- (a) M. Ganeshpandian, R. Loganathan, E. Suresh, A. Riyasdeen, M. A. Akbarsha and M. Palaniandavar, Dalton Trans., 2014, 43, 1203–1219 RSC; (b) P. Paul, R. J. Butcher and S. Bhattacharya, Inorg. Chim. Acta, 2015, 425, 67–75 CrossRef CAS PubMed; (c) S. K. Sarkar, M. S. Jana, T. K. Mondal and C. Sinha, Appl. Organomet. Chem., 2014, 28, 641–651 CrossRef CAS PubMed.
- C. Shobha Devi, D. Anil Kumar, S. S. Singh, N. Gabra, N. Deepika, Y. Praveen Kumar and S. Satyanarayana, Eur. J. Med. Chem., 2013, 64, 410–421 CrossRef CAS PubMed.
- Q. Yu, Y. Liu, J. Zhang, F. Yang, D. Sun, D. Liu, Y. Zhou and J. Liu, Metallomics, 2013, 5, 222–231 RSC.
- M. Asadi, E. Safaei, B. Ranjbar and L. Hasani, New J. Chem., 2004, 28, 1227–1234 RSC.
- J. B. Lepecq and C. J. Paoletti, J. Mol. Biol., 1967, 27, 87–106 CrossRef CAS.
- (a) B. C. Baguley and M. LeBret, Biochemistry, 1984, 23, 937–943 CrossRef CAS; (b) T. B. Wyman, F. Nicol, O. Zelphati, P. V. Scaria, C. Plank and F. C. Szoka, Biochemistry, 1997, 36, 3008–3017 CrossRef CAS PubMed; (c) J. R. Lakowicz and G. Webber, Biochemistry, 1973, 12, 4161–4170 CrossRef CAS.
- J. M. Ruso, D. Attwood, M. Garcßa, P. Taboada, L. M. Varela and V. Mosquera, Langmuir, 2001, 17, 5189–5195 CrossRef CAS.
- E. J. Gabbay, R. E. Scofield and C. S. Baxter, J. Am. Chem. Soc., 1973, 95, 7850–7857 CrossRef CAS.
- P. R. Reddy, A. Shilpa, N. Raju and P. Raghavaiah, J. Inorg. Biochem., 2011, 105, 1603–1612 CrossRef CAS PubMed.
- D. Lahiri, S. Roy, S. Saha, R. Majumdar, R. R. Dighe and A. R. Chakravarty, Dalton Trans., 2010, 39, 1807–1816 RSC.
- K. Ghosh, P. Kumar, V. Mohan, U. P. Singh, S. Kasiri and S. S. Mandal, Inorg. Chem., 2012, 51, 3343–3345 CrossRef CAS PubMed.
- (a) G. Süss-Fink, Dalton Trans., 2010, 39, 1673–1688 RSC; (b) P. U. Maheswari, S. Roy, H. den Dulk, S. Barends, G. van Wezel, B. Kozlevcar, P. Gamez and J. Reedijk, J. Am. Chem. Soc., 2006, 128, 710–711 CrossRef CAS PubMed.
- Y. Zhang, Z. D. Qi, D. Zheng, C. H. Li and Y. Liu, Biol. Trace Elem. Res., 2009, 130, 172–184 CrossRef CAS PubMed.
- C. V. Dang, R. F. Ebert and W. R. Bell, J. Biol. Chem., 1985, 260, 9713–9719 CAS.
- J. R. Lakowicz, Principles of Fluorescence Spectroscopy, Kluwer Academic/Plenum Press, New York, 1999 Search PubMed.
- (a) S. M. T. Shaikh, J. Seetharamappa, S. Ashoka and P. B. Kandagal, Dyes Pigm., 2007, 73, 211–216 CrossRef CAS PubMed; (b) D. Senthil Raja, N. S. P. Bhuvanesh and K. Natarajan, Eur. J. Med. Chem., 2011, 46, 4584–4594 CrossRef PubMed.
- V. Rajendiran, R. Karthik, M. Palaniandavar, H. S. Evans, V. S. Periasamay, M. A. Akbarsha, B. S. Srinag and H. Krishnamurthy, Inorg. Chem., 2007, 46, 8208–8221 CrossRef CAS PubMed.
- N. H. Khan, N. Pandya, N. C. Maity, M. Kumar, M. Rajesh, P. R. I. Kureshy, S. H. R. Abdi, S. Mishr, S. Das and H. C. Bajaj, Eur. J. Med. Chem., 2011, 46, 5074–5085 CrossRef CAS PubMed.
- (a) P. Krishnamorthy, P. Sathyadevi, A. H. Cowlwy, R. R. Butorac and N. Dharamaraj, Eur. J. Med. Chem., 2011, 46, 3376–3387 CrossRef PubMed; (b) T. S. Kamatchi, N. Chitrapriya, H. Lee, C. F. Fronczek, F. R. Fronczek and K. Natarajan, Dalton Trans., 2012, 41, 2066–2077 RSC.
- S. Tardito, C. Isella, E. Medico, L. Marchiò, E. Bevilacqua, M. Hatzoglou, O. Bussolati and R. Franchi-Gazzola, J. Biol. Chem., 2009, 284, 24306–24319 CrossRef CAS PubMed.
- D. Baskic, S. Popovic, P. Ristic and N. N. Arsenijevic, Cell Biol. Int. Rep., 2006, 30, 924–932 CrossRef CAS PubMed.
- H. L. Chan, D. L. Ma, M. Yang and C. M. Che, ChemBioChem, 2003, 4, 62–68 CrossRef CAS PubMed.
Footnote |
| † Electronic supplementary information (ESI) available: Packing diagram for complexes 1 and 2 (Fig. S1), UV-vis and emission spectra of compounds (Fig. S2), representative NMR (1H, 13C and 31P) spectra of complexes (Fig. S3–S6), ESI-MS spectrum of complexes (Fig. S7) and optimized structure of complexes (Fig. S8). CCDC 986059 and 985979 for complexes 1, 2. For ESI and crystallographic data in CIF or other electronic format see DOI: 10.1039/c5qi00029g |
| This journal is © the Partner Organisations 2015 |


