Lanthanide phosphonates with pseudo-D5h local symmetry exhibiting magnetic and luminescence bifunctional properties†
Min
Ren
a,
Song-Song
Bao
a,
Bing-Wu
Wang
 b,
Rute A. S.
Ferreira
c,
Li-Min
Zheng
*a and
Luis D.
Carlos
 *c
*c
aState Key Laboratory of Coordination Chemistry, School of Chemistry and Chemical Engineering, Collaborative Innovation Center of Advanced Microstructures, Nanjing University, Nanjing 210093, China. E-mail: lmzheng@nju.edu.cn
bBeijing National Laboratory for Molecular Sciences, State Key Laboratory of Rare Earth Materials Chemistry and Applications, College of Chemistry and Molecular Engineering, Peking University, Beijing 100871, P. R. China
cPhysics Department, CICECO, University of Aveiro, 3810-193, Aveiro, Portugal. E-mail: lcarlos@ua.pt
First published on 20th April 2015
Abstract
Two lanthanide(III) phosphonates [Ln(notpH4)(H2O)]ClO4·3H2O [Ln = Dy(1), Ho(2)] in which the lanthanide ion has a pseudo-D5h symmetry have been reported. Both show layer structures where the neighbouring lanthanide atoms are connected by a pair of O–P–O bridges. Magnetic studies reveal that field-induced slow relaxation can be observed in both cases. Complex 1 is of particular interest because it shows not only field-tunable dual relaxation processes originating from the single ion anisotropy as well as the spin collective effect, but also simultaneous emissions from the metal ion, the ligand and the radiative energy transfer from the ligand to metal. The emission of DyIII can be correlated to the magnetic data.
Introduction
Magnetic materials possessing multifunctions have been of intense interest due to their fundamental importance and potential applications in information storage and devices etc.1–3 The lanthanide compounds are appealing in this aspect because they can exhibit characteristic luminescence with well-resolved emission bands and long lifetimes.4 Meanwhile such molecules can display large single-ion magnetic anisotropy arising from the large unquenched orbital angular momentum and strong spin–orbit coupling, thus providing promising systems for single-molecule magnets (SMMs).5–8 So far, a number of lanthanide-based single-molecule magnets (Ln-SMMs) have been reported, some of which display rather high anisotropy energy barriers and blocking temperatures.9–19 Nevertheless, most of these studies focus on the magnetic behaviors of the materials, and examples of emissive Ln-SMMs are still limited.20–33 Moreover, the correlation of the relaxation mechanism and the luminescence spectra has been discussed only for a few TbIII, DyIII and YbIII systems.28–33Since the f–f transitions are parity forbidden, the absorption coefficients of lanthanides are normally very low. In order to circumvent this drawback, organic ligands or coordination complexes with strongly absorbing chromophores can be used as “antenna” to transfer energy to the lanthanide ions. By taking advantage of the coordination capabilities of the phosphonate ligands towards lanthanide ions, we succeeded in isolating the compound DyIr6(ppy)12(bpp)2(bppH)4(CF3SO3)·8H2O (ppy− = 2-phenylpyridine, bpp2− = 2-pyridylphosphonate).34 It shows field-induced slow magnetic relaxation at low temperature as well as photoluminescence at room temperature originating from the iridium chromophore. The absence of luminescence from the central DyIII ion indicates that the energy transfer from the iridium chromophore is not efficient. The 1,4,7-triazacyclononane-1,4,7-triyl-tris(methylenephosphonic acid) (notpH6) can provide three nitrogen and nine oxygen donors to chelate and bridge the lanthanide ions into clusters or extended structures.35 Recently, we found that a layered erbium-notp compound [Er(notpH4)(H2O)]ClO4·3H2O can display dual functions with the observation of field-tunable slow magnetization relaxation and near-IR emission at low temperature.36 This compound also gives the first example of Er-SMMs that shows an optical and magnetic correlation. Considering that notpH6 does not contain an obvious absorbing chromophore such as an aromatic ring, we are interested in studying the luminescence properties of the ligand itself and whether an efficient energy transfer from this ligand can be extended to the other lanthanide ions such as dysprosium and holmium.
In this paper, we report two new Ln-notp compounds, namely, [Ln(notpH4)(H2O)]ClO4·3H2O [Ln = Dy(1), Ho(2)]. Both display layered structures in which the LnIII ions are connected by O–P–O bridges. Field-induced slow magnetic relaxation is observed in both cases at low temperature. Compound 1 is of particular interest because it shows not only field-tunable dual magnetic relaxation processes but also simultaneous emissions of the ligand, the DyIII ion and the radiative energy transfer from the ligand to metal. A correlation between the magnetic and luminescence properties is also demonstrated for compound 1.
Experimental section
General methods
1,4,7-Triazacyclononane-1,4,7-triyl-tris(methylenephosphonic acid) (notpH6)37 and [Y(notpH4)(H2O)]ClO4·3H2O36 were prepared according to the literature. All the other starting materials were of reagent grade quality and were obtained from commercial sources without further purification. Elemental analyses for C, H and N were carried out on a PE 240C analyzer. IR spectra were recorded with a TENSOR 27 Fourier transform infrared spectrometer. Thermal analyses were performed in nitrogen on a METTLER TOLEDO TGA instrument. Powder X-ray diffraction (PXRD) data were collected on a Bruker D8 Advance diffractometer. The lanthanide contents in the doped samples were analyzed using Inductively Coupled Plasma Optical Emission Spectrometry (ICP OES-Optima 5300DV, PE). The magnetic susceptibility data were obtained on polycrystalline or powdered samples using a Quantum Design SQUID VSM system. The data were corrected for diamagnetic contributions of both the sample holder and the compound obtained from Pascal's constants.38The photoluminescence properties were investigated using a modular double grating excitation spectrofluorimeter with a TRIAX 320 emission monochromator (Fluorolog-3, Horiba Scientific) coupled to a R928 Hamamatsu photomultiplier, using a front face acquisition mode. The excitation source was a 450 W Xe arc lamp. The emission spectra were corrected for detection and optical spectral response of the spectrofluorimeter and the excitation spectra were corrected for the spectral distribution of the lamp intensity using a photodiode reference detector. The emission decay curves of the 4F9/2 (Dy3+) excited state were monitored with a Fluorolog TCSPC spectrofluorometer (Horiba Scientific) coupled to a TBX-04 photomultiplier tube module (950 V), 200 ns time-to-amplitude converter and 70 ns delay. The excitation source was a Horiba–Jobin–Yvon pulsed diode (NanoLED-390, peak at 390 nm, 1.2 ns pulse duration, 1 MHz repetition rate, and 150 ns synchronization delay).
Preparation of [Dy(notpH4)(H2O)]ClO4·3H2O (1)
A solution of Dy(ClO4)3·6H2O (1 M, 0.400 mL) was added to a solution of notpH6 (0.396 mmol, 0.163 g) in water (20 mL). HClO4 (70%) was dropped into the mixture until pH = 1.0. The clear solution was left at room temperature for 2 days to afford colorless prismatic crystals in a yield of 62%. IR (KBr, cm−1): 3457–2883 (br), 1638 (m), 1452 (w), 1171 (s), 1099 (s), 930 (m), 773 (m), 738 (w), 623 (m), 571 (m). Elemental analysis calcd (%) for C9H24N3P3O14ClDy·3H2O: C 14.54, H 4.07, N 5.65; found: C 14.22, H 4.10, N 5.55. Thermal analysis shows that the weight loss in the temperature range 25–85 °C is 9.5%, close to the release of four water molecules (calcd 9.7%). Between 100 °C and 270 °C, a plateau is observed in the TG curve (Fig. S1†).Preparation of [Ho(notpH4)(H2O)]ClO4·3H2O (2)
Ho(OAc)3·4H2O (0.05 mmol, 0.020 g) was added to a solution of notpH6 (0.05 mmol, 0.020 g) in water (10 mL). HClO4 (70%) was dropped into the mixture until pH = 1.0. The clear solution was left at room temperature for 2 weeks to afford colorless prismatic crystals in a yield of 37%. IR (KBr, cm−1): 3443–2876 (br), 1626 (m), 1496 (w) 1454 (w), 1431 (w), 1154 (s), 1099 (s), 932 (m), 769 (m), 742 (w), 624 (m), 568 (m). Elemental analysis calcd (%) for C9H24N3P3O14ClHo·3H2O: C 14.50, H 4.06, N 5.64; found: C 14.22, H 3.81, N 5.55. Thermal analysis shows that the weight loss in the 25–100 °C temperature range is 9.8%, in agreement with the value expected for the release of four water molecules (calcd 9.7%) (Fig. S1†).Preparation of the diluted sample of 1a
A mixture of Dy(ClO4)3·6H2O (1 M, 0.040 mL) and Y(ClO4)3·6H2O (1 M, 0.360 mL) solutions was added to a solution of notpH6 (0.394 mmol, 0.162 g) in water (20 mL). HClO4 (70%) was dropped into the mixture until pH = 1.0. The clear solution was left at room temperature for 2 days to afford colorless prismatic crystals in a yield of 85% based on notpH6. IR (KBr, cm−1): 3457–2873 (br), 1631 (m), 1451 (w), 1171 (s), 1094 (s), 929 (m), 771 (m), 739 (w), 625 (m), 561 (m). Elemental analysis calcd (%) for C9H24N3P3O14ClDy0.103Y0.897·3H2O: C 15.96, H 4.46, N 6.20; found: C 16.27, H 4.51, N 6.14. The amount of DyIII in 1a (10.3%) is confirmed by the inductively coupled plasma (ICP) measurements.Crystallographic analyses
Data collection was carried out on a Bruker SMART APEXII CCD (for 1) or a Bruker SMART APEX Duo CCD (for 2) diffractometer equipped with graphite monochromated MoKα (λ = 0.71073 Å) radiation at 296 K. The data were integrated using the Siemens SAINT program,39 with the intensities corrected for the Lorentz factor, polarization, air absorption, and absorption due to variation in the path length through the detector faceplate. Empirical absorption and extinction corrections were applied. The structures were solved by direct methods and refined on F2 by full-matrix least squares using SHELXTL.40 All the non-hydrogen atoms were refined anisotropically. All the hydrogen atoms were put in calculated positions or located from the Fourier maps and refined isotropically with the isotropic vibration parameters related to the non-hydrogen atom to which they are bonded. The crystallographic data are given in Table 1, and selected bond lengths and angles are gathered in Table 2, respectively.| Compound | 1 | 2 |
|---|---|---|
| a R 1 = ∑||F0| − |Fc||/∑|F0|; wR2 = [∑w(F02 − FC2)2/∑(FC2)2]1/2. | ||
| Formula | C9H30DyN3O17P3 | C9H30HoN3O17P3 |
| M | 743.22 | 745.65 |
| Crystal system | Triclinic | Triclinic |
| Space group |
P![[1 with combining macron]](https://www.rsc.org/images/entities/char_0031_0304.gif) |
P![[1 with combining macron]](https://www.rsc.org/images/entities/char_0031_0304.gif) |
| a/Å | 9.1503(10) | 9.1535(8) |
| b/Å | 9.2244(10) | 9.2424(8) |
| c/Å | 15.1607(16) | 15.2450(13) |
| α/° | 87.9626(18) | 88.2040(10) |
| β /° | 76.3602(17) | 76.2920(10) |
| γ /° | 75.8111(18) | 75.8130(10) |
| Z | 2 | 2 |
| V/Å3 | 1205.3(2) | 1214.29(18) |
| D c/g cm−3 | 2.048 | 2.045 |
| F(000) | 738 | 744 |
| Goodness-of-fit on F2 | 1.00 | 1.069 |
| R 1, wR2a [I > 2σ(I)] | 0.0252, 0.0599 | 0.0229, 0.0558 |
| R 1, wR2 (all data) | 0.0274, 0.0605 | 0.0257, 0.0573 |
| (Δρ)max, (Δρ)min/[e Å−3] | 0.81, −0.63 | 1.241, −0.980 |
| CCDC number | 1041404 | 1041405 |
| 1 | 2 | |
|---|---|---|
| a Symmetry transformations used to generate equivalent atoms: A: −x + 1, −y, −z + 1; B: −x, −y, −z + 1; C: −x, −y + 1, −z + 1. | ||
| Ln1–O1 | 2.257(3) | 2.248(3) |
| Ln1–O8C | 2.212(3) | 2.204(3) |
| Ln1–O4 | 2.435(2) | 2.430(2) |
| Ln1–O6B | 2.257(3) | 2.252(2) |
| Ln1–O7 | 2.263(3) | 2.261(2) |
| Ln1–O2A | 2.302(3) | 2.305(3) |
| Ln1–O1W | 2.483(3) | 2.472(3) |
| O8C–Ln1–O6B | 81.29(10) | 81.40(9) |
| O8C–Ln1–O7 | 88.73(10) | 88.02(9) |
| O6B–Ln1–O7 | 147.87(10) | 147.54(10) |
| O8C–Ln1–O1 | 172.96(10) | 172.64(9) |
| O6B–Ln1–O1 | 104.24(10) | 104.45(9) |
| O7–Ln1–O1 | 84.28(10) | 84.67(9) |
| O8C–Ln1–O2A | 103.04(10) | 103.37(9) |
| O6B–Ln1–O2A | 75.24(10) | 75.48(9) |
| O7–Ln1–O2A | 136.89(10) | 136.97(10) |
| O1–Ln1–O2A | 82.77(10) | 82.63(9) |
| O8C–Ln1–O4 | 97.20(10) | 97.15(9) |
| O6B–Ln1–O4 | 76.85(9) | 76.55(8) |
| O7–Ln1–O4 | 74.21(9) | 74.44(8) |
| O1–Ln1–O4 | 80.07(10) | 80.14(8) |
| O2A–Ln1–O4 | 142.30(9) | 142.10(8) |
| O8C–Ln1–O1W | 83.60(10) | 83.58(10) |
| O6B–Ln1–O1W | 136.39(9) | 136.54(9) |
| O7–Ln1–O1W | 71.66(10) | 71.59(9) |
| O1–Ln1–O1W | 94.99(10) | 94.83(10) |
| O2A–Ln1–O1W | 68.78(9) | 68.78(9) |
| O4–Ln1–O1W | 145.84(9) | 145.98(8) |
Results and discussion
Structural description
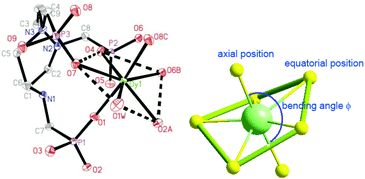
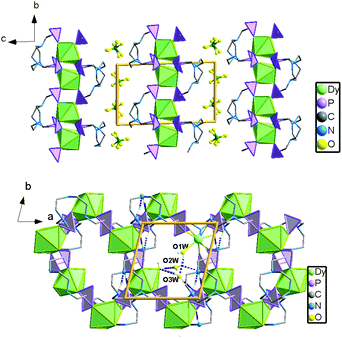
Single crystal structure analyses reveal that compounds 1 and 2 are isostructural to [Ln(notpH4)(H2O)]ClO4·3H2O (Ln = Eu, Gd, Tb, Er, Y).35,36 Thus compound 1 is selected for structural description. It crystallizes in the triclinic space group P![[1 with combining macron]](https://www.rsc.org/images/entities/char_0031_0304.gif) . The asymmetric unit contains one independent DyIII ion, one notpH42−, one ClO4−, and one coordinated and three lattice water molecules. The seven-coordinated DyIII ion has a distorted pentagonal bipyramidal geometry with a pseudo-D5h symmetry (Fig. 1), as determined by Continuous Shape Measure (CShM) analysis (Table S1†).41 The five equatorial positions are occupied by four phosphonate oxygens (O7, O4, O2A and O6B) and one water molecule (O1W) [Dy–Oeq 2.212(3)–2.483(3) Å]. The axial sites are filled with two phosphonate oxygens (O1 and O8C) [Dy–Oax 2.212(3)–2.257(3) Å]. The average axial Dy–O distance (2.264 Å) is shorter than the equatorial ones (av. 2.348 Å), suggesting a compressed pentagonal bipyramidal geometry around the DyIII ion. Equivalent {DyO7} polyhedra are connected by {PO3C} tetrahedra through corner-sharing, forming a two-dimensional brick-wall-like layered structure containing 24-member rings. The coordinated water molecules point toward the center of the rings, and form hydrogen bonds with the lattice water molecules (O2W, O3W) (Fig. 2). Extensive hydrogen bond interactions are also found among the triazamacrocyclic nitrogen atoms, the phosphonate oxygen atoms and the lattice water molecules.
. The asymmetric unit contains one independent DyIII ion, one notpH42−, one ClO4−, and one coordinated and three lattice water molecules. The seven-coordinated DyIII ion has a distorted pentagonal bipyramidal geometry with a pseudo-D5h symmetry (Fig. 1), as determined by Continuous Shape Measure (CShM) analysis (Table S1†).41 The five equatorial positions are occupied by four phosphonate oxygens (O7, O4, O2A and O6B) and one water molecule (O1W) [Dy–Oeq 2.212(3)–2.483(3) Å]. The axial sites are filled with two phosphonate oxygens (O1 and O8C) [Dy–Oax 2.212(3)–2.257(3) Å]. The average axial Dy–O distance (2.264 Å) is shorter than the equatorial ones (av. 2.348 Å), suggesting a compressed pentagonal bipyramidal geometry around the DyIII ion. Equivalent {DyO7} polyhedra are connected by {PO3C} tetrahedra through corner-sharing, forming a two-dimensional brick-wall-like layered structure containing 24-member rings. The coordinated water molecules point toward the center of the rings, and form hydrogen bonds with the lattice water molecules (O2W, O3W) (Fig. 2). Extensive hydrogen bond interactions are also found among the triazamacrocyclic nitrogen atoms, the phosphonate oxygen atoms and the lattice water molecules.
The static magnetic properties of 1–2
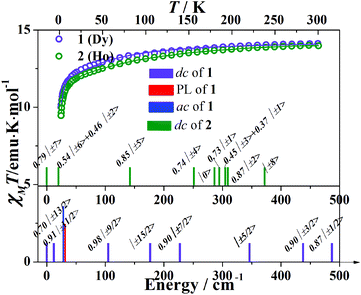
The temperature dependent molar susceptibilities were performed in the temperature range 1.8–300 K under an applied dc field of 1 kOe (Fig. 3). The room temperature χMT values are 14.12 emu K mol−1 for 1 and 13.98 emu K mol−1 for 2, respectively, which are consistent with the expected values of 14.17 emu K mol−1 for one isolated DyIII ion (6H15/2, S = 5/2, L = 5, g = 4/3) and 14.07 emu K mol−1 for the HoIII ion (5I8, S = 2, L = 6, g = 5/4). The susceptibility data obey the Curie–Weiss law over the high temperature region (>100 K). The Weiss constants (θ) are −11.2(5) K (for 1) and −10.8(2) K (for 2). In both cases, the χMT product decreases gradually on cooling and then more rapidly below ca. 25 K, which could originate from the thermal depopulation of the MJ sublevels and/or the presence of significant magnetic anisotropy.The M versus H/T plots below 10 K show a linear increase in the magnetization at low fields and then more gradually above 7 kOe. The magnetizations at 70 kOe (5.35Nβ for 1, 5.61Nβ for 2 at 1.8 K) are not saturated, indicating the existence of magnetic anisotropy of the system and/or low-lying excited states (Fig. S6†). The non-superimposition of isothermal curves also confirms the presence of significant magnetic anisotropy.
To determine the splitting of the ground state of the lanthanide ions caused by the crystal field and predict the dynamic magnetic properties, we use the CONDON package to fit the dc magnetic susceptibilities for 1 and 2.42,43 The Hamiltonian can be expressed as eqn (1):
| Ĥ = Ĥ0 + Ĥee + ĤSO + ĤCF + ĤM | (1) |
| ĤCF = B02Ĉ02(i) + B04Ĉ04(i) + B06Ĉ06(i) | (2) |
A good fit of all the magnetic curves has been obtained from a unique set of CF parameters (Table S2†). The electronic fine structure can be obtained from the CF parameters (Fig. 3). For complex 1, the ground state doublet is a mixture of MJ = ±13/2 with MJ = ±3/2. The first excited state MJ = ±9/2 is a little close in energy at 12 cm−1. The doublet MJ = ±15/2 which has the largest MJ values lies far from the ground state at 176 cm−1 (Fig. 3). For complex 2, the ground state is a mixture of MJ = ±7 and MJ = ±3, while the first excited state is MJ = ±6 mixed with MJ = ±2 which lies 20 cm−1 above the ground state. The doublet MJ = ±8 state shows the highest energy of Zeeman splitting at 372 cm−1 (Fig. 3).
The dynamic magnetic properties of 1–2
To investigate the magnetization dynamics of 1, alternating current (ac) magnetic susceptibilities were measured. Neither peak nor frequency dependence is observed for the in-phase (χ′M) and out-of-phase (χ′′M) signals at zero field (Fig. S7†), possibly due to the quantum tunneling of magnetization (QTM). To suppress the QTM effect, the ac measurements were conducted at 2 K under an applied dc field of 0.5–3 kOe with the frequency scan 1–999 Hz (Fig. S8†). Indeed, well-resolved peaks appear in the plots of χ′′Mvs. frequency, indicating slow relaxation of magnetization (relaxation A). Interestingly, above 0.5 kOe, another peak appears in the low frequency region of χ′′M(ν) plots, associated with the second slower relaxation process (relaxation B). The peak shifts to lower frequency with increasing external field. The field-tunable multiple relaxation processes can be clearly identified in the Cole–Cole plots (χ′′Mvs. χ′M) with the appearance of two semicircles above 0.5 kOe (Fig. S9†). The frequency dependence of the χ′′M ac susceptibilities can be fitted by the generalized Debye model for the single relaxation process [eqn (3)]45,46 or a linear combination of two modified Debye models for the double relaxation process [eqn (4)]:47,48 | (3) |
 | (4) |
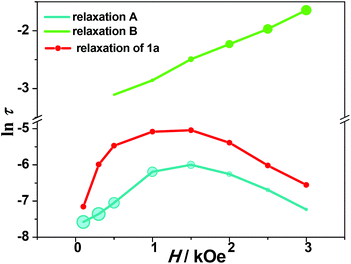
The optimum field Hm = 1.5 kOe of relaxation A is a competition result of the QTM effect and direct moment reversal processes. Under a lower external dc field, the degeneracy of the ground ±MJ levels is split, reducing the degree of mixing and mitigating the quantum tunneling process; while under a higher dc field the emergence of the direct relaxation process between the non-degenerate ±MJ levels accelerated the relaxation process again. To model the field dependence of τ, eqn (5) was introduced:49
 | (5) |
The first term represents the direct process, while the second corresponds to the zero-field QTM. The results are shown in Fig. S10,† and the values of A, B1 and B2 are given in Table S6.†
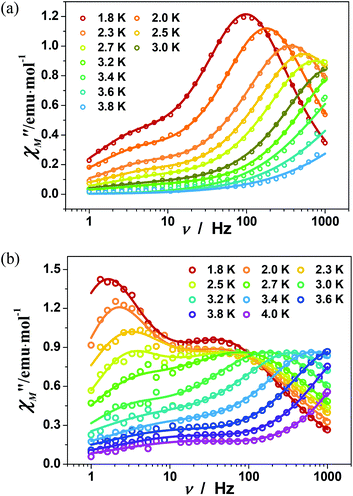
The magnetic dynamics of compound 1 was investigated in detail under 0.5 kOe and 1.5 kOe dc fields. Fig. S11† shows the temperature dependence of ac signals, measured under 0.5 kOe dc field. Both χ′M and χ′′M signals are frequency dependent with the peaks appearing below 4 K. The ac susceptibility with frequency scan below 4 K shows dominant peaks in the high frequency region, corresponding to relaxation A (Fig. 5a). The maxima of the χ′′M(ν) peaks shift to lower frequencies upon cooling, confirming that the relaxation A is thermally activated. Notably, shoulders are also visible in the χ′′M(ν) curves below 3 K, corresponding to relaxation B. The weight ratio of relaxation A and B (fA![[thin space (1/6-em)]](https://www.rsc.org/images/entities/char_2009.gif) :
:![[thin space (1/6-em)]](https://www.rsc.org/images/entities/char_2009.gif) fB) increases from 0.81
fB) increases from 0.81![[thin space (1/6-em)]](https://www.rsc.org/images/entities/char_2009.gif) :
:![[thin space (1/6-em)]](https://www.rsc.org/images/entities/char_2009.gif) 0.19 at 1.8 K to 0.92
0.19 at 1.8 K to 0.92![[thin space (1/6-em)]](https://www.rsc.org/images/entities/char_2009.gif) :
:![[thin space (1/6-em)]](https://www.rsc.org/images/entities/char_2009.gif) 0.08 upon heating to 3.2 K (Table S7†). It is interesting that the dual relaxation processes become more significant when the external dc field is increased to 1.5 kOe (Fig. 5b). The intensity of the two peaks in χ′′M are comparable at 1.8 K (fB = 0.52), but that of relaxation B decreases dramatically upon heating (fB = 0.25 at 4 K) (Table S8†).
0.08 upon heating to 3.2 K (Table S7†). It is interesting that the dual relaxation processes become more significant when the external dc field is increased to 1.5 kOe (Fig. 5b). The intensity of the two peaks in χ′′M are comparable at 1.8 K (fB = 0.52), but that of relaxation B decreases dramatically upon heating (fB = 0.25 at 4 K) (Table S8†).
The relaxation times can be extracted from the fitting of eqn (3) or eqn (4) (Tables S7 and S8†). For relaxation A, the temperature dependent relaxation time profiles can be fitted as a sum of the contributions of the quantum tunneling, direct, Raman, and Orbach relaxation mechanisms, shown in eqn (6):50
 | (6) |
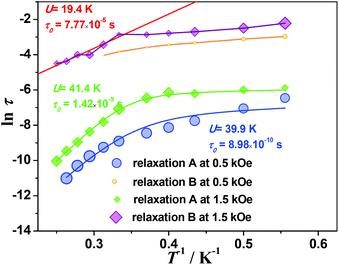
The third term represents the Raman relaxation process which occurs via a virtual excited state with n = 9 for the Kramers ions. The last term represents the Orbach relaxation process which occurs via a real excited state, typically for SMM behavior. To avoid possible meaningless fits as a result of overparameterization, the values of A, B1 and B2 are taken from fits to the field-dependent τ data (Table S6†). The best fits to eqn (6) lead to extremely small C values (close to zero), indicating that the Raman relaxation can be negligible. Assuming that C = 0, the anisotropic energy barriers can be obtained as Ueff = 39.9 ± 1.1 K (τ0 = 9.0 ± 0.9 × 10⁻¹⁰ s) for data measured at 0.5 kOe, and Ueff = 41.6 ± 1.3 K (τ0 = 1.3 ± 0.3 × 10⁻⁹ s) for data measured at 1.5 kOe, respectively (Fig. 6, Table S6†). The C values are very small. Also, the energy barriers remain almost unchanged while the relaxation time increases in the whole temperature range by increasing the external dc field, in accordance with the reducing degree of mixing and mitigating the quantum tunneling process.
It is noted that the relaxation times of relaxation B are 1–2 orders of magnitude larger than those of relaxation A, and show weak temperature dependence at low temperature, suggesting a direct relaxation mechanism (Fig. 6). When the external field is 1.5 kOe, the temperature dependence of the relaxation time is visible above 3 K for relaxation B. The Arrhenius fit results in the energy barrier of U = 19.4 ± 2.4 K (τ0 = 7 ± 4 × 10⁻⁵ s). Considering that the relative intensity of relaxation B is low in the high temperature region, the relaxation times extracted from the modified Debye models could not be quite reliable. To further explore the origin of the two relaxation processes in 1, the dynamic properties of the diamagnetically diluted sample 1a (10.3% DyIII doped into a YIII-based matrix) were investigated.
As shown in Fig. S19,† the χ′′M(ν) plots of 1a show well-shaped single peaks at 2 K under 0.1–3 kOe dc fields, associated with a single relaxation process (relaxation A′). The ln![[thin space (1/6-em)]](https://www.rsc.org/images/entities/char_2009.gif) τ vs. H profile for 1a is similar to that for 1, but the relaxation time is much longer in the former case (6.46(13) ms for 1avs. 2.48(2) ms for 1 at 1.5 kOe) (Fig. 4). This can be explained by the suppression of the QTM effect upon dilution. The field dependence of τ can be fitted with eqn (5), and the derived parameters of A, B1 and B2 are given in Table S6.† The parameters are different from those obtained for compound 1, which may be related to the inefficient QTM via dipolar interactions upon dilution and other variables such as the crystal density, the speed of sound in the solid, and the strength of the interaction of the spin system with the phonons.51
τ vs. H profile for 1a is similar to that for 1, but the relaxation time is much longer in the former case (6.46(13) ms for 1avs. 2.48(2) ms for 1 at 1.5 kOe) (Fig. 4). This can be explained by the suppression of the QTM effect upon dilution. The field dependence of τ can be fitted with eqn (5), and the derived parameters of A, B1 and B2 are given in Table S6.† The parameters are different from those obtained for compound 1, which may be related to the inefficient QTM via dipolar interactions upon dilution and other variables such as the crystal density, the speed of sound in the solid, and the strength of the interaction of the spin system with the phonons.51
The temperature and frequency dependent ac magnetic susceptibilities of 1a were measured under 1.5 kOe (Fig. S21–23†). The relaxation times extracted from the Debye model were fitted with eqn (6). The anisotropy barrier of the Orbach process is 38.2 ± 2.6 K (τ0 = 3.1 ± 0.6 × 10⁻¹⁰ s), close to that for relaxation A in compound 1 (Fig. S24†). The results demonstrate that the relaxation A in compound 1 is of single-ion anisotropy origin. Noting that the relaxation B disappears in the diluted sample 1a, the weak magnetic interactions between the DyIII ions must play an important role in the relaxation process.
The energy barrier for compound 1 is relatively smaller than other reported Dy-based SMMs in D5h symmetry.17,18 The weak easy-axis anisotropy could be explained by the coordination geometry of DyIII ions in 1 which deviates significantly from an idealized five-fold symmetry. As a result, the axial crystal field Wybourne notation B02, B04, B06 parameters could be reduced, and non-axial parameters (Bqk, q ≠ 0) could have non-zero values, which may induce the QTM effect.
The observation of dual thermally activated relaxation processes with extremely different relaxation times is unusual in Ln-based SMMs. This phenomenon was first observed by Long et al. in studying the magnetic dynamics of U(Ph2BPz2)3.52 They proposed that the faster relaxation is of single ion origin, while the very slow relaxation is attributed to a collective spin relaxation brought about by short-range intermolecular ordering. Another two examples showing similar behavior are a mononuclear Dy–TTF complex reported by Pointillart et al.53 and [Er(notpH4)(H2O)]ClO4·3H2O described by us.36
It is interesting to compare the magnetic behavior of compound 1 with that of [Er(notpH4)(H2O)]ClO4·3H2O in which the ErIII ions are cross-linked by O–P–O units.36 According to Rinehart and Long, axial and equatorial ligand fields are required to stabilize the most oblate DyIII and prolate ErIII ions, respectively.54 The similar energy barriers obtained for compound 1 and its Er-analogue can be explained by the deviation of coordination spheres around the DyIII or ErIII ions from the ideal pentagonal bipyramidal geometry in the two complexes (Table 3). Noting that both DyIII and ErIII are Kramers ions, we are curious to know whether a similar field-induced multiple relaxation could occur in analogous compounds containing non-Kramers ions such as HoIII (5I8). Therefore the magnetic dynamics of compound 2 was investigated.
Fig. S25† gives the ac susceptibilities of 2 measured at zero dc field showing neither peak nor frequency dependence. The application of an external field of 1.5 kOe switches on the χ′′M signals which become temperature dependent below 6 K (Fig. S27–29†). However no peaks are observed down to 1.8 K. The relaxation time τ can be extracted from the Debye model fitting the Cole–Cole plots at indicated temperatures. The anisotropic energy barrier is estimated to be 5.5 ± 0.2 K (τ0 = 8.4 ± 0.6 × 10⁻⁷ s) according to the Arrhenius law (Fig. S30†). This value is much smaller than that of compound 1, attributed to the effective QTM through transverse anisotropy. Obviously, the field-induced dual relaxation process is not visible in compound 2.
Photoluminescence properties
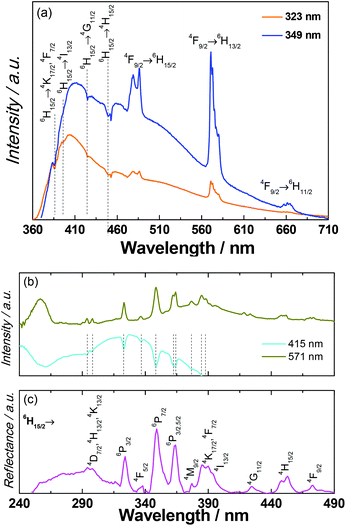
Since the accuracy of the electronic structure of the ground states obtained from the CONDON package is limited due to the departure from the idealized D5h geometry and non-negligible magnetic interactions in compound 1, the photoluminescence measurements were conducted to correlate the magnetic results.The photoluminescence of 1 was investigated in the solid state at room temperature (Fig. S31†) and at 14 K (Fig. 7). Under direct intra-4f excitation (349 nm, 6H15/2) the emission spectrum reveals the characteristic 4F9/2 → 6H15/2,13/2,11/2 (479, 571 and 661 nm, respectively) DyIII lines, superimposed on a broad band with two components at 415 nm and 525 nm, also observed in the emission spectra of the metal-free notpH6 ligand (Fig. S32†). A series of self-absorptions ascribed to intra-4f DyIII transitions (marked with vertical lines) are also observed, pointing out the presence of radiative energy transfer (part of the emitted light is absorbed by the DyIII ions and subsequently converted into f–f emission). Such radiative energy transfer has been previously observed and named the “inner filter” effect.55 The self-absorptions are also clearly observed in the excitation spectra monitored within the ligand emission (415 nm, Fig. 7b) superimposed on a broad band peak in the UV region ascribed to the ligand excited states (Fig. S32†). The excitation spectrum monitored around the maximum intensity peak position of the DyIII emission (571 nm) displays the ligand related bands, another component around 256 nm attributed to a ligand-to-metal-charge-transfer band (LMCT) and a series of DyIII transitions between the 6H15/2 level and the 4D7/2, 4K13/2,17/2, 6P3/2,5/2, 4F5/2–9/2, 4H13/2,15/2, 4M9/2, 4I13/2, and 4G11/2 excited states.56
These intra-4f lines are also observed in the UV-visible reflectance spectrum (Fig. 7c). We should note that the LMCT band is not observed in the excitation spectrum selectively monitored within the ligand emission at 415 nm (Fig. 7b) and in the reflectance spectrum of 1 (Fig. 7c) and in the excitation spectra of the isolated ligand (Fig. S32†). The larger relative intensity of the intra-4f lines indicates that the main excitation path for the DyIII ions is through direct intra-4f excitation. In the diluted sample 1a, the absence of the self-absorptions suggests that the radiative ligand-to-DyIII energy transfer is absent, possibly due to the low concentration of DyIII (Fig. S34†).
The 4F9/2 emission decay curves were monitored at 571 nm for 1 being well reproduced by a single exponential function, in good agreement with the presence of a single average DyIII local environment (Fig. S36†). From the fit, the 4F9/2 lifetime values are 4.59 ± 0.13 ns and 3.78 ± 0.09 ns, at 14 K and at room temperature, respectively. These values are lower than those measured for other DyIII-based complexes reported in the literature,20,23 which may be explained by the presence of OH oscillators from one coordinated water in the first coordination shell of 1 and/or concentration quenching.
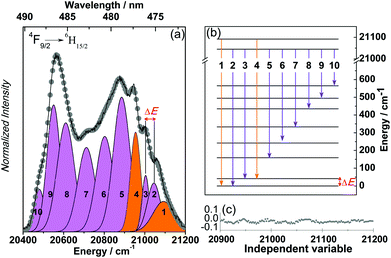
In order to experimentally investigate the crystal field splitting of the ground state of the DyIII ions in 1, the 14 K high-resolution emission spectrum in the spectral region of the 6F9/2 → 6H15/2 transition was acquired, as illustrated in Fig. 8.
The maximum Stark splitting of the 6H15/2 levels is eight, pointing out the presence of two transitions arising from “hot” bands involving the first Stark component of the 7F9/2 level. The assignment of the transitions is proposed in Fig. 8b which allows us to establish the energy diagram of the Stark-sub-levels. The energy gap between the ground and first excited states of the 6H15/2 crystal field splitting (ΔE, Fig. 8) is 56.1 ± 12.9 K (39.0 ± 9.0 cm−1), which agrees well with the energy barrier extracted from the ac magnetic studies (41.4 K).
The photoluminescence properties of 2 were also investigated in the UV-visible range. The emission of HoIII could not be observed due to the non-radiative deactivation processes from the emissive state of 5S2.4 The ligand emission concomitant with the radiative energy transfer from ligand-to-HoIII can be obviously observed in the excitation and emission spectra (Fig. S39 and S40†), in which several negative sharp peaks associated with the self-absorption of the HoIII appear on the broadband of ligand excitation and emission. The positions of these peaks are well coinciding with the absorption spectra of 2, corresponding to the absorption from the ground state 5I8 to excited states of (5G, 5D, 3G)4 (287 nm), 3K6 (334 nm), 3H6 (360 nm), (5G, 3G)5 (417 nm), 5G6 (452 nm), 5K8 (472 nm), 5F3 (486 nm), 5F4 (536 nm), 5S2 (545 nm), by referring to HoIII aqua ions.56
Conclusions
Two lanthanide phosphonates [Ln(notpH4)(H2O)]ClO4·3H2O [Ln = Dy(1), Ho(2)] with layered structures are reported. Complex 1 exhibits field-tunable dual relaxation processes that originated from single ion anisotropy and the collective spin relaxation, respectively. The latter can be quenched under magnetic dilution. Complex 2 shows a field-induced single relaxation process with a very small energy barrier. Photoluminescence studies reveal that compound 1 shows simultaneous emissions from the metal and the ligand as well as the radiative ligand-to-metal energy transfer. The latter two are also visible in compound 2. More interestingly, the luminescence data of compound 1 can be correlated to the magnetic data. Obviously, compounds 1 and 2 provide new members to the small family of emissive molecular materials showing slow magnetization relaxation at low temperature. Further work is in progress to explore new materials combining magnetic and luminescence functions.Acknowledgements
We acknowledge the financial support of this work by the National Basic Research Program of China (2013CB922102) and the Graduate Innovation Fund of Jiangsu Province (0205Y511).Notes and references
- W. Wernsdorfer and R. Sessoli, Science, 1999, 284, 133–135 CrossRef CAS.
- M. N. Leuenberger and D. Loss, Nature, 2001, 410, 789–793 CrossRef CAS PubMed.
- S. Hill, R. S. Edwards, N. Aliaga-Alcalde and G. Christou, Science, 2003, 302, 1015–1018 CrossRef CAS PubMed.
- J.-C. G. Bunzli and C. Piguet, Chem. Soc. Rev., 2005, 34, 1048–1077 RSC.
- R. Sessoli and A. K. Powell, Coord. Chem. Rev., 2009, 253, 2328 CrossRef CAS PubMed.
- L. Sorace, C. Benelli and D. Gatteschi, Chem. Soc. Rev., 2011, 40, 3092–3104 RSC.
- M. Ren and L.-M. Zheng, Prog. Phys., 2014, 34, 119–135 Search PubMed.
- P. Zhang, Y.-N. Guo and J. Tang, Coord. Chem. Rev., 2013, 257, 1728–1763 CrossRef CAS PubMed.
- N. Ishikawa, M. Sugita, T. Ishikawa, S.-y. Koshihara and Y. Kaizu, J. Am. Chem. Soc., 2003, 125, 8694–8695 CrossRef CAS PubMed.
- M. A. AlDamen, J. M. Clemente-Juan, E. Coronado, C. Martí-Gastaldo and A. Gaita-Ariño, J. Am. Chem. Soc., 2008, 130, 8874–8875 CrossRef CAS PubMed.
- S.-D. Jiang, B.-W. Wang, G. Su, Z.-M. Wang and S. Gao, Angew. Chem., Int. Ed., 2010, 49, 7448–7451 CrossRef CAS PubMed.
- S.-D. Jiang, B.-W. Wang, H.-L. Sun, Z.-M. Wang and S. Gao, J. Am. Chem. Soc., 2011, 133, 4730–4733 CrossRef CAS PubMed.
- J. D. Rinehart, M. Fang, W. J. Evans and J. R. Long, Nat. Chem., 2011, 3, 538–542 CrossRef CAS PubMed.
- J. D. Rinehart, M. Fang, W. J. Evans and J. R. Long, J. Am. Chem. Soc., 2011, 133, 14236–14239 CrossRef CAS PubMed.
- R. J. Blagg, C. A. Muryn, E. J. L. McInnes, F. Tuna and R. E. P. Winpenny, Angew. Chem., Int. Ed., 2011, 50, 6530–6533 CrossRef CAS PubMed.
- C. R. Ganivet, B. Ballesteros, G. de la Torre, J. M. Clemente-Juan, E. Coronado and T. Torres, Chem. – Eur. J., 2013, 19, 1457–1465 CrossRef CAS PubMed.
- J.-L. Liu, Y.-C. Chen, Y.-Z. Zheng, W.-Q. Lin, L. Ungur, W. Wernsdorfer, L. F. Chibotaru and M.-L. Tong, Chem. Sci., 2013, 4, 3310–3316 RSC.
- J.-L. Liu, J.-Y. Wu, Y.-C. Chen, V. Mereacre, A. K. Powell, L. Ungur, L. F. Chibotaru, X.-M. Chen and M.-L. Tong, Angew. Chem., Int. Ed., 2014, 53, 12966–12970 CrossRef CAS PubMed.
- R. J. Blagg, L. Ungur, F. Tuna, J. Speak, P. Comar, D. Collison, W. Wernsdorfer, E. J. L. McInnes, L. F. Chibotaru and R. E. P. Winpenny, Nat. Chem., 2013, 5, 673–678 CrossRef CAS PubMed.
- J. Ruiz, A. J. Mota, A. Rodriguez-Dieguez, S. Titos, J. M. Herrera, E. Ruiz, E. Cremades, J. P. Costes and E. Colacio, Chem. Commun., 2012, 48, 7916–7918 RSC.
- Y. L. Wang, Y. Ma, X. Yang, J. K. Tang, P. Cheng, Q. L. Wang, L. C. Li and D. Z. Liao, Inorg. Chem., 2013, 52, 7380–7386 CrossRef CAS PubMed.
- F. Pointillart, B. Le Guennic, T. Cauchy, S. Golhen, O. Cador, O. Maury and L. Ouahab, Inorg. Chem., 2013, 52, 5978–5990 CrossRef CAS PubMed.
- M. Fang, J.-J. Li, P.-F. Shi, B. Zhao and P. Cheng, Dalton Trans., 2013, 42, 6553–6563 RSC.
- G. Cosquer, F. Pointillart, J. Jung, B. Le Guennic, S. Golhen, O. Cador, Y. Guyot, A. Brenier, O. Maury and L. Ouahab, Eur. J. Inorg. Chem., 2014, 69–82 CrossRef CAS PubMed.
- P. Martín-Ramos, M. Ramos Silva, J. T. Coutinho, L. C. J. Pereira, P. Chamorro-Posada and J. Martín-Gil, Eur. J. Inorg. Chem., 2014, 511–517 CrossRef PubMed.
- S. Mohapatra, B. Rajeswaran, A. Chakraborty, A. Sundaresan and T. K. Maji, Chem. Mater., 2013, 25, 1673–1679 CrossRef CAS.
- P.-H. Guo, Y. Meng, Y.-C. Chen, Q.-W. Li, B.-Y. Wang, J.-D. Leng, D.-H. Bao, J.-H. Jia and M.-L. Tong, J. Mater. Chem. C, 2014, 2, 8858–8864 RSC.
- G. Cucinotta, M. Perfetti, J. Luzon, M. Etienne, P.-E. Car, A. Caneschi, G. Calvez, K. Bernot and R. Sessoli, Angew. Chem., Int. Ed., 2012, 51, 1606–1610 CrossRef CAS PubMed.
- M.-E. Boulon, G. Cucinotta, J. Luzon, C. Degl'Innocenti, M. Perfetti, K. Bernot, G. Calvez, A. Caneschi and R. Sessoli, Angew. Chem., Int. Ed., 2013, 52, 350–354 CrossRef CAS PubMed.
- J. Long, R. Vallat, R. A. S. Ferreira, L. D. Carlos, F. A. Almeida Paz, Y. Guari and J. Larionova, Chem. Commun., 2012, 48, 9974–9976 RSC.
- F. Pointillart, B. L. Guennic, S. Golhen, O. Cador, O. Maury and L. Ouahab, Chem. Commun., 2013, 49, 615–617 RSC.
- K. Yamashita, R. Miyazaki, Y. Kataoka, T. Nakanishi, Y. Hasegawa, M. Nakano, T. Yamamura and T. Kajiwara, Dalton Trans., 2013, 42, 1987 RSC.
- Q.-W. Li, J.-L. Liu, J.-H. Jia, J.-D. Leng, W.-Q. Lin, Y.-C. Chen and M.-L. Tong, Dalton Trans., 2013, 42, 11262 RSC.
- D. Zeng, M. Ren, S.-S. Bao, L. Li and L.-M. Zheng, Chem. Commun., 2014, 50, 8356–8359 RSC.
- S.-S. Bao, L.-F. Ma, Y. Wang, L. Fang, C.-J. Zhu, Y.-Z. Li and L.-M. Zheng, Chem. – Eur. J., 2007, 13, 2333–2343 CrossRef CAS PubMed.
- M. Ren, S.-S. Bao, R. A. S. Ferreira, L.-M. Zheng and L. D. Carlos, Chem. Commun., 2014, 50, 7621 RSC.
- T. J. Atkins, J. E. Richman and W. F. Oettle, Org. Synth., 1978, 58, 87 Search PubMed.
- O. Kahn, Molecular Magnetism, VCH, New York, 1993 Search PubMed.
- SAINT, Program for Data Extraction and Reduction, Siemens Analytical X-ray Instruments, Madison, WI, 1994–1996 Search PubMed.
- SHELXTL (version 5.0), Reference Manual, Siemens Industrial Automation, Analytical Instruments, Madison, WI, 1995 Search PubMed.
- M. Pinsky and D. Avnir, Inorg. Chem., 1998, 37, 5575–5582 CrossRef CAS PubMed.
- Magnetochemie, ed. H. Lueken, Teubner, Stuttgart, Leipzig, 1999 Search PubMed.
- H. Schilder and H. Lueken, J. Magn. Magn. Mater., 2004, 281, 17 CrossRef CAS PubMed.
- B. G. Wybourne, Spectroscopic Properties of Rare Earths, 1965 Search PubMed.
- K. S. Cole and R. H. Cole, J. Chem. Phys., 1941, 9, 341–351 CrossRef CAS PubMed.
- D. Gatteschi, R. Sessoli and J. Villain, Molecular Nanomagnets, 2006 Search PubMed.
- Y.-N. Guo, G.-F. Xu, P. Gamez, L. Zhao, S.-Y. Lin, R. Deng, J. Tang and H.-J. Zhang, J. Am. Chem. Soc., 2010, 132, 8538–8539 CrossRef CAS PubMed.
- N. Domingo, F. Luis, M. Nakano, M. Muntó, J. Gómez, J. Chaboy, N. Ventosa, J. Campo, J. Veciana and D. Ruiz-Molina, Phys. Rev. B: Condens. Matter, 2009, 79, 214404 CrossRef.
- A. Fort, A. Rettori, J. Villain, D. Gatteschi and R. Sessoli, Phys. Rev. Lett., 1998, 80, 612–615 CrossRef CAS.
- (a) J. M. Zadrozny, M. Atanasov, A. M. Bryan, C.-Y. Lin, B. D. Rekken, P. P. Power, F. Neese and J. R. Long, Chem. Sci., 2013, 4, 125 RSC; (b) E. Lucaccini, L. Sorace, M. Perfetti, J.-P. Costes and R. Sessoli, Chem. Commun., 2014, 50, 1648–1651 RSC.
- (a) R. Orbach, Proc. R. Soc. London, Ser. A, 1961, 264, 458 CrossRef CAS; (b) R. Orbach, Proc. R. Soc. London, Ser. A, 1961, 264, 485 CrossRef CAS; (c) M. B. Walker, Can. J. Phys., 1968, 46, 1347 CrossRef CAS PubMed.
- (a) J. D. Rinehart, K. R. Meihaus and J. R. Long, J. Am. Chem. Soc., 2010, 132, 7572–7573 CrossRef CAS PubMed; (b) K. R. Meihaus, J. D. Rinehart and J. R. Long, Inorg. Chem., 2011, 50, 8484–8489 CrossRef CAS PubMed.
- G. Cosquer, F. Pointillart, S. Golhen, O. Cador and L. Ouahab, Chem. – Eur. J., 2013, 19, 7895–7903 CrossRef CAS PubMed.
- J. D. Rinehart and J. R. Long, Chem. Sci., 2011, 2, 2078–2085 RSC.
- C. Molina, R. A. S. Ferreira, G. Poirier, L. Fu, S. J. L. Ribeiro, Y. Messsaddeq and L. D. Carlos, J. Phys. Chem. C, 2008, 112, 19346–19352 CAS.
- W. T. Carnall, J. Chem. Phys., 1968, 49, 4424 CrossRef CAS PubMed.
Footnote |
| † Electronic supplementary information (ESI) available: Thermal analyses, PXRD patterns, additional magnetic and photoluminescence data. CCDC 1041404 and 1041405. For ESI and crystallographic data in CIF or other electronic format see DOI: 10.1039/c4qi00242c |
| This journal is © the Partner Organisations 2015 |

