
 Open Access Article
 This Open Access Article is licensed under a Creative Commons Attribution-Non Commercial 3.0 Unported Licence
Comparative evaluation and optimization of off-the-shelf cationic polymers for gene delivery purposes†
C.
Malloggi
ab,
D.
Pezzoli
b,
L.
Magagnin
a,
L.
De Nardo
ab,
D.
Mantovani
c,
E.
Tallarita
a and
G.
Candiani
*abd
aDepartment of Chemistry, Materials and Chemical Engineering “Giulio Natta”, Politecnico di Milano, Via Mancinelli 7, 20131 Milan, Italy. E-mail: gabriele.candiani@polimi.it; Tel: +39 02 2399 3181
bPolitecnico di Milano Research Unit, National Interuniversity Consortium of Materials Science and Technology – INSTM, Milan, Italy
cLaboratory for Biomaterials and Bioengineering, CRC-I, Department of Mining, Metallurgical and Materials Engineering & CHU de Quebec Research Centre, Laval University, Quebec City, Canada
dCentro Interuniversitario di Ricerca in Biotecnologie Proteiche “The Protein Factory”, Politecnico di Milano, CNR – ICRM Milano, and Università degli Studi dell'Insubria, Milan, Italy
First published on 22nd July 2015
Abstract
Cationic polymers are amongst the most utilized non-viral vectors for gene transfer owing to their ability to condense and protect the genetic material within polyplexes and to ferry it into cells. Quite a number of parameters, both related to the features of the vectors themselves (e.g. degree of branching, molecular weight, polydispersity) and to polyplexes (e.g. nitrogen to phosphate ratio (N/P), dose of complexes delivered, complexation buffer, etc.), are known to affect transfection behaviour. Consequently, some substantial discrepancy found in raw materials and in-home protocols across laboratories account for some disagreement and conflicting data about their performance. Hereinafter we provide a thorough chemical-physical and in vitro biochemical characterization, comparison, and optimization of the most widely used, commercially sourced polymers used in transfection, namely linear polyethylenimines (lPEIs), branched PEIs (bPEIs), linear poly-L-lysines (lPLLs), and polyamidoamine dendrimers (dPAMAMs). By means of a stepwise approach, we pinpointed the most effective molecular weight and complexation conditions specific to each of them and correlated the physicochemical features of polyplexes with their transfection effectiveness. Besides, taking separately into account the effects on transfection of the plasmid dose delivered to cells, the cell seeding density and the volume of the culture medium, we highlited a range of optimal conditions roughly specific to each studied polymer. Finally, we coped with the effect of the variation of these three parameters at once on the transfection effectiveness of lPEI and bPEI and pinpointed an array of settings specifically optimized to attain truly superior performances.
Introduction
Since the first description of poly-L-lysine (PLL) by Wu and Wu as early as 1987,1 cationic polymers have become amongst the most utilized non-viral vectors for gene transfer. Basically, cationic polymers are materials that electrostatically bind to the DNA or the RNA, thereby condensing and protecting the genetic material within particles (polyplexes) of a few tens to a few hundred nanometers in hydrodynamic diameter (DH) that allow for cell internalization. Such cationic polymers, including off-the-shelf materials and those specifically designed for gene delivery applications, encompass a large variety of chemistries and architectures. They can have linear, branched (i.e. randomly disposed) or dendrimeric (i.e. hierarchically organized) three dimensional (3D) structures and the chemical moieties involved in binding of nucleic acids (e.g. from primary to quaternary amines, guanidino and triazino groups, etc.) can lie within the backbone or branch off from it in the form of pendant groups.2,3A wide variety of commercially sourced polymers such as linear polyethylenimines (lPEIs),4,5 branched PEIs (bPEIs),4,6,7 linear PLLs (lPLLs)8,9 and polyamidoamine dendrimers (dPAMAMs)8,10 has been extensively used as gold standards to benchmark novel gene delivery vectors in the majority of studies published so far. Nonetheless, there remains some substantial disagreement on their performance11,12 due to the wide variability in experimental conditions employed in gene delivery assays (e.g. the use of primary cells vs. cell lines, the composition of the cell culture medium, the dose of polyplexes delivered to cells, the nitrogen (N) to phosphate (P) ratio (N/P) used for complexation, the complexation buffer selected, etc.) and/or any possible differences in raw materials used (e.g. the degree of branching, the number average molecular weight (Mn), the weight average molecular weight (Mw), the polydispersity, etc.). All these issues together account for much of the discrepancy among studies that have hampered and sometimes even precluded intercomparing the results published hitherto.13 A practical example to shed light on how much the performance of a given gene vector differs dramatically across publications can be drawn from a survey of the burgeoning literature on bPEI. For instance, Godbey et al. found that the transfection efficiency of bPEI at N/P 13.5 increased along with increasing the Mw (70 kDa > 10 kDa ≫ 1.8 kDa bPEI).14 Conversely, Kunath and colleagues compared commercially sourced 25 kDa bPEI used at N/P 6.7 to that of 5.4 kDa bPEI synthesized ad-hoc and tested at N/P 67, finding out that the latter outdid the former in transfection.15
In light of these rather conflicting results, there thus is a huge need for researchers to pool and consolidate scientific findings by detailing the transfection capabilities of the main different polymeric vectors used in strictly defined conditions.13 That was the main thrust of our survey. Although a direct comparison of benchmark liposomes and commercially sourced lipids for gene delivery has recently been reported,16 to the best of our knowledge this is the first thorough and exhaustive survey of known polymeric gene delivery vectors. By means of a stepwise approach, we hereinafter provided the in vitro characterization, comparison and optimization of off-the-shelf polymers amongst the most widely used for gene delivery purposes (i.e. lPEIs, bPEIs, lPLLs, and dPAMAMs).
Experimental section
Materials
Plasmid DNA (pDNA) encoding for the modified firefly luciferase pGL3-Control Vector (5.2 kbp) and Luciferase Assay System were purchased from Promega (Milan, Italy), anion-exchange columns for purification of pDNA were from Qiagen (Milan, Italy). BCA Protein Assay Kit was from Pierce Chemical (Rockford, IL, USA). Salmon sperm DNA and AlamarBlue Cell Viability Reagent were purchased from Life Technologies Italia (Monza, Italy). HeLa (human epithelial ovarian carcinoma cells, CCL-2.2) cell line was purchased from the American Type Culture Collection (ATCC, Manassas, VA, USA) while E. coli DH5α (Cat. 9027) was from Takara Bio (Otsu, Japan).lPEIs with Mw of 2.5, 25 and 250 kDa and bPEIs with Mw of 1.2, 10 and 50–100 kDa were from Polysciences (Eppelheim, Germany); ethylene diamine core dendrimers (dPAMAMs) of 1.4, 14 and 116 kDa (also referred to as generation G1, G4 and G7, respectively), lPLLs with Mw of 1–5, 15–30 and 70–150 kDa and all other chemicals were from Sigma-Aldrich (Milan, Italy) if not differently specified.
Preparation of pDNA
E. coli DH5α was transformed with pGL3-Control Vector plasmid and amplified in LB broth (Life Technologies Italia) at 37 °C overnight. pDNA was isolated and purified with Qiagen Maxiprep kit according to the supplier's protocol. The concentration and purity of pDNA were assessed by measuring the OD260/OD280 through a NanoDrop 2000c spectrophotometer (Fisher Scientific, Illkirch, France), then stored at −20 °C in TE buffer 0.1× (1 mM Tris, pH 8.0; 0.1 mM EDTA) until use.Preparation of polymer solutions
PEIs were all diluted either in 10 mM HEPES buffer (pH 7.0) or 150 mM NaCl (pH 7.4) to obtain stock solutions at an amine concentration ([N]) of 20 mM, considering that there is one nitrogen per repeat unit of PEI, –NHCH2CH2–, which corresponds to a Mw of 43 Da.17 lPLLs were diluted either in 10 mM HEPES buffer (pH 7.0) or 150 mM NaCl (pH 7.4) to a final [N] of 20 mM. For the preparation of stock solutions of dPAMAMs, methanol was first removed by rotary evaporation under vacuum. Then, the polymeric films were hydrated with double distilled water (ddH2O) to a final dPAMAM concentrations of 3.9 g L−1 for 1.4 kDa, and of 5 g L−1 for both 14.2 kDa and 116.5 kDa polymers, corresponding invariably to a final [N] of 22 mM.Preparation of polyplexes
Complexes were prepared at room temperature (r.t.) by mixing each polymer solution, at the desired polymer concentration, with an aqueous solution of pGL3, yielding different N/Ps. N/P is defined as the number of amines (N) of the cationic polymer which complexed the phosphate groups (P) of a given amount of DNA. Polyplex suspensions were prepared either in 10 mM HEPES buffer (pH 7.0), 150 mM NaCl (pH 7.4) or Dulbecco's Modified Eagle Medium (DMEM) supplemented with 1 mM sodium pyruvate, 10 mM HEPES buffer, 100 U per mL penicillin, 0.1 mg per mL streptomycin, 2 mM glutamine (hereafter referred to as serum-free DMEM). The final pDNA concentration was 20 ng μL−1. The resulting suspensions were incubated for 20 min at 25 °C prior to use.To evaluate the influence of the order of addition between the polymer and the pGL3, polyplexes were prepared by adding the aqueous solution of polymers to pGL3 in the appropriate buffer (DNA + polymer) and vice versa (polymer + DNA).
To evaluate the influence of the volumes of polymer and pGL3 solutions during the phase of preparation on the transfection effectiveness, polyplex suspensions were prepared at the pGL3 : polymer stoichiometries (v![[thin space (1/6-em)]](https://www.rsc.org/images/entities/char_2009.gif) :v) of 1:10, 1:1 and 10:1.
:v) of 1:10, 1:1 and 10:1.
Evaluation of DNA complexation
The DNA binding ability of each cationic polymer was monitored by a fluorophore-displacement assay. For each condition, 3.6 μL of each cationic polymer solution at different concentrations were added to 0.12 μg of salmon sperm DNA in 2.4 μL of 20× SYBR Green I (λex = 497 nm; λem = 520 nm) to yield the desired N/P. Afterwards, polyplexes were incubated for 20 min at 25 °C, then diluted 1:5 in either 10 mM HEPES buffer (pH 7.0), or 150 mM NaCl (pH 7.4), or serum-free DMEM. Fluorescence measurements were carried out in black 384-well microplates by using a GENios Plus reader (Tecan, Segrate, Italy). The relative fluorescence (F) of each sample was expressed according to the following equation:
Measurements of size and ζ-potential of polyplexes
Dynamic light scattering (DLS) and Laser Doppler Micro-electrophoretic studies were carried out to evaluate the mean hydrodynamic diameter (DH) and the ζ-potential (ζP) of the complexes using a Malvern Zetasizer Nano ZS instrument (Malvern, UK), fitted with a 5 mW HeNe laser, 633 nm, at a fixed scattering angle of 173°. For each condition, polyplexes at different N/Ps containing 1 μg of salmon sperm DNA were prepared. Samples were incubated for 20 min at 25 °C, hence diluted 1:9 in 10 mM HEPES buffer (pH 7.0), in 150 mM NaCl (pH 7.4) or in phenol red-free serum-free DMEM.
Atomic force microscopy
An atomic force microscope (AFM; NTEGRA-Spectra, NT-MDT, Moscow, Russia) was used for imaging the shape of polyplexes. Briefly, polyplexes were prepared as described above and a drop of 2 μL of polyplex suspension was placed on a silicon wafer and dried at r.t. Images were collected in tapping mode (semicontact) at a scanning speed of 0.6 Hz and analyzed using NT-MDT Nova software (v1.0.26). Kelvin probe force microscopy (KPFM) was also conducted on the AFM (NTEGRA-Spectra, NT-MDT) to map and quantify the local surface potential down to the resolution of the cantilever tip diameter.Cell culture and transfection
Following a protocol optimized and described for lipidic vectors,18 transfection studies were performed on HeLa cells seeded in 96-well plates and grown in DMEM supplemented with 1 mM sodium pyruvate, 10 mM HEPES buffer, 100 U per mL penicillin, 0.1 mg per mL streptomycin, 2 mM glutamine and 10% FBS (hereafter referred to as complete medium), at 37 °C in a 5% CO2 humidified atmosphere. Cells were passaged the day before seeding and used within eight passages. The typical transfection procedure described here below was rigorously applied to all transfections, unless noted otherwise by varying only one parameter at a time. Cells were plated in 96-well sterile culture plates at a density of 2 × 10⁴ cells per cm2. Twenty-four hours after cell seeding, 320 ng of pGL3 per cm2 were complexed (v/v) with each polymer solution (pGL3:polymer = 1:10), at the desired N/P. Polyplexes allowed to form for 20 min, hence incubated with cells for 24 h in a final volume of 300 μL of complete medium per cm2.
For experiments in the absence of serum, polyplexes were incubated over cells in serum-free DMEM for 4 h, the medium was then discarded and cells cultured for further 20 h in complete medium.
To assess the effect of the cell seeding density on the transfection efficacy, HeLa cells were plated at different densities of 0.25 × 10⁴, 0.5 × 10⁴, 1.0 × 10⁴, 2.0 × 10⁴, 4.0 × 10⁴ and 6.0 × 10⁴ cells per cm2.
The possible influence of the transfection medium volume was assessed by carrying out transfections in a final volume of 150, 225, 300, 450, 600 and 900 μL of medium per cm2.
To assess the influence of plasmid dose on polyfection, HeLa cells were challenged with 40, 160, 320, 640, 1280 and 2560 ng of pGL3 per cm2.
To evaluate the effects of the incubation time of polyplexes over cells on transfection, HeLa cells were exposed to polyplexes for 4, 8, 24, 48, 72, 96 and 120 h.
Experiments were usually run at least in quadruplicate.
Evaluation of cytotoxicity
At the indicated time after transfection, the cytotoxic effect of polyplexes was assessed according to manufacturer's guidelines using AlamarBlue cell viability assay. Briefly, medium was removed and each well was charged with 100 μL of complete medium containing 10 μL of resazurin dye. Cells were incubated in standard culture conditions for 2 h and the fluorescence of the medium was read by means of a GENios Plus reader (λex = 560 nm; λem = 590 nm). Viability of untreated control cells was assigned as 100% and cytotoxicity was determined as follows:| Cytotoxicity [%] = 100% − Viability [%] |
Evaluation of transfection efficiency
The extent of transgene expression was quantified by measuring the luciferase activity using the Luciferase Assay System. Cells were washed with PBS and lysed with Cell Culture Lysis Reagent (Promega Italia, Milan, Italy). Twenty μL of cell lysate was then mixed with 50 μL of Luciferase Assay Reagent and luminescence was measured using a GENios Plus reader. The luminescence signal of each sample was normalized to its protein content, determined using bicinchoninic acid (BCA) assay. Data were expressed as relative light units per mg of proteins (RLU mg−1 of proteins).Statistical analysis
Statistical analysis was carried out by GraphPad version 5.04 (GraphPad software, La Jolla, CA, USA) and Origin 9.1.0 (OriginLab Corporation, Northampton, MA. USA). Comparisons among groups were performed by one-way analysis of variance (ANOVA). Significance was retained when p < 0.05.Results and discussion
Preparation, biophysical and biochemical characterization of polyplexes
It is a matter of fact that the transfection performance of every cationic polymer is largely dependent on the N/P.4,19 We thus evaluated by fluorophore-exclusion assay the ability of four different sets of gene delivery vectors differing in Mw to complex and compact the nucleic acids as a function of the N/P (Fig. 1). Complexation experiments were first carried out evaluating the fluorescence of polyplexes in 10 mM HEPES in the presence of SYBR Green I. By plotting the fluorescence intensity vs. N/P, typical roughly sigmoidal-shaped curves were drawn for all the polymers tested.9 The maximum complexation of nucleic acids was found when the residual fluorescence of the probe, indicating uncomplexed or loosely condensed DNA, was the lowest.20 Indeed, SYBR Green I undergoes enhancement of the fluorescence intensity in going from free dye to intercalated in double-stranded DNA (dsDNA), while in fully complexed polyplexes the DNA is no longer accessible to the probe.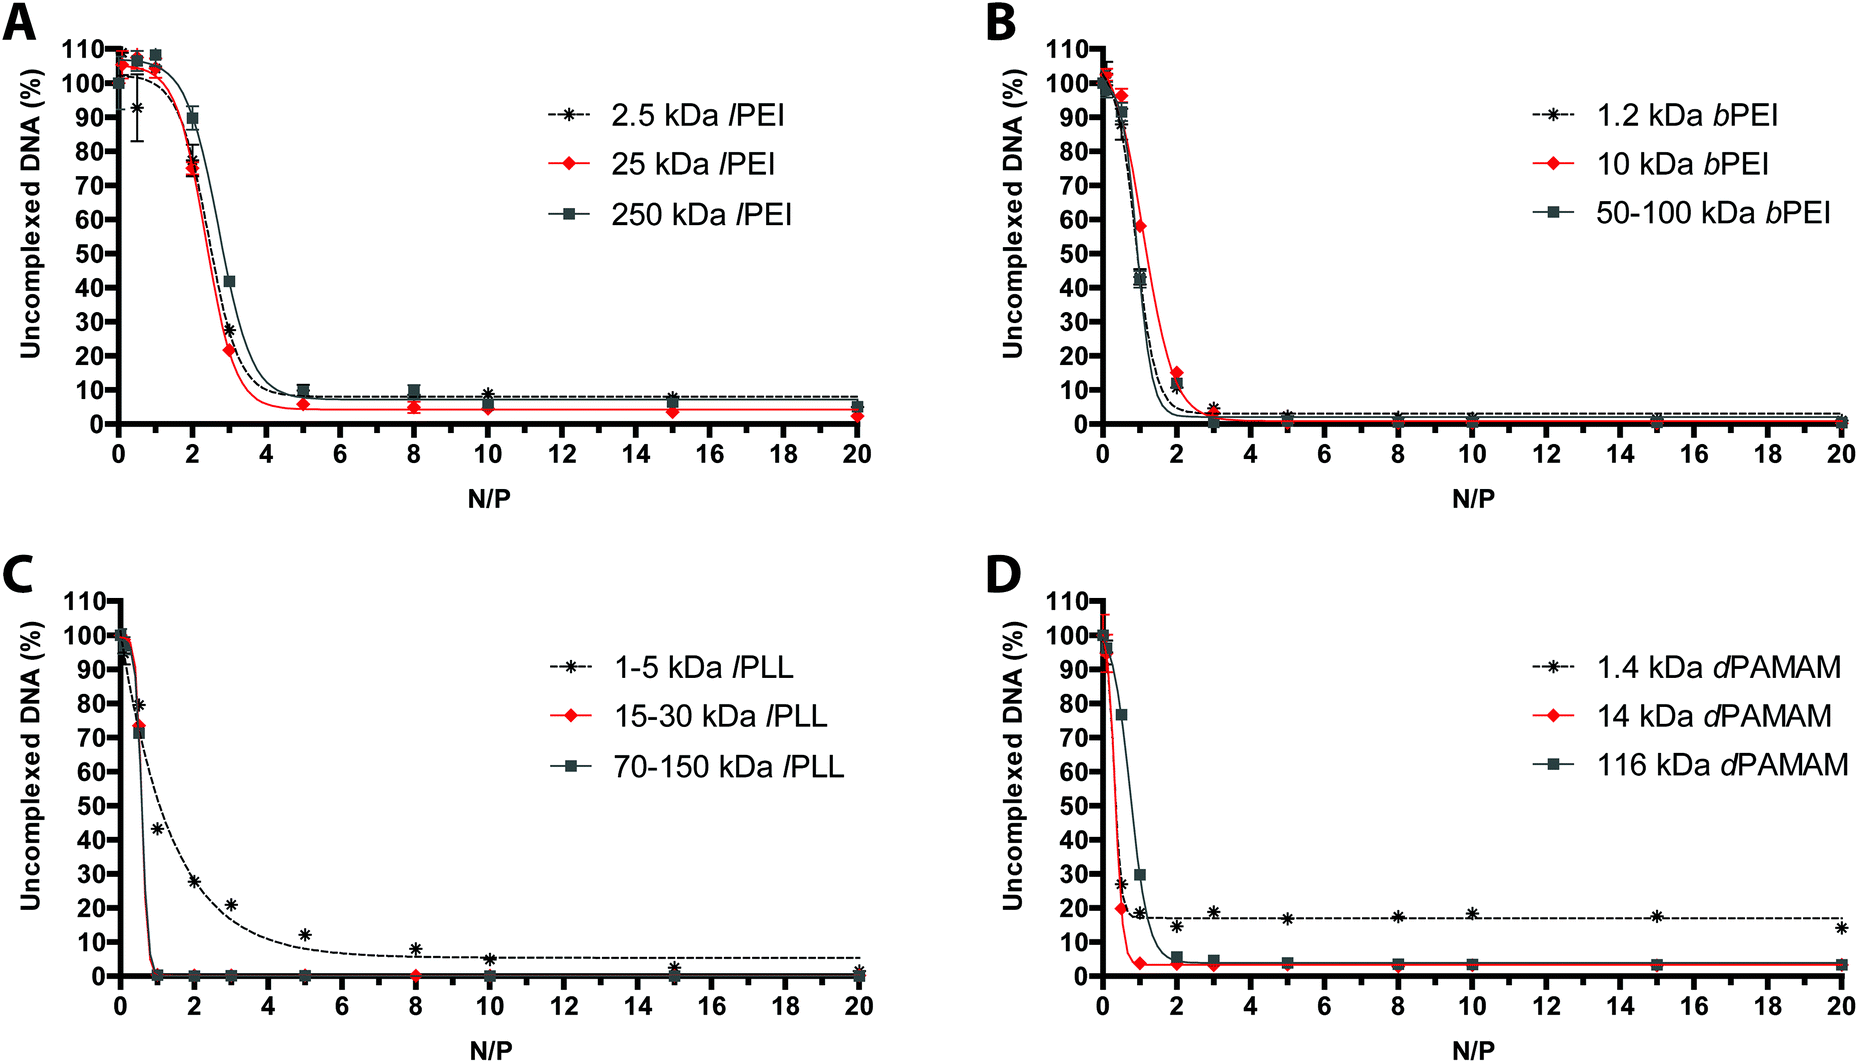 | ||
| Fig. 1 DNA complexation abilities of cationic polymers differing in their Mw. Comparative DNA complexation ability of (A) lPEIs, (B) bPEIs, (C) lPLLs, and (D) dPAMAMs in 10 mM HEPES buffer, evaluated by monitoring the fluorochrome displacement from the DNA as a function of nitrogen (N) to pDNA phosphate (P) ratio (N/P). Results are expressed as mean ± standard deviation (n ≥ 3). | ||
Consistent with some previous reports,21,22 lPEIs (Fig. 1A) and bPEIs (Fig. 1B) were found to be very effective in complexing the DNA at N/P ≥ 5 and 3, respectively, irrespective of the range of Mw considered in this study. The lPLLs ranging from 15–30 kDa and 70–150 kDa instead displayed optimal DNA complexation at N/P ≥ 1 whereas the titration curve of the smallest Mw polypeptidic transfectant (1–5 kDa) displayed a typical dose–response shape, but with maximal fluorescence quenching at N/P ≥ 10 (Fig. 1C), probably because a significant number of lPLL chains are likely too short to condense the DNA and displace SYBR Green I.9 Some differences in complexation behavior were also observed between the various dPAMAMs. Interestingly, 1.4 kDa (G1) and 14 kDa (G4) dPAMAMs displayed similar profiles, with the lowest signal obtained at N/P ≥ 1. Of note, the residual fluorescence of the 1.4 kDa dPAMAM polyplexes at their own optimal complexation was ca. 20%, and this could rely on the less tight binding to DNA owing to the lower surface charge density of the low-generation dendrimer.23 Instead, 116 kDa (G7) dPAMAM reached complete complexation at N/P ≥ 2 (Fig. 1D). However, as the ability of polymers to complex and shield the DNA are not always mirrored by equal effectiveness in transfection,24 we challenged HeLa cells with each kind of polyplex at different N/Ps. It is furthermore worth noting that many gene delivery vectors have proven very effective in transfection in the absence of serum but their activity was partially or completely blunted in media containing as low as 5–10% FBS,12,16,25–27 namely the conditions for mid- to long-term maintenance of mammalian cells in vitro. We thus decided to carry out the first round of transfection experiments in complete medium, over 24 h, with polyplexes prepared in 10 mM HEPES buffer (pH 7.0) (Fig. 2). As expected, we found that the Mw of cationic polymers does play a major role in affecting their activities.14 For each class of polymer we thus determined the most effective Mw and N/P in transfection, namely the highest transfection efficiency and acceptable cytotoxicity, that were 25 kDa at N/P 40 for lPEI (Fig. 2A), 50–100 kDa at N/P 30 for bPEI (Fig. 2C), 15–30 kDa at N/P 3 for lPLL (Fig. 2E) and 14 kDa at N/P 3 for dPAMAM (Fig. 2G). Of note, a mid-to-large excess of polymers (i.e. of cations) is needed to ensure suitable transfection levels, if compared to lower N/Ps accounting for maximum complexation. Moreover, it is worth to point out that the cytotoxicity of any polymer tested was at most of the order of 25%.
 | ||
| Fig. 2 Transfection efficiency and cytotoxicity of cationic polymers differing in their MW. (A, C, E, G) Transfection efficiency and (B, D, F, H) cytotoxicity of (A, B) lPEIs, (C, D) bPEIs, (E, F) lPLLs, and (G, H) dPAMAMs polyplexes prepared with pGL3 in 10 mM HEPES buffer at different N/P and evaluated after incubation for 24 h in 10% FBS. Transfection efficiency was expressed as relative luminescence units normalized over the total protein content in cell lysate while cytotoxicity was expressed as toxicity percent relative to untreated control cells. Results are expressed as mean ± standard deviation (n ≥ 4). | ||
Since the surface charge and size of any gene delivery particle are seen as prominent factors in determining its effectiveness,28 we evaluated the physicochemical properties of each polyplex in its most effective condition of use. Although it is commonly accepted that a positive ζP is imperative for effective cell binding and uptake because of the presence of anionic proteoglycans on the cell membrane,29 the desirable dimension of complexes for maximum transfection levels is still debated and possible explanations to that ensue from two distinct and opposing theories implying different scenarios. On one hand, (i) tiny particles would be more easily taken up by cells, on the other hand others proposed that (ii) the larger the polyplexes the quicker their precipitation onto cells in vitro, thus enhancing cellular binding and internalization.19,30
On these premises, we have examined the average DH and the ζP of polyplexes in 10 mM HEPES buffer (pH 7.0) as a function of the Mw of the polymers, each assayed at its own optimal N/P.
As shown in Fig. 3, irrespective of the Mw, lPEIs and bPEIs did effectively shield the DNA within nanoscaled particles very similar in size and charge (DH ∼ 101/129 nm; ζP ∼ +28/+34 mV). Instead, low Mw (LMw) lPLL and dPAMAM polyplexes displayed higher DH and lower ζP than their respective high Mw (HMw) counterparts. This unique behavior would be ascribed to the significantly impaired complexation ability of such polymers, as also shown in fluorophore-exclusion experiments (Fig. 1C and D). Likewise, Wu and colleagues recently reported very similar results for low generation dPAMAMs, supporting the idea that the surface density charge, that for branched polymers is a function of the Mw, does play a role in modulating the affinity between the polymers and the DNA.31 The behavior of polymer/DNA complexes also depends on the composition of the buffer utilized for preparing them and the cell culture medium used throughout the delivery step to cells.13 Indeed, being the coverage of the DNA by the polycations driven by electrostatic attractions, the ionic strength (and also the pH) of buffer in which such complexation takes place could presumably affect the biophysical traits of such particles. To draw firm conclusions on these issues, we first evaluated the complexation ability and the transfection activity of polyplexes prepared in different buffers selected amongst the most commonly used for polyplex preparation, namely 10 mM HEPES buffer, 150 mM NaCl and serum-free DMEM all used at pH 7.0–7.411,14,32 and the transfectants tested were the most effective polymers from each class, i.e. 25 kDa lPEI, 50–100 kDa bPEI, 15–30 kDa lPLL and 14 kDa dPAMAM.
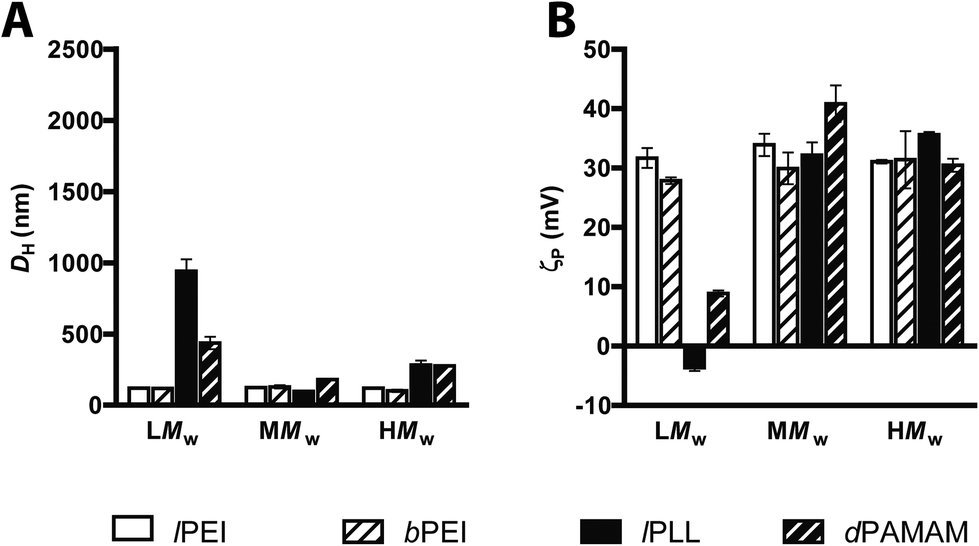 | ||
| Fig. 3 Size and surface charge of polyplexs made of cationic polymes differing in their MW. (A) Average hydrodynamic diameters (DH) and (B) ζ-potentials (ζP) of lPEIs, bPEIs, lPLLs, and dPAMAMs polyplexes in 10 mM HEPES buffer (pH 7.0), each at its own optimum N/P. Low (LMW), medium (MMW) and high MW (HMW) polymers were tested. Results are expressed as mean ± standard deviation (n ≥ 4). | ||
As expected, we found that the overall extent of SYBR Green I displacement from the DNA induced by each polymer varied as a function of the composition of the media used. It is worth noting that, for the binding of polymers to nucleic acids, 10 mM HEPES buffer always turned out to be the most suited to this purpose, whereas DMEM was by far the least effective buffer (Fig. 4).
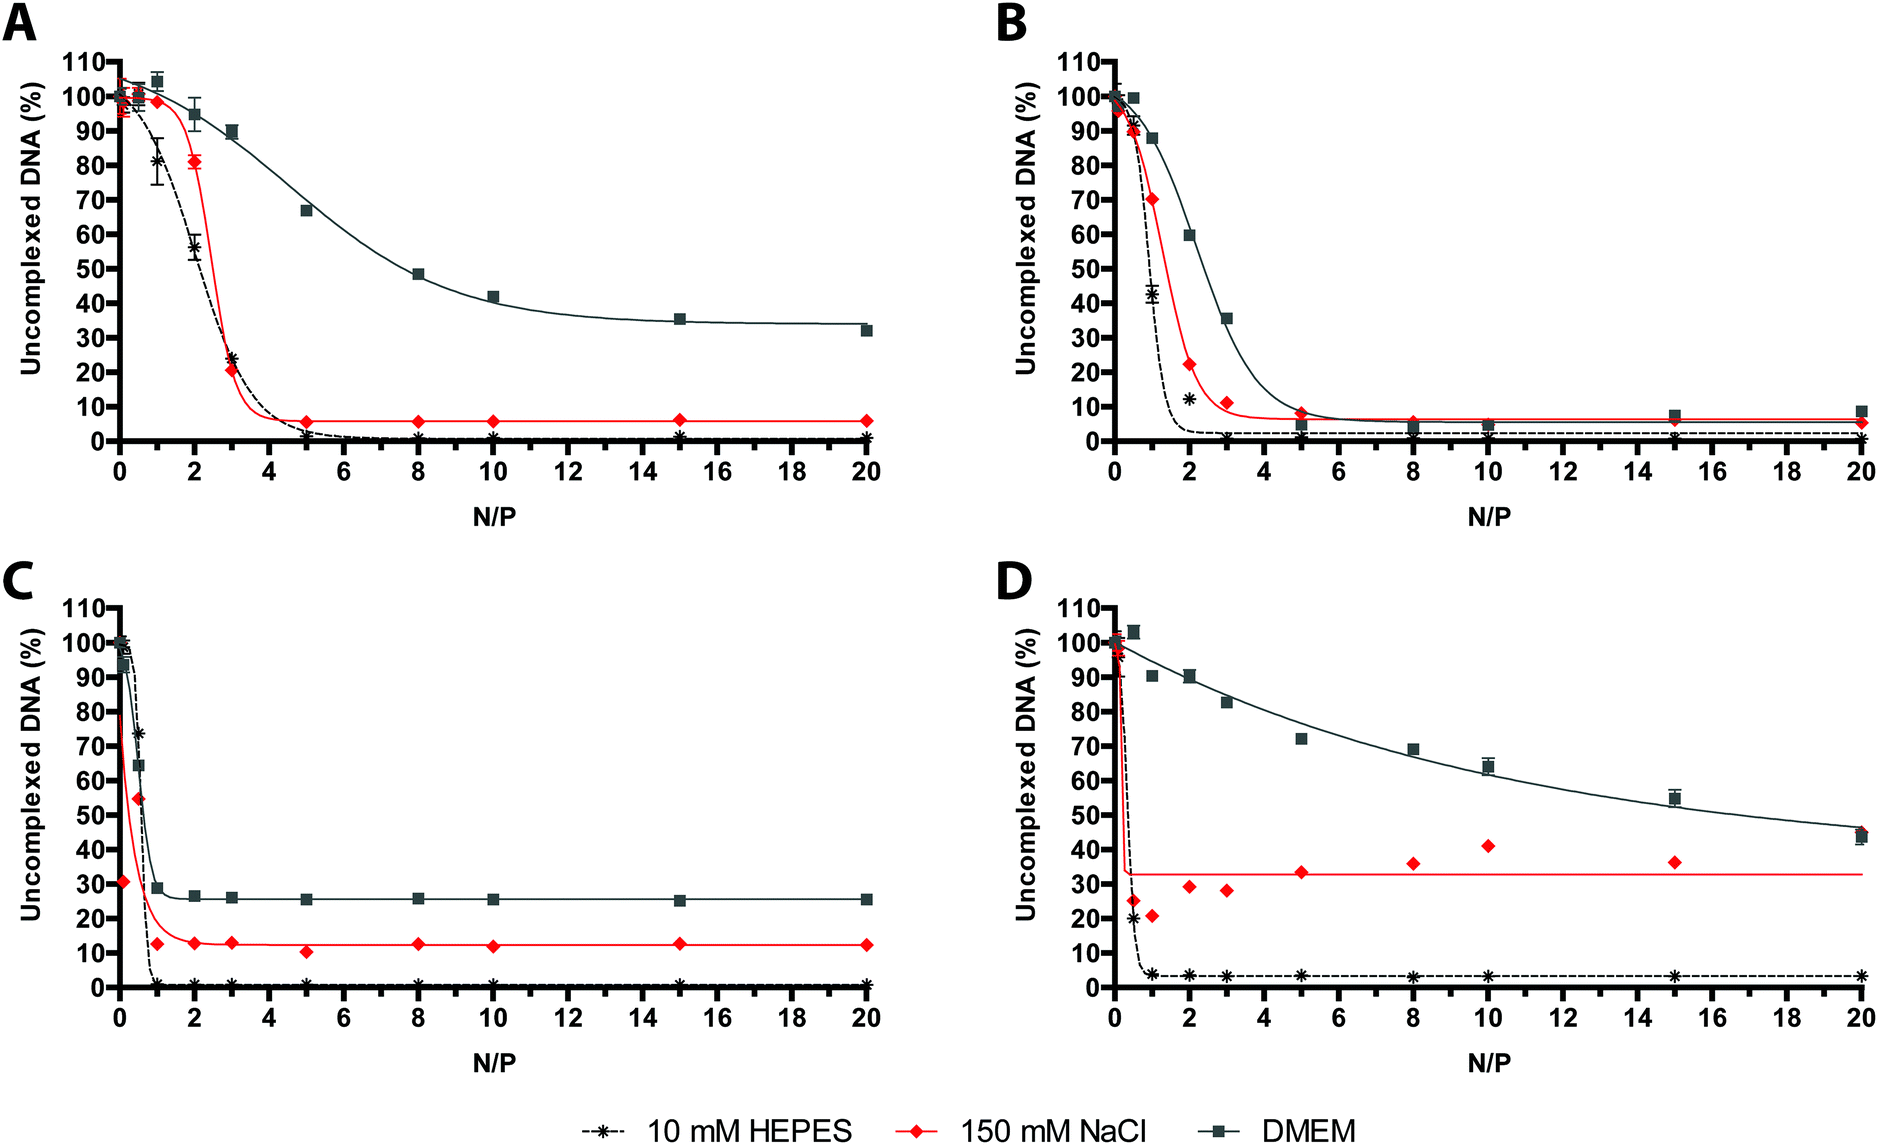 | ||
| Fig. 4 DNA complexation abilities of cationic polymers in different complexation media. Comparative DNA complexation ability of (A) 25 kDa lPEI, (B) 50–100 kDa bPEI, (C) 15–30 kDa lPLL, and (D) 14 kDa dPAMAM, evaluated in 10 mM HEPES buffer, 150 mM NaCl, and serum-free DMEM, by monitoring the fluorochrome displacement from DNA as a function of N/P. Results are expressed as mean ± standard deviation (n ≥ 3). | ||
D H and ζP measurements agreed well with the aforementioned buffer-dependence in DNA binding affinity observed for every cationic polymer (Fig. 5). Polyplexes obtained in 10 mM HEPES displayed the smallest size and the highest positive surface charge.
 | ||
| Fig. 5 Size and surface charge of cationic polymer-based polyplexes complexed in different buffers. (A) Average hydrodynamic diameters (DH) and (B) ζ-potentials (ζP) of 25 kDa lPEI, 50–100 kDa bPEI, 15–30 kDa lPLL, and 14 kDa dPAMAM polyplexes prepared in 10 mM HEPES buffer, 150 mM NaCl, and serum-free DMEM, each at its own optimum N/P. Results are expressed as mean ± standard deviation (n ≥ 4). | ||
Interestingly, all but one kind of polyplex made of 50–100 kDa bPEI, did have significantly larger DH when prepared in 150 mM NaCl and serum-free DMEM. These results are consistent with previous experimental work.13,30,33 Concerning the transfection properties (Fig. 6), the transfection efficiencies of polyplexes prepared in 10 mM HEPES and always delivered in complete medium were equal-to-higher than those carried out in other media, except for 25 kDa lPEI polyplexes that did exhibit significantly greater activity when prepared in 150 mM NaCl, as previously described also by others.5 Instead, the cytotoxicity was basically not affected by the buffer used for complexation but progressively increased with the rise in N/P.
 | ||
| Fig. 6 Transfection efficiency and cytotoxicity in complete medium of cationic polymer-based polyplexes complexed in different buffers. (A, C, E, G) Transfection efficiency and (B, D, F, H) cytotoxicity of (A, B) 25 kDa lPEI, (C, D) 50–100 kDa bPEI, (E, F) 15–30 kDa lPLL, and (G, H) 14 kDa dPAMAM, complexed with pGL3 at different N/Ps in 10 mM HEPES buffer, 150 mM NaCl, and serum-free DMEM and evaluated after incubation for 24 h in 10% FBS. Results are expressed as mean ± standard deviation (n ≥ 4). | ||
Overall, the transfection profiles of each cationic polymer as a function of the N/P differed from all the others, making it impossible to set a unique optimum N/P in common by everyone. Specifically, we selected the following conditions: N/P 40 in 150 mM NaCl for 25 kDa lPEI, N/P 30 in 10 mM HEPES for 50–100 kDa bPEI, N/P 3 in 10 mM HEPES for 15–30 kDa lPLL and N/P 3 in 10 mM HEPES for 14 kDa dPAMAM. Of note, as lPEI tested in the conditions reported hereinabove was by far the most effective transfectant and this superior performance was obtained following the strong increase in polyplex dimensions due to complexation in 150 mM NaCl, we can speculate that this is an experimental evidence for the close direct relationship existing between particle size and transfection efficiency of lPEI-based polyplexes.19 Of note, such behavior was unique to lPEI. In addition, we compared the activity of the selected polymers in the presence and in the absence of serum (Fig. 6 and S1†). Even though serum has sometimes been reported to adversely impact transgene expression,34,35 in our experimental conditions polyplexes were generally more effective when transfections were carried out in complete medium.12 Conversely, for three out of four polymers, no such a difference in cytotoxicity was observed between transfections carried out in 10% FBS and serum-free conditions. Indeed, only 14 kDa dPAMAM polyplexes were significantly more cytotoxic when delivered in the absence of serum in cell culture medium.
Any transfection conditions specifically optimized so far for each polymer have been kept constant in the following experiments, while the other parameters were varied one at a time and the effect on transfection evaluated experimentally.
Aiming to determine physical characteristics and morphology, each kind of polyplex at its optimal conditions of use was also characterized by AFM (Fig. S2†). As observed by others,36–38 AFM images showed compacted and nano- to microsized structures with heterogeneous morphologies for all the transfectants. Moreover, the electrical mode of AFM (Kelvin probe force microscopy – KPFM), was used to evaluate the surface charge heterogeneity and to measure the local electrostatic surface potential.39 The KPFM images displayed isolated spots of higher surface potential with respect to the surrounding area. As expected, the mean surface potential of cationic polymer-based complexes was positive.
Evaluation of the transfection effectiveness as a function of the order of mixing of reagents and DNA
It is well known that polyplex formation is first driven by electrostatic interaction between the cationic groups of the polymer and the anionic phosphates of the DNA,40 but the final condensation process is entropically driven.2 Thus, the way of preparing polyplexes and the order of mixing the reagents may affect the formation, the physicochemical properties and the transfection efficiency of the resulting particles.32,41Most literature does not always chronicle in much detail the protocols used for complexation as well as there is poor knowledge about the possible effects on transfection of the order of mixing and some other crucial parameters. To ascertain the best complexation conditions, we evaluated transfection based on the effect of the order of mixing and the mixing volume ratio of the plasmid and the polycation solutions, keeping constant the final concentration of each ingredient and focusing on three different volume ratios for every order of mixing. As shown in Fig. 7A, bPEI polyplexes were sensitive to both the DNA/polymer volume ratio and the order of mixing of either component. Indeed, when the polyplexes were prepared by adding the transfectant to the DNA, the transfection efficiency increased by increasing the volume of the plasmid solution and decreasing that of the polymer solution at once, instead the DNA/polymer volume ratio 1:10 was revealed as the best condition for the vice versa scenario. Interestingly, our results at DNA/polymer volume ratio 1:1 are in accordance with those obtained by Boussif et al. who reported a 10-fold increase in transfection efficiency of polyplexes prepared by adding dropwise the bPEI solution to the DNA solution with respect to the inverse order of mixing.6 Instead, in the case of lPEI, lPLL and dPAMAM, only little difference was found from one complexation condition tested to the others.
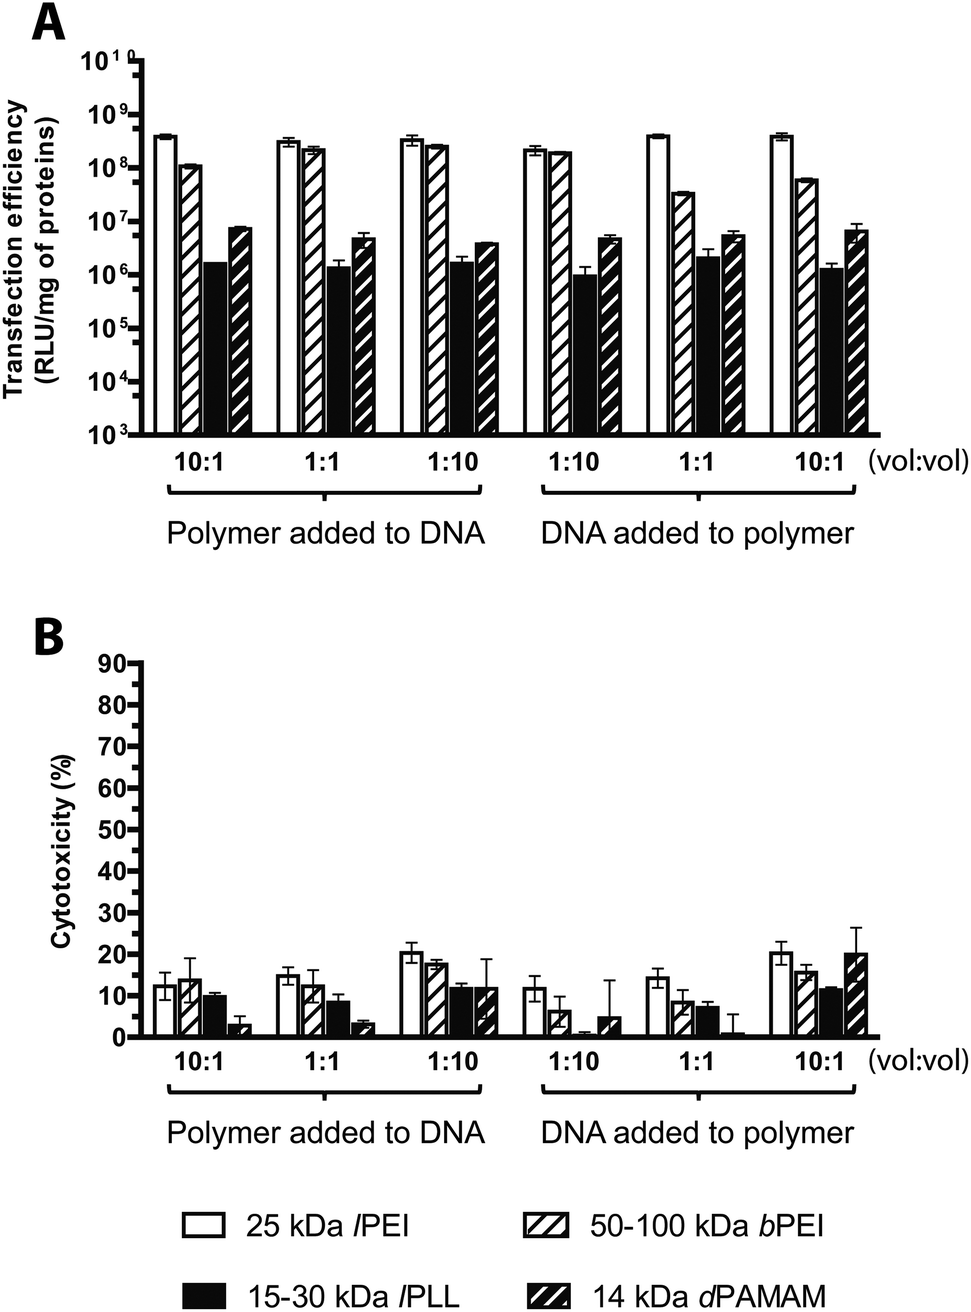 | ||
| Fig. 7 Transfection efficiency and cytotoxicity of cationic polymer-based polyplexes prepared in different conditions. (A) Transfection efficiency and (B) cytotoxicity of 25 kDa lPEI, 50–100 kDa bPEI, 15–30 kDa lPLL, and 14 kDa dPAMAM polyplexes prepared with pGL3, each at its own optimal transfection conditions, by varying the order of mixing (addition of the solution of polymer to pGL3 and addition of the solution of pGL3 to polymer) and the mixing volume ratio of plasmid and polymer solutions. vol:vol stoichiometries represent polymer:pDNA and pDNA:polymer respectively for polymer added to DNA and DNA added to polymer. Results are expressed as mean ± standard deviation (n ≥ 4). | ||
However, unlike bPEI, complexes prepared by adding the dPAMAM to the DNA were more effective when a 10-times excess of the polymer solution with respect to the DNA was used, while when polyplexes were prepared reversing the order of addition, the greatest transfection efficiency was obtained with the DNA/polymer volume ratio of 10:1.
It is important to note that the cytotoxicity was always low for all the experimental conditions tested (Fig. 7B). In conclusion, the results shown here above hint to prepare bPEI polyplexes by adding the polymer solution to the plasmid solution with a polymer/DNA volume ratio of 10:1; moreover, we can speculate that the application of our standard protocol used for preparing lPEI, lPLL and dPAMAM polyplexes (i.e. through the addition of the polymer to the plasmid in a polymer/DNA volume ratio of 10:1) is a very suitable way to obtain effective polyplexes.
Evaluation of the transfection effectiveness as a function of the transfection time
Plenty of gene delivery protocols warn to incubate the transfection reagents and cells for variable durations from 30 min up to 5 d and either replacing the transfection medium with a fresh aliquot or keeping it in contact with cells over the entire duration of the experiment.13 However, the evaluation of the optimal transfection time needed to obtain maximal transgene expression has been often neglected. We have evaluated the optimal incubation time by challenging HeLa (seeded at the density of 2.0 × 10⁴ cells per cm2, 24 h before transfection) with lPEI/, bPEI/, dPAMAM/ and lPLL/pGL3 complexes in complete medium, and without any supernatant replacement, for increasing time lapses up to 120 h.We pinpointed a set of durations during which cells were in the lag phase (within the first 4–8 h of incubation) and later on in the log phase (24–96 h of incubation); for longer incubation time (120 h) the stationary phase became apparent and cell growth was completely halted because of the confluency of cells (data not shown). Each transfectant was prepared at its own optimal N/P and complexation buffer, and delivered at a pDNA dose of 320 ng cm−2 and in a final transfection volume of 300 μL cm−2 to cells seeded in 96-well plates. For all but one of polymers tested, the transfection efficiency significantly increased over time to give the best possible transfection efficiencies at 24 h, and declined afterwards. dPAMAM/pDNA instead displayed a roughly constant efficiency within the observed timeframe (Fig. 8A). In general, little toxicity was observed all along the experiment. Forty-eight hours post-transfection only the cytotoxicity levels of lPEI and bPEI polyplexes were slightly higher than 20% (Fig. 8B). Very similar results have also been observed by Ruponen et al. on CV1 cells transfected with 25 kDa bPEI and lPLL,42 while other studies reported optimal efficiency for longer durations.14,30
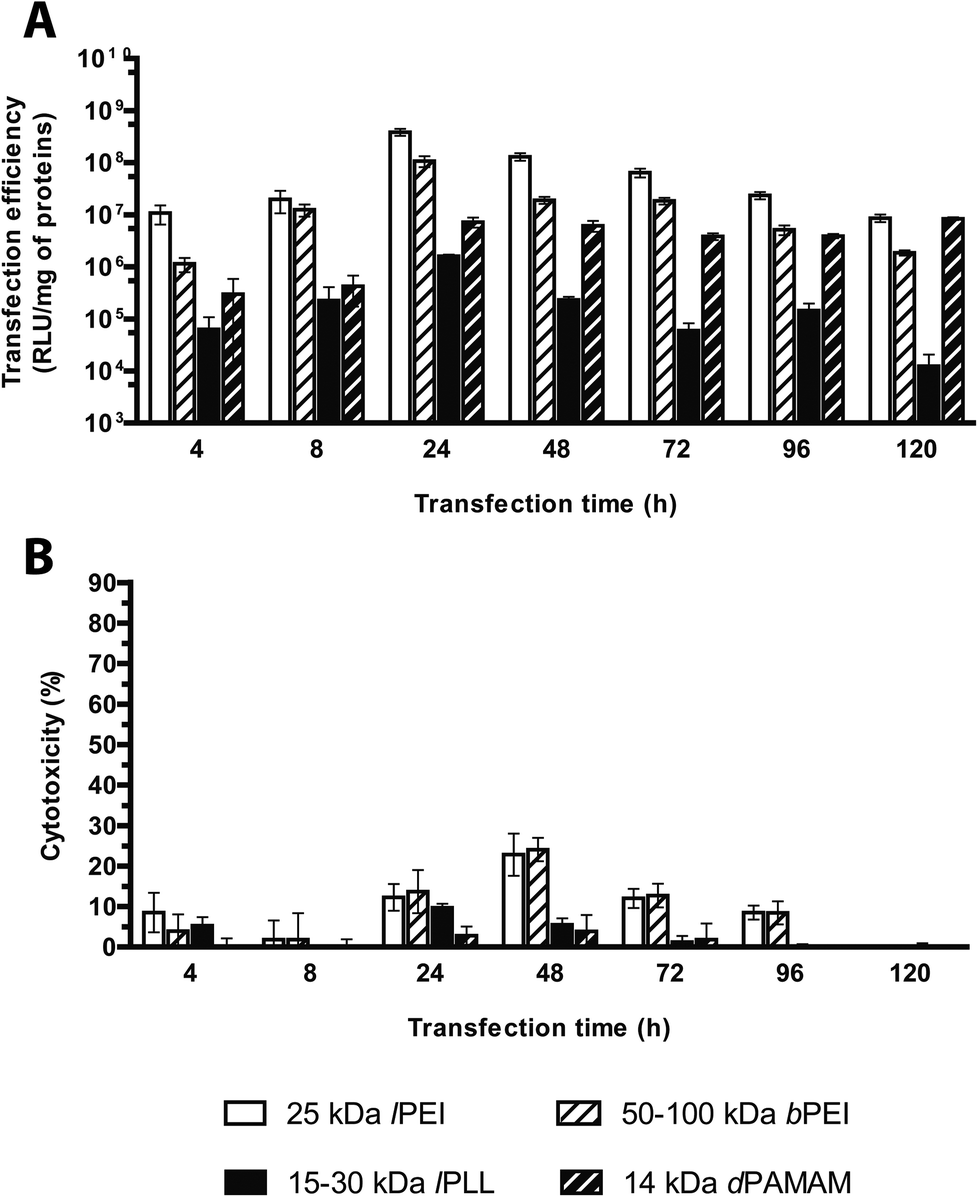 | ||
| Fig. 8 Transfection efficiency and cytotoxicity of cationic polymer-based polyplexes evaluated at varying incubation times. (A) Transfection efficiency and (B) cytotoxicity of 25 kDa lPEI, 50–100 kDa bPEI, 15–30 kDa lPLL, and 14 kDa dPAMAM polyplexes prepared with pGL3, each at its own optimal transfection conditions. Results are expressed as mean ± standard deviation (n ≥ 4). | ||
A hypothetical but attractive explanation could be that this parameter inherently depends on the cell type to be transfected.14,15,30,43 All in all, we found that the highest transfection efficiency in HeLa cells for each polyplex tested peaked at an incubation time of 24 h.
Evaluation of the transfection effectiveness as a function of the plasmid dose
The amount of DNA (and thus of polyplexes) to be delivered to cells is certainly pivotal when looking for the best possible transfection conditions.13 The literature generally agrees on the existence of a causal relationship between the transfection efficiency and the dose of pDNA utilized in transfection. Nonetheless, gene delivery experiments have been often carried out over a narrow range of concentrations and mostly neglected to assess the cytotoxicity at once.12,15,32 We thus evaluated the influence of the dose of pDNA delivered, over a very wide (nearly two-log) range of concentrations, on the transfection efficiency and the toxicity of the selected cationic polymers, each used at its own optimal N/P. Interestingly, in agreement with the results by Huh et al. about 25 kDa lPEI,5 in HeLa cells challenged with lPEI and bPEI polyplexes the transfection efficiency increased along with increasing the pDNA dose from 40 to 160 ng cm−2 (in 96-well format) and then abruptly declined beyond pDNA doses ≥640 ng cm−2 (Fig. 9A), probably owing to the prominent cytotoxic side effects. Indeed, the toxicity of polyplexes made by both PEIs monotonically increased along with the rise of pDNA dose, and consequently of polymer, added to cells (Fig. 9B). At the highest pDNA dose tested (2560 ng cm−2), the cytotoxicity reached levels ≥80% for both polymers while the luciferase expression of bPEI-transfected cells became barely detectable. These results point out the strong interdependence existing between such parameters. It is worthy of note that, by raising the dose of polyplexes delivered to cells, one can increase the transgene expression till prominent cytotoxic effects relieving transfection efficiency take place.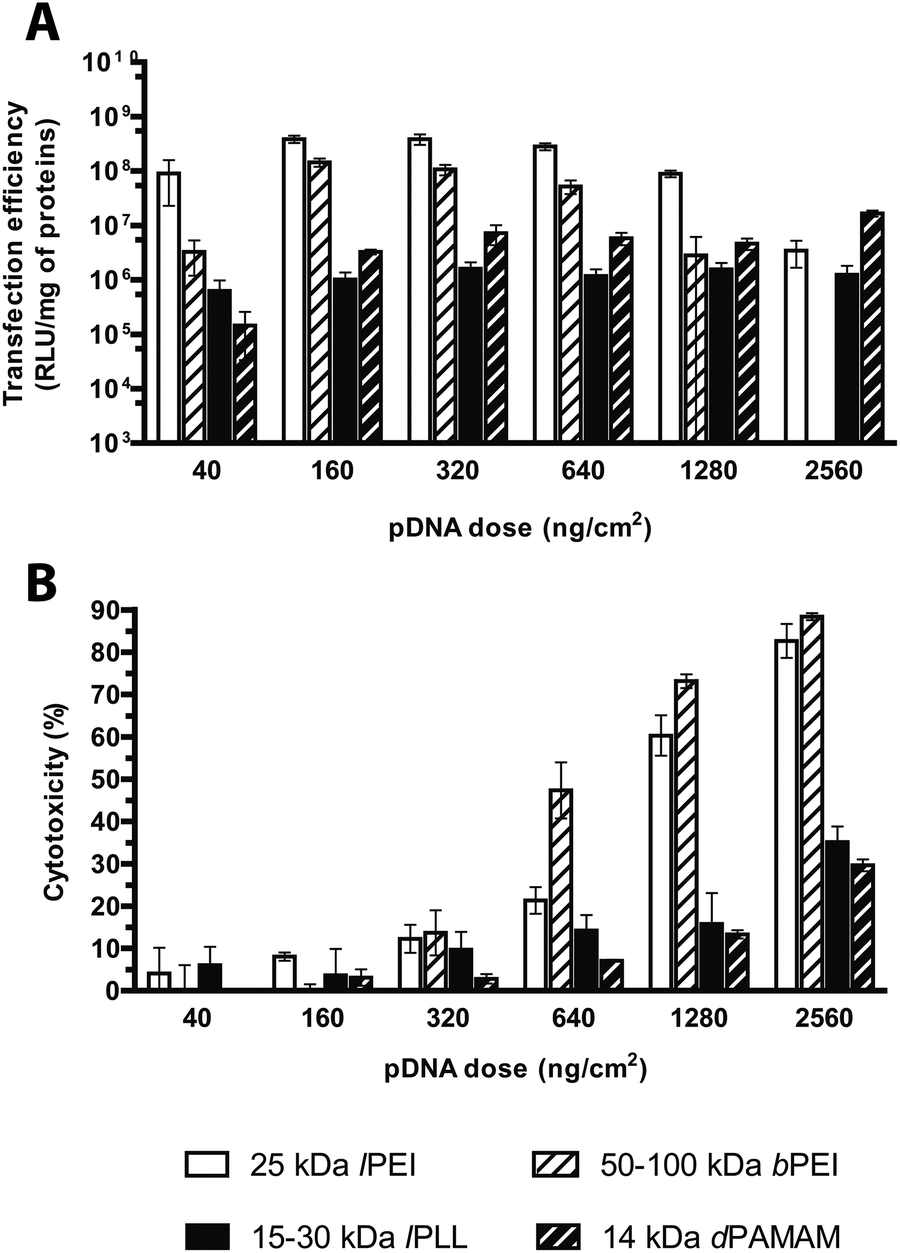 | ||
| Fig. 9 Transfection efficiency and cytotoxicity of cationic polymer-based polyplexes prepared with different plasmid doses. (A) Transfection efficiency and (B) cytotoxicity of 25 kDa lPEI, 50–100 kDa bPEI, 15–30 kDa lPLL, and 14 kDa dPAMAM polyplexes prepared with pGL3, each at its own optimum transfection conditions, by varying the plasmid dose delivered to cells. Results are expressed as mean ± standard deviation (n ≥ 4). | ||
The transfection efficiencies of lPLL and dPAMAM polyplexes were greater for the pDNA dose of 320 ng cm−2 and substantially plateaued afterwards, although they never reached the high levels of transfection effectiveness and cytotoxicity (35 and 30% respectively at the maximal dose, Fig. 9B) as for any PEI.
In light of these results, we can speculate that the most effective pDNA dose is by far within the range of 160–320 ng cm−2 for lPEI- and bPEI polyplexes, while for both the other polymers a plasmid dose of 320 ng cm−2 is the most efficient.
Evaluation of the transfection effectiveness as a function of the cell seeding density
A few experimental evidences have outlined that the transfection behavior of gene delivery systems is related to some extent to the degree of cell confluence, defined as the density of cells per seeding area and generally expressed as percentage of the well surface covered by cells. Nevertheless, it is widely accepted that the cell doubling time and the cell health are other pivotal factors affecting in some way the outcome of transfection. Indeed, as very low cell confluency has been associated with the lengthening of the cell cycle, which is causally related to severe cytotoxicity after transfection, likewise, full cell confluence induces cell cycle arrest and severe reduction of transgene expression.13 In line with that, several studies have pointed out that 70–90% confluency leads to maximal transfection efficiency.13,32,44In our standard transfection protocol, cells were seeded at the density of 2 × 10⁴ cells per cm2, to reach 60–70% confluency at the time of transfection. Hereinafter we coped with the influence of the cell seeding density ranging from 0.25 × 10⁴ to 6.0 × 10⁴ cells per cm2 on the transfection performances of cationic polymers. Twenty-four hours after seeding, we observed a linear correlation between the cell seeding densities and the viability of untreated cells only in the range 0.5 × 10⁴–4.0 × 10⁴ cells per cm2, while for lower and higher cell seeding densities, the cell cultures were either severely underconfluent or overconfluent, respectively (data not shown). As expected, irrespective of the kind of polymer tested, a general decrease in transfection efficiency was observed when the cell seeding density was raised (Fig. 10A); specifically, lPEI and bPEI complexes exhibited a limited reduction of ca. 4-fold while lPLL and dPAMAM displayed a severe 20- and 40-fold drop in transfection efficiency, respectively, highlighting the greatest susceptibility of these polymers to the cell seeding density. Since the dose of polyplexes was kept constant in these experiments, these results implied an obvious decrease in the ratio of complexes available per cell45 as cell density was raised. Besides, the tighter the cells, the lower the toxic side effects of transfection (Fig. 10B), though no relevant cytotoxicity was observed. In light of these results, the most effective seeding densities when transfecting with any polymer were between 0.5 × 10⁴ and 2.0 × 10⁴ cells per cm2.
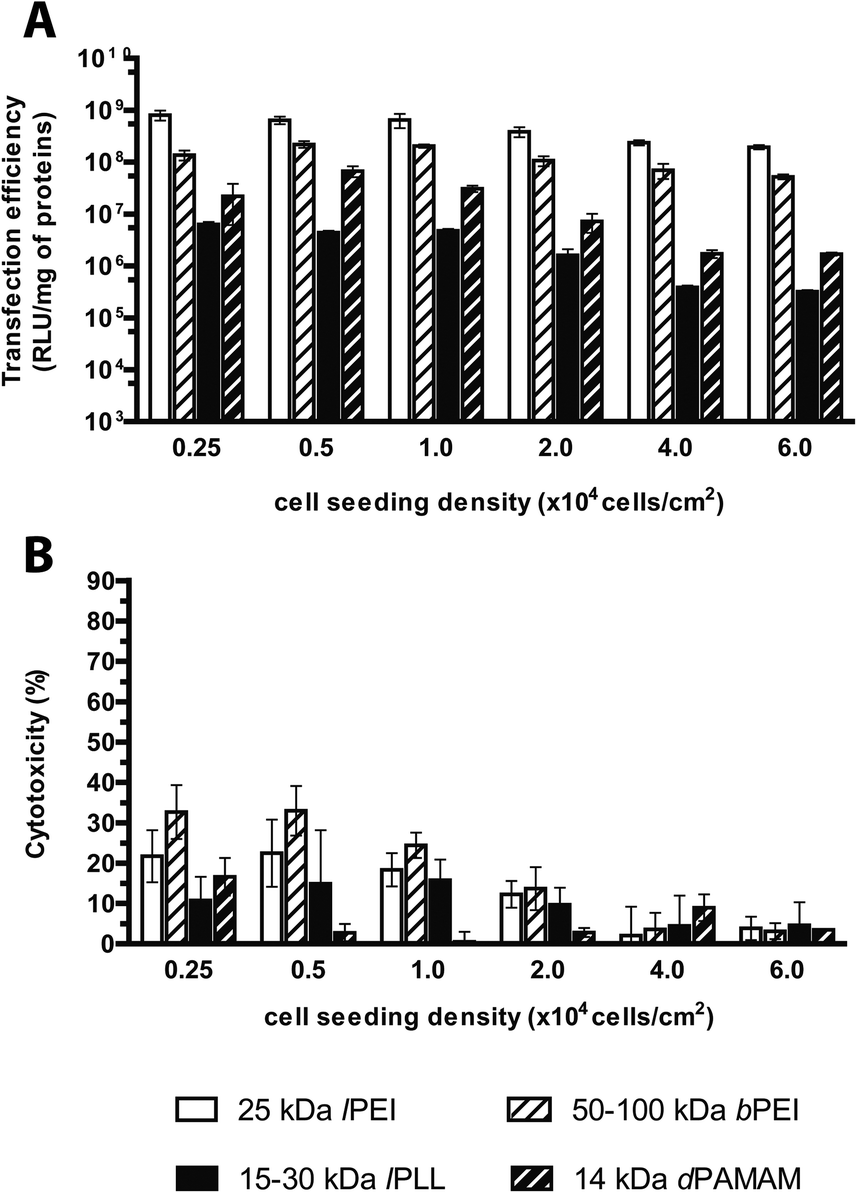 | ||
| Fig. 10 Transfection efficiency and cytotoxicity of cationic polymer-based polyplexes delivered to cells at different seeding densities. (A) Transfection efficiency and (B) cytotoxicity of 25 kDa lPEI, 50–100 kDa bPEI, 15–30 kDa lPLL, and 14 kDa dPAMAM polyplexes prepared with pGL3, each at its own optimum transfection conditions, by varying the cell seeding density. Results are expressed as mean ± standard deviation (n ≥ 4). | ||
Interestingly, the normalization of the dose of polyplexes delivered with respect to the number of seeded cells, allowed these results to be compared with those obtained varying the plasmid dose (Fig. S3†).
For lPEI and bPEI, it was apparent that the transfection process in general, and especially the cytotoxicity, was much more prone to variation due to an increase in the total DNA dose rather than when the number of cells seeded was dropped (Fig. S3A–D†). Taken altogether, these results outlined the importance of the concentration of polyplexes in the cell culture medium in ruling the gene delivery effectiveness. Grounded on these very interesting results, we wondered whether some variations in the volume of the transfection medium while keeping constant the amount of polyplexes delivered could exert the same effect as herein above described.
Evaluation of the transfection effectiveness as a function of the volume of the transfection medium
Among the large variety of experimental conditions described in the literature, to the best of our knowledge, a comprehensive study examining the influence of the transfection medium volume on the transfection effectiveness of commercially sourced cationic polymers has not been reported thus far.On this premise, we set out to determine the effect of varying the transfection medium volume in the range of 150–900 μL cm−2 (i.e. from 50 to 300 μL per well in 96-well plates) on the performances of any cationic polymer herein discussed. First, we observed no significant differences amongst the viability of untreated cells measured 24 h after seeding (data not shown). Increasing progressively the amount of transfection medium, lPEI and dPAMAM polyplexes displayed a 2- to 2.5-fold reduction in transfection efficiency, respectively, while lPLL was insensitive to any variation of the volume of medium during transfection (Fig. 11A). In stark contrast, the luciferase expression induced by bPEI polyplexes increased linearly (r2 ∼ 0.995) when the transfection medium was raised from 150 μL to 450 μL cm−2 and markedly decreased afterwards. Interestingly, the cytotoxicity of any polymer tested significantly decreased by increasing the volume of transfection medium (Fig. 11B).
 | ||
| Fig. 11 Transfection efficiency and cytotoxicity of cationic polymer-based polyplexes delivered in different volumes of transfection medium. (A) Transfection efficiency and (B) cytotoxicity of 25 kDa lPEI, 50–100 kDa bPEI, 15–30 kDa lPLL, and 14 kDa dPAMAM polyplexes prepared with pGL3, each at its own optimum transfection conditions, by varying the volume of transfection medium. Results are expressed as mean ± standard deviation (n ≥ 4). | ||
Besides, by plotting the plasmid concentration against the transfection efficiency and cytotoxicity (Fig. S4†), the curves obtained by varying the pDNA doses were substantially superimposable to those as a function of the transfection volumes, thus highlighting again that the concentration of polyplexes during transfection plays a relevant role on their effectiveness, especially on the cytotoxicity.
In general, for all the polymers tested, the incubation of cells with a volume of transfection medium of 300–450 μL cm−2 leads to maximal levels of transfection combined with reduced cytotoxic effects.
Evaluation of the transfection effectiveness as a function of two or three parameters at once
In previous studies, the effect of the pDNA concentration on the outcomes of transfection was assessed by varying only one parameter at a time.5,6,12,13,15,30,32,46–48In order to provide for the very first time some thorough information about the effectiveness of non-viral gene delivery vectors tested in manifold conditions, we investigated the influence of the simultaneous variation of the pDNA dose, the cell seeding density and the volume of transfection medium on the transfection efficiency and cytotoxicity of lPEI and bPEI polyplexes. We selected these two polymers because they displayed very high transfection levels and strict dependence of their effectiveness on some external parameters. The transfection efficiency and the cytotoxic behavior can be best appreciated by looking at data on 3D plots, as reported in Fig. 12. For either cationic polymer, the cytotoxicity increased by augmenting the dose of polyplexes delivered and reducing the volume of transfection medium, reaching maximum levels in the upper corner of the 3D charts. As already pointed out above, in these conditions the transfection efficiency was thoroughly impaired. Interestingly, altogether these results shed light on the possibility of halting the cytotoxicity by increasing cell seeding density, although this intended effect was generally associated with a reduction of the transfection efficiency.
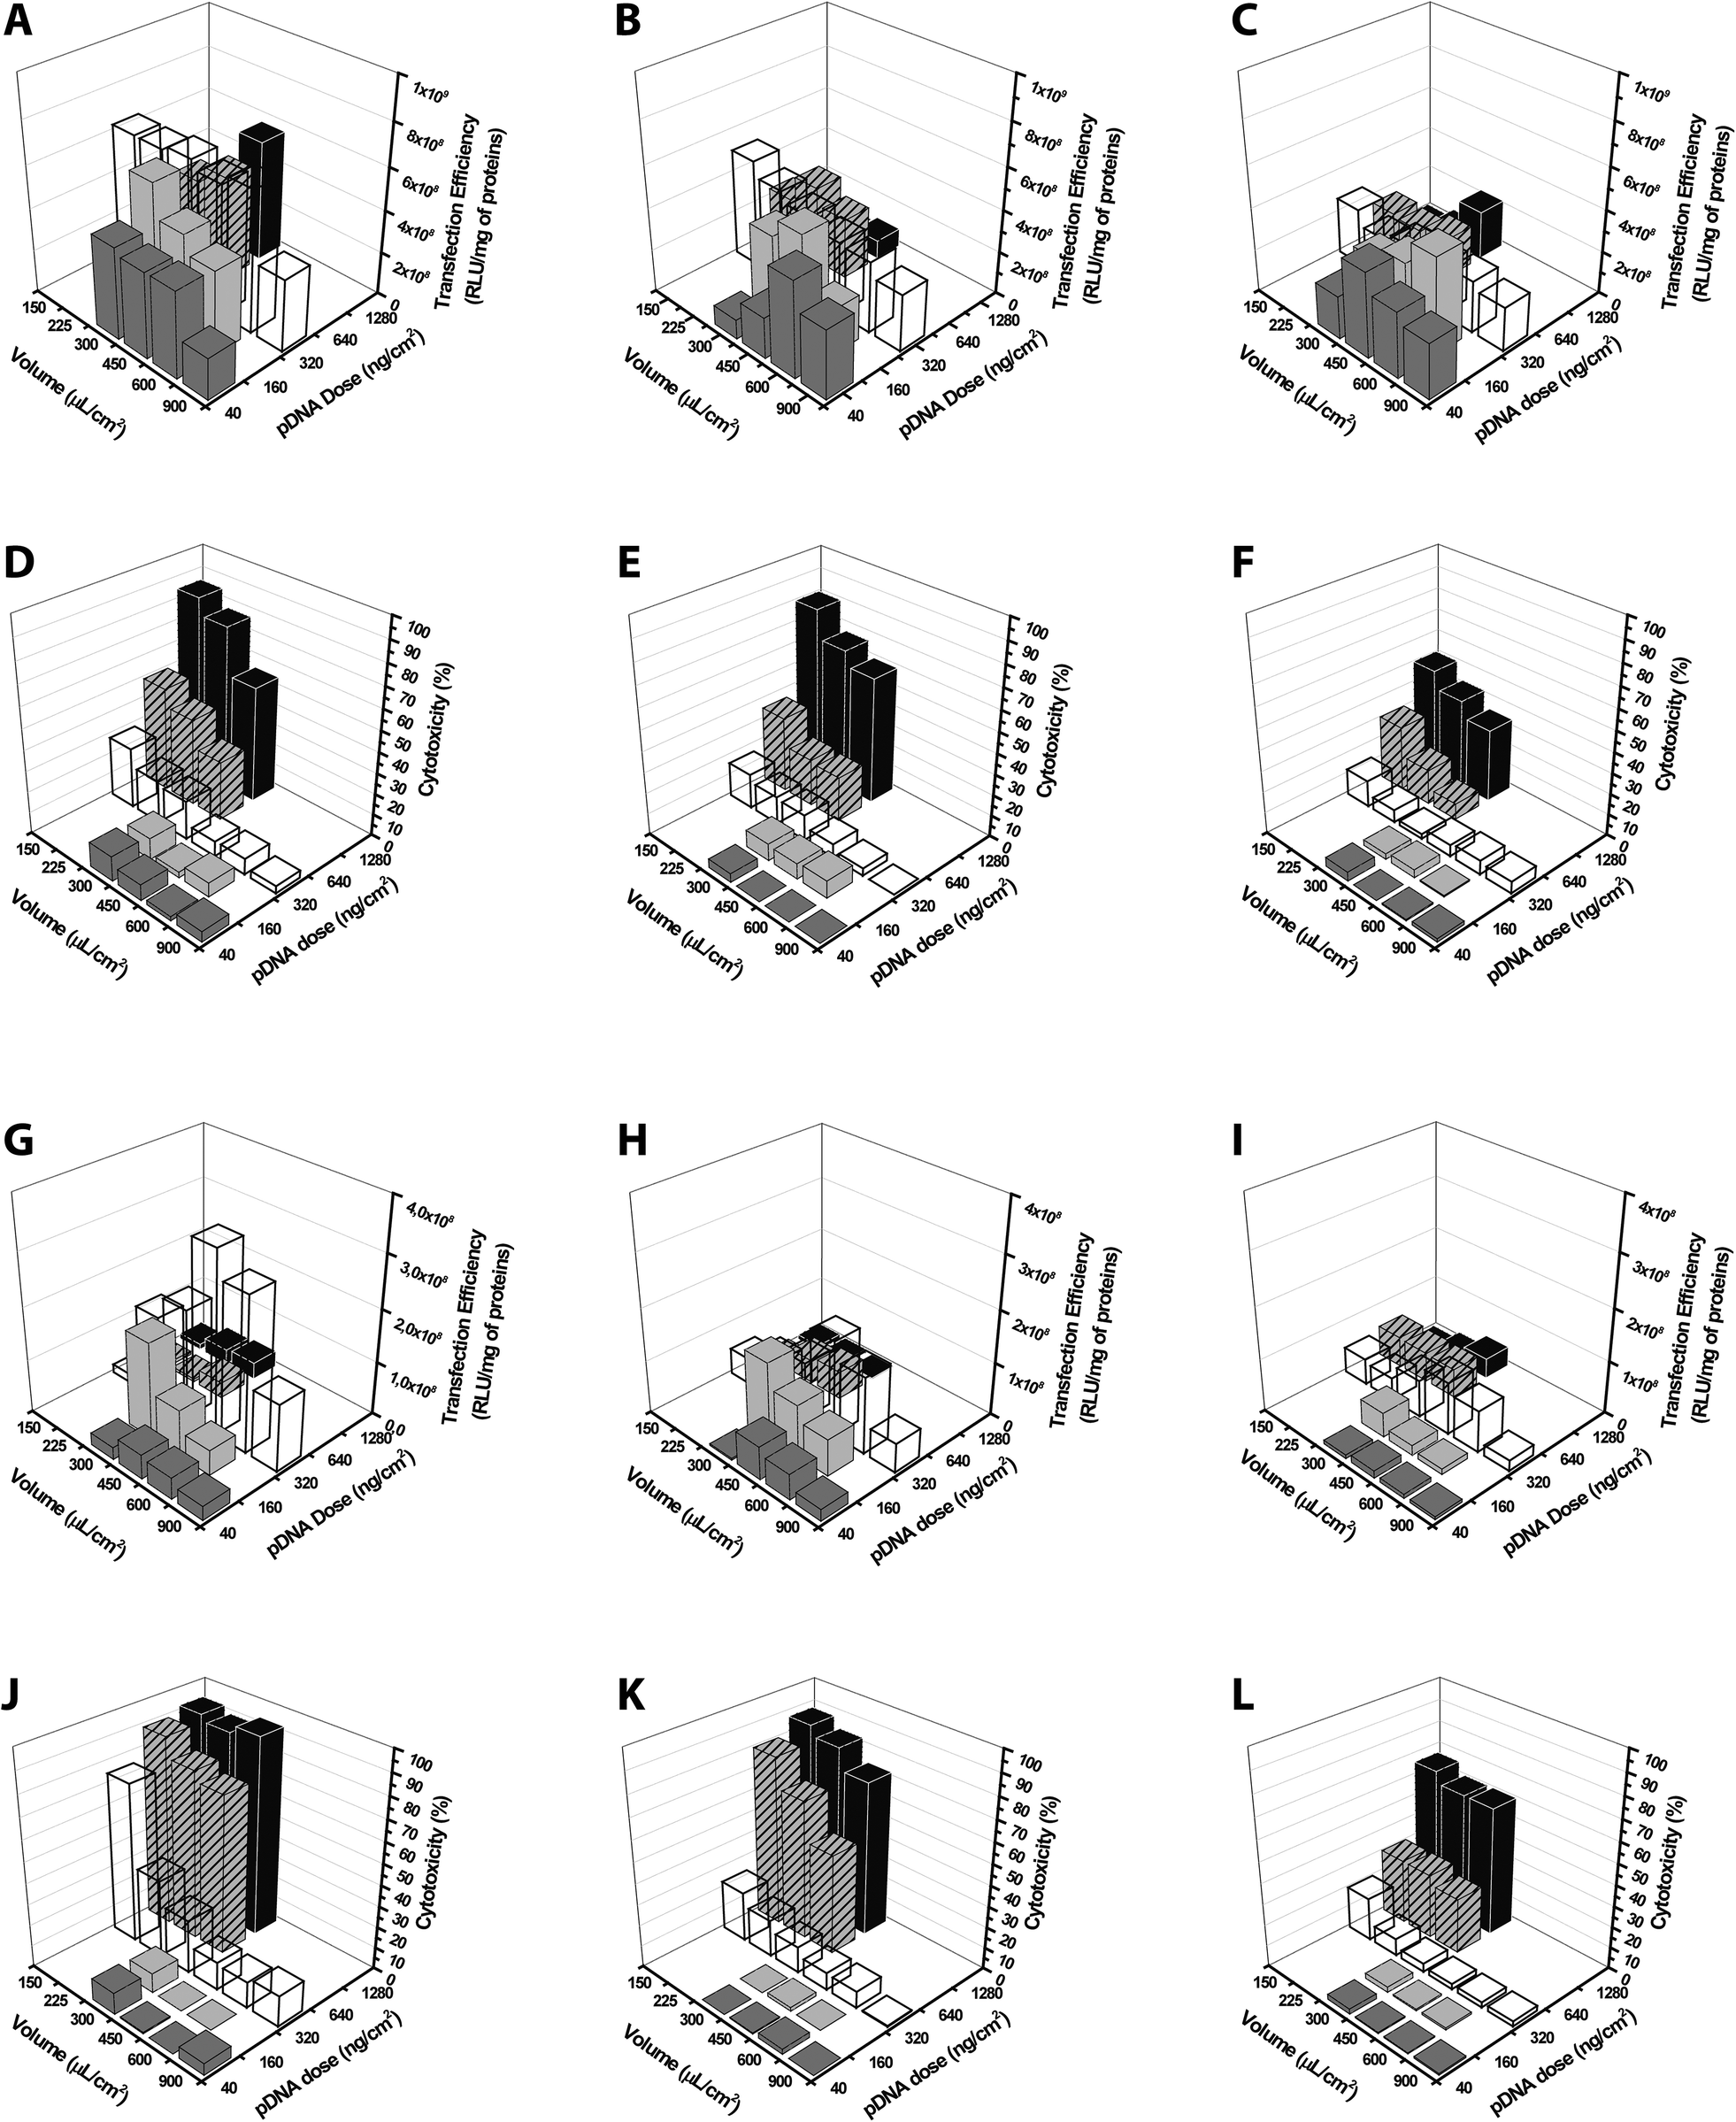 | ||
| Fig. 12 3D-plots of transfection efficiency and cytotoxicity of lPEI- and bPEI-based polyplexes obtained by varying three parameters at once. (A–C, G–I) Transfection efficiency and (D–F, J–L) cytotoxicity of (A–F) 25 kDa lPEI and (G–L) 50–100 kDa bPEI polyplexes prepared with pGL3, each at its own optimum transfection conditions, by varying the volume of transfection medium and the plasmid dose at once, with cell seeding densities equal to (A, D, G, J) 1.0 × 10⁴ cells per cm2, (B, E, H, K) 2.0 × 10⁴ cells per cm2, and (C, F, I, L) 4.0 × 10⁴ cells per cm2. | ||
In Fig. S5,† the transfection efficiency and the cytotoxicity are plotted against the concentration of plasmid that spanned over more than two orders of magnitude (from 0.044 to 8.533 ng of DNA per μL) and was obtained by varying the dose of polyplexes and the volume of medium during transfection. For every cell density tested and for both PEIs, the cytotoxicity was displayed in classical dose–response curves. The transfection efficiency was always severely reduced in correspondence of high cytotoxicity levels.
Noteworthy, regardless of the number of cells seeded, bPEI polyplexes were most effective at 320 ng of pDNA per cm2 and 450 μL of transfection medium per cm2, conditions corresponding to a pDNA concentration of 0.711 ng μL−1.
Overall, we thus found a range of settings accounting for superior transfection efficiency and limited cytotoxic effects that is placed in the middle-lower part of every 3D plot. In detail, the most effective conditions were (i) the quantity of the pDNA in the range of 160 and 320 ng cm−2; (ii) the volume of transfection medium between 225 and 600 μL cm−2 and (iii) the cell seeding density ≤2.0 × 10⁴ cells per cm2. Of note, the toxic effects of transfection may be curtailed to some extent by increasing the cell seeding density or the concentration of polyplexes in the culture medium.
Conclusions
Due to their many strengths, such as low immunogenicity, safety, versatility, ease of use and low cost, cationic polymers have been extensively investigated and widely used as non-viral vectors over the past two decades. Each of these macromolecules differs from each other by its chemical composition and Mw, as well as by typical architectural features. As a result, a wide variety of different polyplexes can be obtained by very simple mixing of the polycations with the DNA. However, the physicochemical and biochemical screening of gene delivery systems across laboratories is performed in disparate conditions, and following in-home protocols. Moreover, despite the large amount of reagents developed so far, information correlating the chemistry of the polymer, its DNA/RNA complexation ability, the transfection protocol used and the biological outcomes have been very poorly addressed so far in the literature.In this scenario, we performed a wide comparative survey of the most popular classes of polymeric gene delivery vectors in terms of ability to condense the DNA, size and surface charge of their respective polyplexes, and transfection efficiency and cytotoxicity. Specifically, we focused on the influence of a variety of parameters proper to each polymer (i.e. the Mw), and relative to the preparation of polyplexes (i.e. the N/P, the complexation buffer, the order of mixing reagents and the volume ratio of the polymer to the plasmid solutions). First, we pinpointed the best complexation conditions for every array of polymers, and correlated the physicochemical features of each kind of polyplex with its own performance in transfection. It is worthy of note that 25 kDa lPEI was by far the most effective transfectant when the complexation was carried out in 150 mM NaCl and polyplexes were prepared at N/P 40. After that first-round optimization, we studied the influence of several experimental parameters (the composition of the culture medium, the incubation time, the plasmid dose delivered to cells, the cell seeding density, and the volume of the culture medium used for transfecting cells) on the transfection outcomes, and suggested a range of optimal conditions roughly specific for each polymer studied. Interestingly, the cytotoxicity is the parameter most affected by variations in the transfection protocol and most neglected in literature thus far. Furthermore, plotting curves obtained by varying the plasmid dose against the cell seeding density or the volume of culture medium, we pinpointed polymer-specific variations and found that the plasmid concentration in the culture medium is a key parameter affecting gene delivery. Finally, we investigated the impact on varying three parameters at once on the transfection effectiveness of PEIs and pointed out a range of settings specifically optimized to provide superior transfection activity and low cytotoxicity. Interestingly, increasing the cell seeding density or the transfection volume were both found crucial for curtailing some toxic side effects.
Altogether, this work is a wide and thorough comparative survey and optimization of some most used, commercially sourced cationic polymers for gene delivery. Ongoing studies aim to shed light on other potentially interesting parameters, such as the temperature and the pH of the complexation buffer, some cell-specific effects of each transfectant, which may play a role in gene delivery as well.
Acknowledgements
We wish to thank the Italian Ministry of Education, University and Research (MIUR-FIRB, Grant Number: RBFR08XH0H) for economic support and the BioCell staff (Politecnico di Milano) for technical support.References
- G. Y. Wu and C. H. Wu, J. Biol. Chem., 1987, 262, 4429–4432 CAS.
- D. W. Pack, A. S. Hoffman, S. Pun and P. S. Stayton, Nat. Rev. Drug Discovery, 2005, 4, 581–593 CrossRef CAS PubMed.
- D. Pezzoli and G. Candiani, J. Nanopart. Res., 2013, 15, 1523 CrossRef.
- Z. J. Dai, T. Gjetting, M. A. Mattebjerg, C. Wu and T. L. Andresen, Biomaterials, 2011, 32, 8626–8634 CrossRef CAS PubMed.
- S. H. Huh, H. J. Do, H. Y. Lim, D. K. Kim, S. J. Choi, H. Song, N. H. Kim, J. K. Park, W. K. Chang, H. M. Chung and J. H. Kim, Biologicals, 2007, 35, 165–171 CrossRef CAS PubMed.
- O. Boussif, F. Lezoualch, M. A. Zanta, M. D. Mergny, D. Scherman, B. Demeneix and J. P. Behr, Proc. Natl. Acad. Sci. U. S. A., 1995, 92, 7297–7301 CrossRef CAS.
- A. von Harpe, H. Petersen, Y. X. Li and T. Kissel, J. Controlled Release, 2000, 69, 309–322 CrossRef CAS PubMed.
- J. Haensler and F. C. Szoka, Bioconjugate Chem., 1993, 4, 372–379 CrossRef CAS PubMed.
- D. Y. Kwoh, C. C. Coffin, C. P. Lollo, J. Jovenal, M. G. Banaszczyk, P. Mullen, A. Phillips, A. Amini, J. Fabrycki, R. M. Bartholomew, S. W. Brostoff and D. J. Carlo, Biochim. Biophys. Acta, Gene Struct. Expression, 1999, 1444, 171–190 CrossRef CAS.
- H. Yoo and R. L. Juliano, Nucleic Acids Res., 2000, 28, 4225–4231 CrossRef CAS PubMed.
- D. Pezzoli, F. Olimpieri, C. Malloggi, S. Bertini, A. Volonterio and G. Candiani, PLoS ONE, 2012, 7, e34711 CAS.
- J. S. Choi, K. Nam, J. Park, J. B. Kim, J. K. Lee and J. Park, J. Controlled Release, 2004, 99, 445–456 CrossRef CAS PubMed.
- E. V. B. van Gaal, R. van Eijk, R. S. Oosting, R. J. Kok, W. E. Hennink, D. J. A. Crommelin and E. Mastrobattista, J. Controlled Release, 2011, 154, 218–232 CrossRef CAS PubMed.
- W. T. Godbey, K. K. Wu and A. G. Mikos, J. Biomed. Mater. Res., 1999, 45, 268–275 CrossRef CAS PubMed.
- K. Kunath, A. von Harpe, D. Fischer, H. Peterson, U. Bickel, K. Voigt and T. Kissel, J. Controlled Release, 2003, 89, 113–125 CrossRef CAS PubMed.
- A. Masotti, G. Mossa, C. Cametti, G. Ortaggi, A. Bianco, N. Del Grosso, D. Malizia and C. Esposito, Colloids Surf., B, 2009, 68, 136–144 CrossRef CAS PubMed.
- C. Zhang, P. Yadava and J. Hughes, Methods, 2004, 33, 144–150 CrossRef CAS PubMed.
- D. Pezzoli, A. Kajaste-Rudnitski, R. Chiesa and G. Candiani, Methods Mol. Biol., 2013, 1025, 269–279 CAS.
- L. Wightman, R. Kircheis, V. Rossler, S. Carotta, R. Ruzicka, M. Kursa and E. Wagner, J. Gene Med., 2001, 3, 362–372 CrossRef CAS PubMed.
- C. D'Andrea, D. Pezzoli, C. Malloggi, A. Candeo, G. Capelli, A. Bassi, A. Volonterio, P. Taroni and G. Candiani, Photochem. Photobiol. Sci., 2014, 13, 1680–1689 Search PubMed.
- D. K. Bonner, X. Y. Zhao, H. Buss, R. Langer and P. T. Hammond, J. Controlled Release, 2013, 167, 101–107 CrossRef CAS PubMed.
- Y. A. Yue, F. Jin, R. Deng, J. G. Cai, Y. C. Chen, M. C. M. Lin, H. F. Kung and C. Wu, J. Controlled Release, 2011, 155, 67–76 CrossRef CAS PubMed.
- G. Navarro and C. T. de ILarduya, Nanomed. Nanotechnol., 2009, 5, 287–297 CrossRef CAS PubMed.
- G. Candiani, D. Pezzoli, M. Cabras, S. Ristori, C. Pellegrini, A. Kajaste-Rudnitski, E. Vicenzi, C. Sala and M. Zanda, J. Gene Med., 2008, 10, 637–645 CrossRef CAS PubMed.
- P. Erbacher, S. M. Zou, T. Bettinger, A. M. Steffan and J. S. Remy, Pharm. Res., 1998, 15, 1332–1339 CrossRef CAS.
- J. H. S. Kuo, Biotechnol. Appl. Biochem., 2003, 37, 267–271 CrossRef CAS PubMed.
- J. G. Lewis, K. Y. Lin, A. Kothavale, W. M. Flanagan, M. D. Matteucci, R. B. DePrince, R. A. Mook Jr., R. W. Hendren and R. W. Wagner, Proc. Natl. Acad. Sci. U. S. A., 1996, 93, 3176–3181 CrossRef CAS.
- M. A. Mintzer and E. E. Simanek, Chem. Rev., 2009, 109, 259–302 CrossRef CAS PubMed.
- K. A. Mislick and J. D. Baldeschwieler, Proc. Natl. Acad. Sci. U. S. A., 1996, 93, 12349–12354 CrossRef CAS.
- M. Ogris, P. Steinlein, M. Kursa, K. Mechtler, R. Kircheis and E. Wagner, Gene Ther., 1998, 5, 1425–1433 CAS.
- H. M. Wu, S. R. Pan, M. W. Chen, Y. Wu, C. Wang, Y. T. Wen, X. Zeng and C. B. Wu, Biomaterials, 2011, 32, 1619–1634 CrossRef CAS PubMed.
- C. L. Gebhart and A. V. Kabanov, J. Controlled Release, 2001, 73, 401–416 CrossRef CAS PubMed.
- D. Goula, J. S. Remy, P. Erbacher, M. Wasowicz, G. Levi, B. Abdallah and B. A. Demeneix, Gene Ther., 1998, 5, 712–717 CAS.
- S. Audouy, G. Molema, L. de Leij and D. Hoekstra, J. Gene Med., 2000, 2, 465–476 CrossRef CAS PubMed.
- P. Lampela, P. Soininen, A. Urtti, P. T. Mannisto and A. Raasmaja, Int. J. Pharm., 2004, 270, 175–184 CrossRef CAS PubMed.
- D. Honig, J. DeRouchey, R. Jungmann, C. Koch, C. Plank and J. O. Radler, Biomacromolecules, 2010, 11, 1802–1809 CrossRef CAS PubMed.
- M. R. Park, K. O. Han, I. K. Han, M. H. Cho, J. W. Nah, Y. J. Choi and C. S. Cho, J. Controlled Release, 2005, 105, 367–380 CrossRef CAS PubMed.
- A. Ghilardi, D. Pezzoli, M. C. Bellucci, C. Malloggi, A. Negri, A. Sganappa, G. Tedeschi, G. Candiani and A. Volonterio, Bioconjugate Chem., 2013, 24, 1928–1936 CrossRef CAS PubMed.
- W. Zhang, J. Hughes and Y. S. Chen, Appl. Environ. Microbiol., 2012, 78, 3905–3915 CrossRef CAS PubMed.
- A. Lucotti, M. Tommasini, D. Pezzoli and G. Candiani, RSC Adv., 2014, 4, 49620–49627 RSC.
- C. T. de Ilarduya, Y. Sun and N. Duezguenes, Eur. J. Pharm. Sci., 2010, 40, 159–170 CrossRef PubMed.
- M. Ruponen, S. Arkko, A. Urtti, M. Reinisalo and V. P. Ranta, J. Controlled Release, 2009, 136, 226–231 CrossRef CAS PubMed.
- D. Fischer, T. Bieber, Y. X. Li, H. P. Elsasser and T. Kissel, Pharm. Res., 1999, 16, 1273–1279 CrossRef CAS.
- J. W. Wiseman, C. A. Goddard, D. McLelland and W. H. Colledge, Gene Ther., 2003, 10, 1654–1662 CrossRef CAS PubMed.
- W. T. Godbey, K. K. Wu and A. G. Mikos, Biomaterials, 2001, 22, 471–480 CrossRef CAS PubMed.
- J. G. Duguid, C. Li, M. Shi, M. J. Logan, H. Alila, A. Rolland, E. Tomlinson, J. T. Sparrow and L. C. Smith, Biophys. J., 1998, 74, 2802–2814 CrossRef CAS PubMed.
- A. U. Bielinska, C. L. Chen, J. Johnson and J. R. Baker, Bioconjugate Chem., 1999, 10, 843–850 CrossRef CAS PubMed.
- J. Y. Cherng, H. Talsma, R. Verrijk, D. J. A. Crommelin and W. E. Hennink, Eur. J. Pharm. Biopharm., 1999, 47, 215–224 CrossRef CAS PubMed.
Footnote |
| † Electronic supplementary information (ESI) available. See DOI: 10.1039/c5py00915d |
| This journal is © The Royal Society of Chemistry 2015 |