 Open Access Article
Size dependent ion-exchange of large mixed-metal complexes into Nafion® membranes
Elise M.
Naughton
,
Mingqiang
Zhang
,
Diego
Troya
,
Karen J.
Brewer†
and
Robert B.
Moore
*
Department of Chemistry, Macromolecules and Interfaces Institute, Institute for Critical Technology and Applied Science, Virginia Tech, Blacksburg, VA 24061, USA. E-mail: rbmoore3@vt.edu
First published on 18th August 2015
Abstract
Perfluorosulfonate ionomers have been shown to demonstrate a profound affinity for large cationic complexes, and the exchange of these ions may be used to provide insight regarding Nafion® morphology by contrasting molecular size with existing morphological models. The trimetallic complex, [{(bpy)2Ru(dpp)}2RhBr2]5+, is readily absorbed by ion-exchange into Na+-form Nafion® membranes under ambient conditions. The dimensions of three different isomers of the trimetallic complex were found to be: 23.6 Å × 13.3 Å × 10.8 Å, 18.9 Å × 18.0 Å × 13.7 Å, and 23.1 Å × 12.0 Å × 11.4 Å, yielding an average molecular volume of 1.2 × 10³ Å3. At equilibrium, the partition coefficient for the ion-exchange of the trimetallic complex into Nafion® from a DMF solution was found to be 5.7 × 10³. Furthermore, the total cationic charge of the exchanged trimetallic complexes was found to counterbalance 86 ± 2% of the anionic SO3− sites in Nafion®. The characteristic dimensions of morphological models for the ionic domains in Nafion® were found to be comparable to the molecular dimensions of the large mixed-metal complexes. Surprisingly, SAXS analysis indicated that the complexes absorbed into the ionic domains of Nafion® without significantly changing the ionomer morphology. Given the profound affinity for absorption of these large cationic molecules, a more open-channel model for the morphology of perfluorosulfonate ionomers is more reasonable, in agreement with recent experimental findings. In contrast to smaller monometallic complexes, the time dependent uptake of the large trimetallic cations was found to be biexponential. This behavior is attributed to a fast initial ion-exchange process on the surface of the membrane, accompanied by a slower transport-limited ion-exchange for exchange sites that are buried further in the ionomer matrix.
Introduction
Nafion® is a cation-conducting, electrically insulating, perfluorosulfonated ionomer membrane that has a high affinity for large, hydrophobic, cationic compounds.1,2 Since many catalysts and photosensitizers based on transition metals are often large cationic complexes bearing organic ligands, the inherent affinity of Nafion® for such complexes makes it an ideal substrate for the immobilization of these complexes.3–11 For example, ruthenium complexes have been widely used as photoactive species and catalysts in Nafion® membranes for a variety of applications, including platinum4 and TiO2![[thin space (1/6-em)]](https://www.rsc.org/images/entities/char_2009.gif) 11 catalyzed H2 production, O2 evolution,5 photocurrent generation in the presence of a semiconductor,7,9 photoinduced methyl viologen radical cation formation,8 and sulfide to sulfoxide oxidation using a lead ruthenate pyrochlore catalyst.10 Manganese and iron catalysts have also shown enhanced electrocatalytic activity in Nafion®.3,6 These studies have demonstrated that the immobilization of photosensitizers in Nafion® can enhance photo-induced electron transfer processes by limiting intermolecular quenching and vibrational relaxation of photoexcited molecules.4,7,10–12 Moreover, Nafion® membranes may also prevent the decomposition of absorbed catalysts, resulting in enhanced catalytic performance and stability.3,5
11 catalyzed H2 production, O2 evolution,5 photocurrent generation in the presence of a semiconductor,7,9 photoinduced methyl viologen radical cation formation,8 and sulfide to sulfoxide oxidation using a lead ruthenate pyrochlore catalyst.10 Manganese and iron catalysts have also shown enhanced electrocatalytic activity in Nafion®.3,6 These studies have demonstrated that the immobilization of photosensitizers in Nafion® can enhance photo-induced electron transfer processes by limiting intermolecular quenching and vibrational relaxation of photoexcited molecules.4,7,10–12 Moreover, Nafion® membranes may also prevent the decomposition of absorbed catalysts, resulting in enhanced catalytic performance and stability.3,5
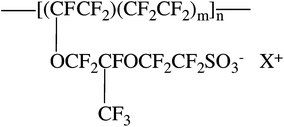
Nafion® is a random copolymer consisting of a tetrafluoroethylene backbone and sulfonate terminated perfluorovinylether side chains (Scheme 1). The ion exchange capacity of Nafion® membranes can be described in terms of the equivalent weight (EW), defined as the mass of the dry polymer per mole of sulfonate groups. For the H+-form of Nafion®, the equivalent weight is related to m as, EW = 100m + 446, and for an 1100 EW membrane, m = 6.6 (on average). Due to the phenomenon of ionic aggregation,2,13,14 Nafion® consists of at least two distinct morphological regions: a hydrophobic region encompassing the polytetrafluoroethylene (PTFE) backbone and a hydrophilic region containing the ionic side-chains. The semi-crystalline hydrophobic region of the ionomer provides the mechanical stability of the membrane while the hydrophilic domains contain ionic aggregates that impart the membrane with unique transport properties related to ion conductivity and permselectivity.1,2,15 There are numerous models for the ionic domains of Nafion®. These models are based upon results from small angle X-ray (SAXS) and neutron scattering (SANS), water uptake, water and ion transport, uniaxial strain, and NMR results.2,13,14,16–26
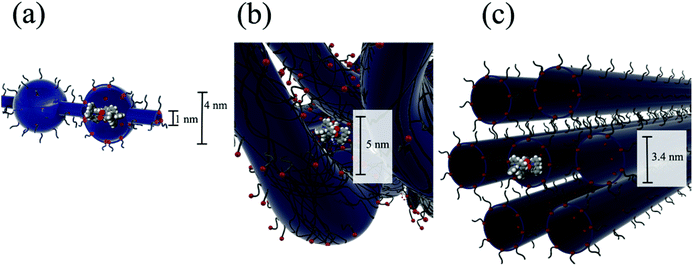
An early model for Nafion® morphology is the cluster-network model proposed by Gierke and coworkers (Fig. 1a).13,14 This model consists of spherical clusters, 4 nm in diameter, interconnected by 1 nm channels. The 1 nm channels are included in order to account for the continuous pathway for transport between clusters and high permselectivity (i.e. preferential transport of cations) observed for Nafion® membranes. The characteristic dimensions of the 4 nm clusters were rationalized from SAXS and water absorption measurements; however, there is no experimental evidence to account for the 1 nm channels between clusters.
Due to the inconsistency of the cluster-network model with scattering data over a wide range of scattering angles and orientation under uniaxial strain, alternative models for the morphology of Nafion® have been proposed. Rubatat and coworkers describe a fibrillar model, where, in solvated films, cylindrical or ribbon-like clusters of semicrystalline fluorocarbon chains are surrounded by ionic groups, constituting rod-like aggregates (Fig. 1b).18,26 Another more recent model is the parallel cylindrical water channel model by Schmidt-Rohr et al.16 This model consists of cylindrical aggregates forming parallel channels of water ranging in diameter from 1.8 nm to 3.4 nm with an average diameter of 2.4 nm (Fig. 1c).
In this study, Nafion® is used as a matrix to host photocatalytic complexes.27–29 This ionomer has been shown to demonstrate a remarkable affinity for large hydrophobic cationic molecules,1,30–32 and as such, it is an ideal, thin film substrate for immobilizing large metal complexes suitable for artificial leaf applications. Given the unique ionic domain morphology of Nafion® and the large dimensions of the mixed-metal complexes used in this study, it is important to evaluate the size dependent absorption behavior of this guest–host system. Ultimately, this behavior is expected to provide critical insight into the effect of polymer-complex interactions on photocatalytic behavior of the immobilized metal complexes within the ionic domains. Moreover, this uptake behavior may provide useful insight into the true morphology of Nafion®.
Experimental
Materials
Nafion® 117 (DuPont) was cleaned by refluxing in 8 M nitric acid for 1–2 h, followed by a H2O rinse and refluxing in H2O for ∼1 h. Films were dried in a vacuum oven at 90 °C for ∼12 h. Neutralization to the Na+-form of Nafion® was achieved by allowing the Nafion® to equilibrate in a 1 M NaOH solution for ∼24 h, followed by a H2O rinse and reflux in H2O for ∼1 h to remove excess NaOH. Spectrophotometric grade dimethylformamide (Alfa Aesar) and HPLC grade acetonitrile (Fisher) were used for all absorption/adsorption experiments. For the metal complex syntheses, cis-dichlorobis(2,2′-bipyridyl)ruthenium(II) dihydrate ((bpy)2RuCl2·2H2O) from Strem Chemicals, rhodium(III) bromide hydrate (RhBr3·H2O) from Alfa Aesar and 2,3-bis(2-pyridyl)pyrazine (dpp) from Sigma Aldrich were used.Synthesis of photocatalytic complexes
Both the monometallic complex [(bpy)2Ru(dpp)](PF6)2 and the trimetallic complex [{(bpy)2Ru(dpp)}RhBr2](PF6)5 were synthesized via a building block approach as reported previously.27 Purity of all complexes were verified through mass spectrometry, electrochemistry, and electronic absorbance/emission experiments and the data was found to be consistent with the previous report.Analysis of ion-exchange
Ion-exchange of the monometallic, [(bpy)2Ru(dpp)](PF6)2, and trimetallic, [{(bpy)2Ru(dpp)}2RhBr2](PF6)5, complexes into Nafion® from CH3CN and dimethylformamide (DMF) solutions (2 × 10⁻⁴ M) was monitored over time by analyzing the supernatant spectrophotometrically. Based on the ionic exchange capacity of 1100 EW Na+-form Nafion®, precise masses of the ionomer membranes were added to the solutions in order to establish a 1![[thin space (1/6-em)]](https://www.rsc.org/images/entities/char_2009.gif) :
:![[thin space (1/6-em)]](https://www.rsc.org/images/entities/char_2009.gif) 1 charge ratio of sulfonate anions from Nafion® to cationic charge from the metal complexes. To determine solution concentrations, electronic absorbance measurements were conducted every 20 minutes using an Ocean Optics USB 2000 spectrometer with adjustable path length fiber optic probes, DH-2000-BAL UV-Vis-NIR light source, and a MPM 2000 multiplexer. The path lengths of the probes were adjusted to maximize the range of absorbance within the linear Beer's Law region for each complex, at initial concentrations of 2 × 10⁻⁴ M. Applying Beer's law, the transient concentrations of the monometallic, [(bpy)2Ru(dpp)]2+, and trimetallic, [{(bpy)2Ru(dpp)}2RhBr2]5+, complexes were calculated using extinction coefficients of 6.9 × 10³ M−1 cm−1 at 430 nm and 1.3 × 10⁴ M−1 cm−1 at 510 nm, respectively. For all Nafion® absorption experiments, solutions of the metal complexes were kept in the dark during the entire course of the experiments to avoid photoreduction.
1 charge ratio of sulfonate anions from Nafion® to cationic charge from the metal complexes. To determine solution concentrations, electronic absorbance measurements were conducted every 20 minutes using an Ocean Optics USB 2000 spectrometer with adjustable path length fiber optic probes, DH-2000-BAL UV-Vis-NIR light source, and a MPM 2000 multiplexer. The path lengths of the probes were adjusted to maximize the range of absorbance within the linear Beer's Law region for each complex, at initial concentrations of 2 × 10⁻⁴ M. Applying Beer's law, the transient concentrations of the monometallic, [(bpy)2Ru(dpp)]2+, and trimetallic, [{(bpy)2Ru(dpp)}2RhBr2]5+, complexes were calculated using extinction coefficients of 6.9 × 10³ M−1 cm−1 at 430 nm and 1.3 × 10⁴ M−1 cm−1 at 510 nm, respectively. For all Nafion® absorption experiments, solutions of the metal complexes were kept in the dark during the entire course of the experiments to avoid photoreduction.
Mixed DMF![[thin space (1/6-em)]](https://www.rsc.org/images/entities/char_2009.gif) :
:![[thin space (1/6-em)]](https://www.rsc.org/images/entities/char_2009.gif) CH3CN solutions containing monometallic, [(bpy)2Ru(dpp)](PF6)2, and trimetallic, [{(bpy)2Ru(dpp)}RhBr2](PF6)5, complexes at a 1
CH3CN solutions containing monometallic, [(bpy)2Ru(dpp)](PF6)2, and trimetallic, [{(bpy)2Ru(dpp)}RhBr2](PF6)5, complexes at a 1![[thin space (1/6-em)]](https://www.rsc.org/images/entities/char_2009.gif) :
:![[thin space (1/6-em)]](https://www.rsc.org/images/entities/char_2009.gif) 1 ratio were used to evaluate solvent dependent competitive absorption into Nafion®. The solvent system was varied from 0.1 to 10% (v/v) DMF in CH3CN. A Hewlett-Packard 8452A diode array spectrophotometer (2 nm resolution) was used to determine initial and final metal complex concentrations before and after absorption into Nafion®. Due to solvatochromic shifts in the absorption spectra between DMF and CH3CN, the absorbance of the monometallic, [(bpy)2Ru(dpp)](PF6)2, and trimetallic, [{(bpy)2Ru(dpp)}RhBr2](PF6)5, complexes at a wavelength of 480 nm was selected because the extinction coefficients were independent of solvent composition at this wavelength. The concentrations of the mixed complex solutions (1
1 ratio were used to evaluate solvent dependent competitive absorption into Nafion®. The solvent system was varied from 0.1 to 10% (v/v) DMF in CH3CN. A Hewlett-Packard 8452A diode array spectrophotometer (2 nm resolution) was used to determine initial and final metal complex concentrations before and after absorption into Nafion®. Due to solvatochromic shifts in the absorption spectra between DMF and CH3CN, the absorbance of the monometallic, [(bpy)2Ru(dpp)](PF6)2, and trimetallic, [{(bpy)2Ru(dpp)}RhBr2](PF6)5, complexes at a wavelength of 480 nm was selected because the extinction coefficients were independent of solvent composition at this wavelength. The concentrations of the mixed complex solutions (1![[thin space (1/6-em)]](https://www.rsc.org/images/entities/char_2009.gif) :
:![[thin space (1/6-em)]](https://www.rsc.org/images/entities/char_2009.gif) 1 monometallic complex, [(bpy)2Ru(dpp)](PF6)2, trimetallic complex, [{(bpy)2Ru(dpp)}RhBr2](PF6)5) were adjusted to an absorbance value of 1 in a 0.2 cm cell at 480 nm in order to maximize the absorbance range in the linear Beer's Law region. At 480 nm, the extinction coefficient, ε480, for the monometallic complex, [(bpy)2Ru(dpp)](PF6)2, was found to be 1.0 × 10⁴ M−1 cm−1 and for the trimetallic complex, [{(bpy)2Ru(dpp)}RhBr2](PF6)5, ε480 = 2.0 × 10⁴ M−1 cm−1. Precise masses of 1100 EW Na+-form Nafion® 117, ensuring a 1
1 monometallic complex, [(bpy)2Ru(dpp)](PF6)2, trimetallic complex, [{(bpy)2Ru(dpp)}RhBr2](PF6)5) were adjusted to an absorbance value of 1 in a 0.2 cm cell at 480 nm in order to maximize the absorbance range in the linear Beer's Law region. At 480 nm, the extinction coefficient, ε480, for the monometallic complex, [(bpy)2Ru(dpp)](PF6)2, was found to be 1.0 × 10⁴ M−1 cm−1 and for the trimetallic complex, [{(bpy)2Ru(dpp)}RhBr2](PF6)5, ε480 = 2.0 × 10⁴ M−1 cm−1. Precise masses of 1100 EW Na+-form Nafion® 117, ensuring a 1![[thin space (1/6-em)]](https://www.rsc.org/images/entities/char_2009.gif) :
:![[thin space (1/6-em)]](https://www.rsc.org/images/entities/char_2009.gif) 1 charge ratio, were added to the solutions and allowed to equilibrate until solution concentrations remained constant for >24 h. In order to isolate the concentrations of the trimetallic complex, [{(bpy)2Ru(dpp)}RhBr2](PF6)5, in the mixed complex solutions, a wavelength of 650 nm was chosen because only the trimetallic complex, [{(bpy)2Ru(dpp)}RhBr2](PF6)5, absorbs at this wavelength (ε = 2.5 × 10³ M−1 cm−1 in both CH3CN and DMF). Since the extinction coefficient is roughly an order of magnitude smaller at 650 nm than at 480 nm, the absorbance of the solutions were measured in a 1.0 cm cell at 650 nm to maintain absorbance values in the linear Beer's Law region. Beer's Law and the absorbance at 650 nm were used to determine the concentration of the trimetallic complex, [{(bpy)2Ru(dpp)}RhBr2](PF6)5. These concentrations of trimetallic complex, [{(bpy)2Ru(dpp)}RhBr2](PF6)5, were then used to determine the absorbance contribution of trimetallic complex, [{(bpy)2Ru(dpp)}RhBr2](PF6)5, at 480 nm, which was subsequently subtracted from the total absorbance at 480 nm of the mixed complex solutions. The remaining absorbance after subtraction was attributed to absorbance from the monometallic complex, [(bpy)2Ru(dpp)](PF6)2, and the concentration was calculated using Beer's Law.
1 charge ratio, were added to the solutions and allowed to equilibrate until solution concentrations remained constant for >24 h. In order to isolate the concentrations of the trimetallic complex, [{(bpy)2Ru(dpp)}RhBr2](PF6)5, in the mixed complex solutions, a wavelength of 650 nm was chosen because only the trimetallic complex, [{(bpy)2Ru(dpp)}RhBr2](PF6)5, absorbs at this wavelength (ε = 2.5 × 10³ M−1 cm−1 in both CH3CN and DMF). Since the extinction coefficient is roughly an order of magnitude smaller at 650 nm than at 480 nm, the absorbance of the solutions were measured in a 1.0 cm cell at 650 nm to maintain absorbance values in the linear Beer's Law region. Beer's Law and the absorbance at 650 nm were used to determine the concentration of the trimetallic complex, [{(bpy)2Ru(dpp)}RhBr2](PF6)5. These concentrations of trimetallic complex, [{(bpy)2Ru(dpp)}RhBr2](PF6)5, were then used to determine the absorbance contribution of trimetallic complex, [{(bpy)2Ru(dpp)}RhBr2](PF6)5, at 480 nm, which was subsequently subtracted from the total absorbance at 480 nm of the mixed complex solutions. The remaining absorbance after subtraction was attributed to absorbance from the monometallic complex, [(bpy)2Ru(dpp)](PF6)2, and the concentration was calculated using Beer's Law.
Nafion® swelling
The length and width of dry rectangular Nafion® films were measured with calipers and the film thickness was measured in three different places with microcalipers. The dry volumes of the films were then calculated from these dimensions. These dry films were then immersed in pure DMF or CH3CN and stored at room temperature for 24 h. Following this treatment, the dimensions of solvent swollen membranes were measured in a manner identical to that of the dry membranes, to yield the wet, solvent swollen, volume. The degree of solvent swelling was defined as 100(Vwet − Vdry)/Vdry.Molecular dimensions of the complexes
The axial dimensions and volumes of the complexes were obtained from the structures generated in SCIGRESS using ab initio calculations at the B3LYP/STO-3G level of theory, employing the Gaussian 09 suite of programs.33 The average dimensions of the complexes were determined by direct examination of the model-generated coordinates.Small angle X-ray scattering
SAXS experiments were performed using a Rigaku S-Max 3000 SAXS system, equipped with a focusing mirror, 3 pinholes and a rotating anode emitting X-rays with a wavelength of 0.154 nm (Cu Kα). The sample-to-detector distance was 1603 mm, and the q-range was calibrated using a silver behenate standard. The SAXS data were corrected for sample thickness, sample transmission and background scattering. All the SAXS data were analyzed using the SAXSGUI software package to obtain radially integrated plots of SAXS intensity versus scattering vector q, where q = (4π/λ)sin(θ), θ is one half of the scattering angle and λ is the X-ray wavelength.Results and discussion
The trimetallic complex, [{(bpy)2Ru(dpp)}2RhBr2]5+ (Scheme 2b), contains two terminal ruthenium metals, each chelated to two 2,2′-bipyridine (bpy) terminal ligands and a 2,3-bis(2-pyridyl)pyrazine (dpp) bridging ligand. The dpp ligands are, in turn, coordinated to a central rhodium ion, which is also coordinated by two bromides.27,28 The trimetallic complex, [{(bpy)2Ru(dpp)}2RhBr2]5+, used in this study is of particular importance due to its ability to catalyze the light activated production of hydrogen from water.27–29 Each coordinated Ru moiety acts as a light absorber. In the presence of a sacrificial electron donor, electron transfer to the Rh center occurs via a photoinduced metal to ligand charge transfer (MLCT) transition to the dpp bridging ligand, followed by electron transfer to the Rh. Upon reduction, the Rh(III) complex undergoes a rearrangement from octahedral geometry to square planar geometry, accompanied by loss of the halide ligands. Consequently, water reduction catalysis occurs at the Rh center.27,28Ion-exchange of Ru polypyridyl complexes into Nafion® has been shown to be advantageous for photo-induced electron transfer processes.4,7,10–12 It is hypothesized that the catalytic performance of trimetallic complex, [{(bpy)2Ru(dpp)}2RhBr2]5+, will be improved when absorbed in Nafion®, due to a number of molecular factors including restriction of conformational rearrangements in the polymer matrix and restriction of molecular mobility (reduced intermolecular quenching and limited long range diffusion). In order to understand the effect that the ionomer has on catalytic performance, it is important to understand the specific interactions between the polymer and the metal complex that lead to a functionally advantageous spatial distribution of catalyst molecules within (absorbed) or on the surface of the host polymer film.
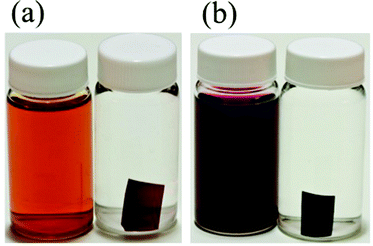
Excess colorless and transparent pieces of 1100 EW Na+-form Nafion® 117 (180 μm thick) were added to separate solutions of the trimetallic, [{(bpy)2Ru(dpp)}RhBr2](PF6)5, and monometallic, [(bpy)2Ru(dpp)](PF6)2 (Scheme 2a), complexes in DMF. Upon swelling in DMF, the volume of the Nafion® films increased by 100%. The metal complex solutions containing the Nafion® films were kept in the dark at room temperature for >48 h. Following this treatment, the resulting DMF solutions were colorless, while the originally colorless ionomer membranes were highly colored (Fig. 2) This essentially complete ion-exchange suggests that Nafion® has a very high affinity for both the monometallic, [(bpy)2Ru(dpp)]2+, and trimetallic, [{(bpy)2Ru(dpp)}2RhBr2]5+, complexes.
The favorable ion-exchange of the trimetallic complex, [{(bpy)2Ru(dpp)}2RhBr2]5+, into Nafion® was an unexpected result considering the large size of this mixed metal complex in comparison to the size of the ionic aggregates in Nafion®. Volumes and dimensions of the monometallic, [(bpy)2Ru(dpp)]2+, and trimetallic, [{(bpy)2Ru(dpp)}2RhBr2]5+, complexes have been calculated in order to compare them to the size of Nafion® ionic aggregates. The trimetallic complex, [{(bpy)2Ru(dpp)}2RhBr2]5+, consists of a mixture of 18 isomers. These isomers have a mixture of Δ and Λ configurations (optical isomers), which do not yield significant variations in the volume and dimensions of the complex.34 The range in sizes of the complexes is principally defined by three geometric isomers about the Rh, where the geometry of the dpp bridging ligand coordination to the central Rh can vary. The average volume of these three structural isomers were calculated to be 1.2 × 10³ Å3, with respective dimensions (maximum length in the x, y and z directions) listed in Table 1. A 3D model schematic representation of the monometallic complex, [(bpy)2Ru(dpp)]2+, is compared to that of isomer 1 of the trimetallic complex, [{(bpy)2Ru(dpp)}2RhBr2]5+, as shown in Fig. 3. These dimensions are compared to the dimensions of proposed models of Nafion® ionic aggregates.
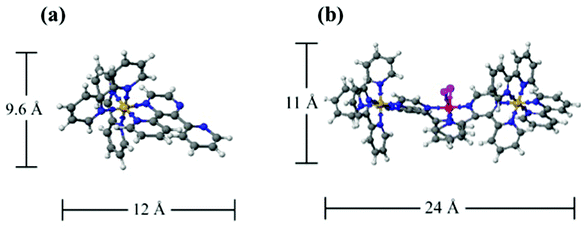 | ||
| Fig. 3 Three-dimensional model of monometallic complex, [(bpy)2Ru(dpp)]2+, and trimetallic complex, [{(bpy)2Ru(dpp)}2RhBr2]5+, isomer 1. Structures generated in SCIGRESS. | ||
| Dimension | Isomer 1 | Isomer 2 | Isomer 3 |
|---|---|---|---|
| X | 10.8 | 18.0 | 12.0 |
| Y | 23.6 | 18.9 | 23.1 |
| Z | 13.3 | 13.7 | 11.4 |
In order to demonstrate the relative size of the complexes compared to proposed models of Nafion® ionic aggregates, a space filling model of one of the isomers is superimposed (to scale) inside the original cluster-network model of Nafion® membranes13 (Fig. 4a), the more recent fibrillar ribbon model18,26 (Fig. 4b) and the cylindrical water channel model16 (Fig. 4c). It has been determined through electronic absorbance experiments that 86 ± 2% of the sulfonate groups are counterbalanced by the overall charge of the trimetallic complex, [{(bpy)2Ru(dpp)}2RhBr2]5+, absorbed into the membrane. Similarly, 90 ± 2% of the sulfonate sites are counterbalanced by the overall charge of the monometallic complex, [(bpy)2Ru(dpp)]2+. While these ionic exchange values are quite high, given the large size of the complexes, it is not surprising that the quantity of sulfonate groups participating in the ion exchange process is less than 100% because some of the –SO3− terminated side chains are likely to be inaccessible.2,35
Considering the cluster-network model13 (Fig. 4a), it is possible for the trimetallic complex, [{(bpy)2Ru(dpp)}2RhBr2]5+, to fit in the 4 nm cluster, however, the 1 nm channels are too small to allow access of the large complex without some complicated (and likely inhibiting) structural rearrangement during the ion-exchange process. Moreover this simple model is not likely to be an accurate description of the structure in the highly swollen state (DMF volume fraction of ΦDMF = 0.5). In contrast, superimposing the trimetallic complex, [{(bpy)2Ru(dpp)}2RhBr2]5+, into more open rod/ribbon-like18,26 (Fig. 4b) or cylindrical water channel16 models of Nafion® (Fig. 4c) suggests that the large trimetallic complex, [{(bpy)2Ru(dpp)}2RhBr2]5+, may be more readily exchanged into the ionic aggregates of more accommodating morphologies as opposed to the inherently restricted cluster-network model.
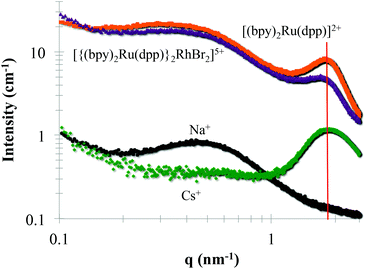
Small Angle X-ray Scattering (SAXS) is commonly used to probe the dimensions of the ionic aggregates of Nafion®.2,14,16,18 SAXS profiles of Nafion® loaded with trimetallic, [{(bpy)2Ru(dpp)}2RhBr2]5+, and monometallic, [(bpy)2Ru(dpp)]2+, complexes were compared to Na+ and Cs+-forms of Nafion® (Fig. 5). The monometallic, [(bpy)2Ru(dpp)]2+, and trimetallic, [{(bpy)2Ru(dpp)}2RhBr2]5+, complexes were loaded into Na+-form Nafion® membranes. In the Na+-form of Nafion®, there is no observed ionic scattering peak due to contrast variation.18,36 The appearance of the ionic scattering peak (marked with a red line at qmax = 1.8 nm−1) in the films that have been loaded with monometallic, [(bpy)2Ru(dpp)]2+, and trimetallic, [{(bpy)2Ru(dpp)}2RhBr2]5+, complexes indicates that the electron density of the Nafion® ionic aggregates has changed. This observed increase in electron density is consistent with the complexes present within the Nafion® ionic aggregates. Surprisingly, the relative peak position of the ionic peak in comparison to the Cs+-form of Nafion® is not appreciably altered, suggesting the dimensions of the ionic aggregates are not significantly changed upon the incorporation of these relatively large complexes.
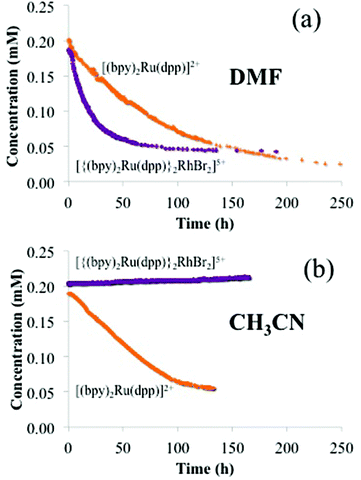
In addition to the significant ion-exchange of the large trimetallic complex, [{(bpy)2Ru(dpp)}2RhBr2]5+, into Nafion®, time dependent absorption in DMF shows that the larger trimetallic complex, [{(bpy)2Ru(dpp)}2RhBr2]5+, is exchanged considerably faster than the smaller monometallic complex, [(bpy)2Ru(dpp)]2+ (Fig. 6a). The half-life of ion-exchange of the monometallic, [(bpy)2Ru(dpp)]2+, and trimetallic, [{(bpy)2Ru(dpp)}2RhBr2]5+, with Na+ in Nafion® (t1/2) is defined as the time at which the concentration of the DMF/metal complex solution is one half the initial concentration. Half-lives were determined with a 1![[thin space (1/6-em)]](https://www.rsc.org/images/entities/char_2009.gif) :
:![[thin space (1/6-em)]](https://www.rsc.org/images/entities/char_2009.gif) 1 Nafion®
1 Nafion®![[thin space (1/6-em)]](https://www.rsc.org/images/entities/char_2009.gif) :
:![[thin space (1/6-em)]](https://www.rsc.org/images/entities/char_2009.gif) metal complex charge ratio (i.e., 1 mol [{(bpy)2Ru(dpp)}2RhBr2]5+
metal complex charge ratio (i.e., 1 mol [{(bpy)2Ru(dpp)}2RhBr2]5+![[thin space (1/6-em)]](https://www.rsc.org/images/entities/char_2009.gif) :
:![[thin space (1/6-em)]](https://www.rsc.org/images/entities/char_2009.gif) 5 mol –SO3− and 1 mol [(bpy)2Ru(dpp)]2+
5 mol –SO3− and 1 mol [(bpy)2Ru(dpp)]2+![[thin space (1/6-em)]](https://www.rsc.org/images/entities/char_2009.gif) :
:![[thin space (1/6-em)]](https://www.rsc.org/images/entities/char_2009.gif) 2 mol –SO3−), where t1/2 = 60 h for the monometallic complex, [(bpy)2Ru(dpp)]2+, and t1/2 = 20 h for the trimetallic complex, [{(bpy)2Ru(dpp)}2RhBr2]5+.
2 mol –SO3−), where t1/2 = 60 h for the monometallic complex, [(bpy)2Ru(dpp)]2+, and t1/2 = 20 h for the trimetallic complex, [{(bpy)2Ru(dpp)}2RhBr2]5+.
The difference in the ion-exchange half-lives may be attributed to the relative affinity of Nafion® for the two metal complexes. The affinity of Nafion® for the metal complexes can be expressed with partition coefficients (Kx), defined as the ratio of equilibrium concentrations of the metal complex in the Nafion® membrane to equilibrium concentrations of the metal complex in a DMF solution (eqn (1)). Despite the larger
 | (1) |
Since the ionic complexes must be accommodated within the ionic domains of Nafion® (i.e., either of sufficient size or having the ability to structurally rearrange), it is reasonable to expect that the rate of the trimetallic complex, [{(bpy)2Ru(dpp)}2RhBr2]5+, exchange would be dependent on the degree of solvent induced swelling of the Nafion® membrane. With DMF, the Nafion membrane swells by 100% (doubles in volume), while with CH3CN, the membrane swells by only 10%. For the highly swollen membranes in DMF, the ion-exchange of the trimetallic complex, [{(bpy)2Ru(dpp)}2RhBr2]5+, is much faster than the exchange of the monometallic complex, [(bpy)2Ru(dpp)]2+. In contrast, for the less swollen membranes in CH3CN, there is still a rapid ion-exchange of the smaller monometallic complex, [(bpy)2Ru(dpp)]2+, while essentially no measureable exchange of the larger trimetallic complex, [{(bpy)2Ru(dpp)}2RhBr2]5+, is observed (Fig. 6b). Based on this result, it is apparent that a size-dependent competitive ion-exchange of monometallic, [(bpy)2Ru(dpp)]2+, and trimetallic, [{(bpy)2Ru(dpp)}2RhBr2]5+, complexes is operable. Kreuer and coworkers used SAXS to correlate the degree of water swelling to the average dimensions of the water swollen ionic domains in Nafion®.40 Following this “expansion law” argument, it is easy to rationalize that the DMF swollen films (ΦDMF = 0.5) would contain ionic domains with dimensions significantly larger than those in CH3CN swollen films (ΦACN = 0.09). Thus, with limited solvent swelling, the ionic domains are less accommodating to the larger complexes.
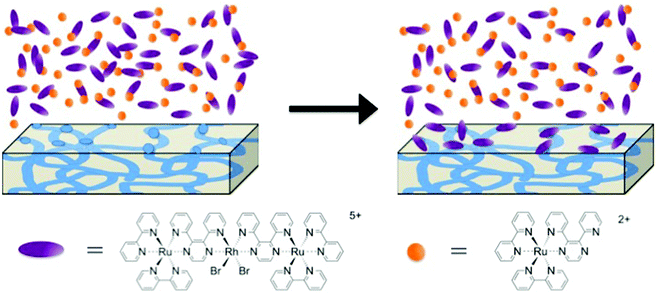
To further probe this size-dependent competitive ion-exchange phenomenon, a Nafion® membrane was exposed to the large trimetallic, [{(bpy)2Ru(dpp)}2RhBr2]5+, and small monometallic, [(bpy)2Ru(dpp)]2+, complexes in a sequential fashion. A Na+ form Nafion® membrane was first added to a solution of trimetallic complex, [{(bpy)2Ru(dpp)}RhBr2](PF6)5, in CH3CN and allowed to equilibrate (monitored with electronic absorbance), then rinsed with pure CH3CN, followed by immersion in a solution of the monometallic complex, [(bpy)2Ru(dpp)](PF6)2, in CH3CN. Under this sequential exposure process, no measurable exchange of either complex into Nafion® was observed. Note that if the Na+-form Nafion® film was exposed to the monometallic complex, [(bpy)2Ru(dpp)](PF6)2, without first equilibrating in the trimetallic complex, [{(bpy)2Ru(dpp)}RhBr2](PF6)5/CH3CN solution, significant ion-exchange of the monometallic complex, [(bpy)2Ru(dpp)](PF6)2, was observed as shown in Fig. 6b. Therefore, under this sequential exposure process, it is proposed that, in low solvent swelling conditions, the large trimetallic complex, [{(bpy)2Ru(dpp)}2RhBr2]5+, is electrostatically attracted to the Nafion® film, but is restricted from entering the ionic domains within the membrane. Consequently, the large trimetallic complex, [{(bpy)2Ru(dpp)}2RhBr2]5+, is only able to exchange with ions on the surface of the Nafion® film, thereby “blocking the pores” and thus preventing further ion-exchange of the monometallic complex, [(bpy)2Ru(dpp)]2+, into the interior ionic domains of Nafion®, as depicted in Fig. 7.
With the recognition that the dimensions of the trimetallic complex, [{(bpy)2Ru(dpp)}2RhBr2]5+, are comparable to the dimensions of the ionic domains in Nafion®, and the accommodation of these ionic species into the membrane may involve at least two different ion-exchange processes (surface vs. bulk exchange sites in Nafion®), further insight into the uptake mechanism may be obtained through additional analysis of the time dependent ion-exchange data in Fig. 6. Using exponential fits of these data as shown in Fig. 8, it was determined that the trimetallic complex, [{(bpy)2Ru(dpp)}2RhBr2]5+, was exchanged via a biexponential (eqn (2)) process, while the monometallic complex, [(bpy)2Ru(dpp)]2+, was exchanged through a monoexponential (eqn (3)) process.
| [tir]Nafion = 0.77[tri]ie−0.045t + 0.23[tri]ie−0.00061t | (2) |
| [mono]Nafion = [mono]ie−0.014t | (3) |
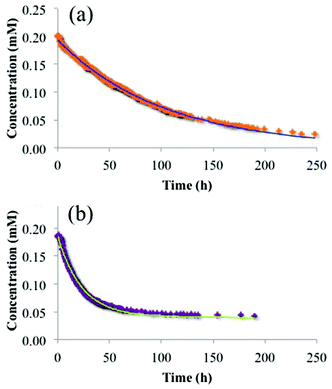 | ||
| Fig. 8 Experimental data and fitting result of trimetallic complex, [{(bpy)2Ru(dpp)}2RhBr2]5+, (a) and monometallic complex, [(bpy)2Ru(dpp)]2+, (b) absorbed into Nafion® from a DMF solution and fit to eqn (1) and (2) where [{(bpy)2Ru(dpp)}2RhBr2]5+ = [tri] and [(bpy)2Ru(dpp)]2+ = [mono]. | ||
In agreement with the results of the sequential exposure analysis (above) and behavior common to other ion-exchange materials,41,42 the biexponential uptake of the trimetallic complex, [{(bpy)2Ru(dpp)}2RhBr2]5+, is attributed to a fast ion-exchange of the complex with the surface accessible sulfonate groups, followed by a somewhat slower diffusion of these complexes into the interior of the membrane (exchange with bulk sulfonates). In contrast, the smaller dimensions of the monometallic complex, [(bpy)2Ru(dpp)]2+, yield a lower diffusive barrier for exchange with bulk sulfonate sites and thus less contrast in time-dependence between the surface ion-exchange and internal ion-exchange processes.
Although essentially no uptake in the less swelling CH3CN solution (Fig. 6b) was observed for the trimetallic complex, [{(bpy)2Ru(dpp)}2RhBr2]5+, at a 1![[thin space (1/6-em)]](https://www.rsc.org/images/entities/char_2009.gif) :
:![[thin space (1/6-em)]](https://www.rsc.org/images/entities/char_2009.gif) 1 charge ratio of trimetallic complex, [{(bpy)2Ru(dpp)}2RhBr2]5+, to –SO3− in Nafion®, it is important to note that the equilibrated films had a slight color change that could not be removed by rinsing with various solvents. Surface ion-exchange experiments were performed with a large excess of Nafion® (1
1 charge ratio of trimetallic complex, [{(bpy)2Ru(dpp)}2RhBr2]5+, to –SO3− in Nafion®, it is important to note that the equilibrated films had a slight color change that could not be removed by rinsing with various solvents. Surface ion-exchange experiments were performed with a large excess of Nafion® (1![[thin space (1/6-em)]](https://www.rsc.org/images/entities/char_2009.gif) :
:![[thin space (1/6-em)]](https://www.rsc.org/images/entities/char_2009.gif) 100 and 1
100 and 1![[thin space (1/6-em)]](https://www.rsc.org/images/entities/char_2009.gif) :
:![[thin space (1/6-em)]](https://www.rsc.org/images/entities/char_2009.gif) 50 charge ratios of trimetallic complex, [{(bpy)2Ru(dpp)}2RhBr2]5+, to SO3− groups) and analyzed by electronic absorbance. The rate of surface exchange of the complex under these conditions followed a monoexponential trend and was found to be dependent on the surface area of the Nafion® films. The trimetallic complex, [{(bpy)2Ru(dpp)}2RhBr2]5+, was exchanged at a faster rate with a higher surface area of Nafion®. This evidence further supports our theory that the overall uptake of the large trimetallic complex, [{(bpy)2Ru(dpp)}2RhBr2]5+, is governed by ion-exchange onto the surface of the Nafion® film.
50 charge ratios of trimetallic complex, [{(bpy)2Ru(dpp)}2RhBr2]5+, to SO3− groups) and analyzed by electronic absorbance. The rate of surface exchange of the complex under these conditions followed a monoexponential trend and was found to be dependent on the surface area of the Nafion® films. The trimetallic complex, [{(bpy)2Ru(dpp)}2RhBr2]5+, was exchanged at a faster rate with a higher surface area of Nafion®. This evidence further supports our theory that the overall uptake of the large trimetallic complex, [{(bpy)2Ru(dpp)}2RhBr2]5+, is governed by ion-exchange onto the surface of the Nafion® film.
Conclusions
We have demonstrated that the large trimetallic complex, [{(bpy)2Ru(dpp)}2RhBr2]5+, readily absorbs into Nafion®via ion-exchange under appropriate solvent swelling conditions. This facile exchange is remarkable due to the calculated size of the trimetallic complex, [{(bpy)2Ru(dpp)}2RhBr2]5+, in comparison to proposed dimensions of Nafion® ionic aggregates. In order to accommodate these large molecules, it is reasonable to rationalize a more open channel morphology over the more confining morphology of the cluster-network model. It has been determined that up to 86 ± 2% of the –SO3− groups in Nafion® can be counterbalanced by the trimetallic complex, [{(bpy)2Ru(dpp)}2RhBr2]5+, and the morphology of the ionomer is not significantly altered upon exchange of the metal complex. Furthermore, consistent with other ion exchange materials, Nafion® has a greater affinity for the ion with the higher charge: the trimetallic complex, [{(bpy)2Ru(dpp)}2RhBr2]5+, over the monometallic complex, [(bpy)2Ru(dpp)]2+. Due to this higher affinity for the trimetallic complex, [{(bpy)2Ru(dpp)}2RhBr2]5+, the half-life of ion-exchange in more swollen films is observed to be faster than that of the monometallic complex, [(bpy)2Ru(dpp)]2+. In less swollen films, exchange of the trimetallic complex, [{(bpy)2Ru(dpp)}2RhBr2]5+, is not observed in a measurable quantity. Investigation of the time dependent ion-exchange behavior has led to the conclusion that absorption occurs via a fast exchange of surface sulfonate groups followed by a slow exchange (via diffusion) of ions in the interior domains of the ionomer. With a low swelling solvent, exposure of Nafion® films to both the monometallic, [(bpy)2Ru(dpp)]2+, and trimetallic, [{(bpy)2Ru(dpp)}2RhBr2]5+, complexes, yielded negligible exchange of either species. Given the higher affinity of Nafion® for the trimetallic complex, [{(bpy)2Ru(dpp)}2RhBr2]5+, it is proposed that the large complex exchanges with ions on the surface of the film, thereby blocking access to the ionic aggregates and thus preventing subsequent exchange of the monometallic complex, [(bpy)2Ru(dpp)]2+.Overall, the large size of the trimetallic complex, [{(bpy)2Ru(dpp)}2RhBr2]5+, in comparison to the ionic aggregates of Nafion® allows for solvent controlled ion-exchange of the metal complex. Further investigation is underway in order to determine the effect of changing swelling conditions after the complex has been absorbed in the ionomer. Switching to a lower swelling solvent after absorption could essentially “lock” the large metal complex in place and reduce deactivation of photoinduced excited states through intermolecular collisions and vibrational relaxation. With this reduced deactivation, we anticipate enhanced catalytic activity in these new guest–host systems.
Acknowledgements
Acknowledgement is made to Virginia Tech Department of Chemistry, Institute for Critical Technology and Applied Science (ICTAS) Sustainable Energy Laboratory, Department of Energy DE FG02-05-ER15751, and National Science Foundation under Grant No. DMR-0923107 for their generous funding. The authors would also like to thank Douglas Atwater for his assistance with programming and images.References
- R. B. Moore, J. E. Wilkerson and C. R. Martin, Anal. Chem., 1984, 56, 2572–2575 CrossRef CAS.
- K. A. Mauritz and R. B. Moore, Chem. Rev., 2004, 104, 4535–4586 CrossRef CAS.
- G. C. Dismukes, R. Brimblecombe, G. A. N. Felton, R. S. Pryadun, J. E. Sheats, L. Spiccia and G. F. Swiegers, Acc. Chem. Res., 2009, 42, 1935–1943 CrossRef CAS PubMed.
- H. Park, Y. Park, E. Bae and W. Choi, J. Photochem. Photobiol., A, 2009, 203, 112–118 CrossRef CAS PubMed.
- R. Ramaraj, A. Kira and M. Kaneko, Polym. Adv. Technol., 1995, 6, 131–140 CrossRef CAS PubMed.
- F. Taguchi, T. Abe and M. Kaneko, J. Mol. Catal. A: Chem., 1999, 140, 41–46 CrossRef CAS.
- L. Kavan and M. Graetzel, Electrochim. Acta, 1989, 34, 1327–1334 CrossRef CAS.
- H. Shiroishi, T. Shoji and M. Kaneko, J. Mol. Catal. A: Chem., 2002, 187, 47–54 CrossRef CAS.
- G. J. Yao, T. Onikubo and M. Kaneko, Electrochim. Acta, 1993, 38, 1093–1096 CrossRef CAS.
- J.-M. Zen, S.-L. Liou, A. S. Kumar and M.-S. Hsia, Angew. Chem., Int. Ed., 2003, 42, 577–579 CrossRef CAS PubMed.
- J. Park, J. Yi, T. Tachikawa, T. Majima and W. Choi, J. Phys. Chem. Lett., 2010, 1, 1351–1355 CrossRef CAS.
- E. Krausz, J. Chem. Soc., Faraday Trans. 1, 1988, 84, 827–840 RSC.
- T. D. Gierke, G. E. Munn and F. C. Wilson, J. Polym. Sci., Polym. Phys. Ed., 1981, 19, 1687–1704 CrossRef CAS PubMed.
- W. Y. Hsu and T. D. Gierke, J. Membr. Sci., 1983, 13, 307–326 CrossRef CAS.
- J. Redepenning and F. C. Anson, J. Phys. Chem., 1987, 91, 4549–4553 CrossRef CAS.
- K. Schmidt-Rohr and Q. Chen, Nat. Mater., 2008, 7, 75–83 CrossRef CAS PubMed.
- L. Li, L. Duan, Y. Xu, M. Gorlov, A. Hagfeldt and L. Sun, Chem. Commun., 2010, 46, 7307–7309 RSC.
- L. Rubatat, A. L. Rollet, G. Gebel and O. Diat, Macromolecules, 2002, 35, 4050–4055 CrossRef CAS.
- J. Li, J. K. Park, R. B. Moore and L. A. Madsen, Nat. Mater., 2011, 10, 507–511 CrossRef CAS PubMed.
- R. S. McLean, M. Doyle and B. B. Sauer, Macromolecules, 2000, 33, 6541–6550 CrossRef CAS.
- F. P. Orfino and S. Holdcroft, J. New Mater. Electrochem. Syst., 2000, 3, 287–292 Search PubMed.
- J. K. Park, J. Li, G. M. Divoux, L. A. Madsen and R. B. Moore, Macromolecules, 2011, 44, 5701–5710 CrossRef CAS.
- S. C. Yeo and A. Eisenberg, J. Appl. Polym. Sci., 1977, 21, 875–898 CrossRef CAS PubMed.
- J. A. Elliott, D. Wu, S. J. Paddison and R. B. Moore, Soft Matter, 2011, 7, 6820–6827 RSC.
- M. K. Mistry, N. R. Choudhury, N. K. Dutta, R. Knott, Z. Shi and S. Holdcroft, Chem. Mater., 2008, 20, 6857–6870 CrossRef CAS.
- L. Rubatat, G. Gebel and O. Diat, Macromolecules, 2004, 37, 7772–7783 CrossRef CAS.
- S. M. Arachchige, J. Brown and K. J. Brewer, J. Photochem. Photobiol., A, 2008, 197, 13–17 CrossRef CAS.
- S. M. Arachchige, J. R. Brown, E. Chang, A. Jain, D. F. Zigler, K. Rangan and K. J. Brewer, Inorg. Chem., 2009, 48, 1989–2000 CrossRef CAS PubMed.
- M. Elvington, J. Brown, S. M. Arachchige and K. J. Brewer, J. Am. Chem. Soc., 2007, 129, 10644–10645 CrossRef CAS PubMed.
- J. L. Colon and C. R. Martin, Langmuir, 1993, 9, 1066–1070 CrossRef CAS.
- C. R. Martin, I. Rubinstein and A. J. Bard, J. Am. Chem. Soc., 1982, 104, 4817–4824 CrossRef CAS.
- M. N. Szentirmay, N. E. Prieto and C. R. Martin, J. Phys. Chem., 1985, 89, 3017–3023 CrossRef CAS.
- M. J. Frisch, G. W. Trucks, H. B. Schlegel, G. E. Scuseria, M. A. Robb, J. R. Cheeseman, G. Scalmani, V. Barone, B. Mennucci, G. A. Petersson, H. Nakatsuji, M. Caricato, X. Li, H. P. Hratchian, A. F. Izmaylov, J. Bloino, G. Zheng, J. L. Sonnenberg, M. Hada, M. Ehara, K. Toyota, R. Fukuda, J. Hasegawa, M. Ishida, T. Nakajima, Y. Honda, O. Kitao, H. Nakai, T. Vreven, J. A. Montgomery Jr., J. E. Peralta, F. Ogliaro, M. J. Bearpark, J. Heyd, E. N. Brothers, K. N. Kudin, V. N. Staroverov, R. Kobayashi, J. Normand, K. Raghavachari, A. P. Rendell, J. C. Burant, S. S. Iyengar, J. Tomasi, M. Cossi, N. Rega, N. J. Millam, M. Klene, J. E. Knox, J. B. Cross, V. Bakken, C. Adamo, J. Jaramillo, R. Gomperts, R. E. Stratmann, O. Yazyev, A. J. Austin, R. Cammi, C. Pomelli, J. W. Ochterski, R. L. Martin, K. Morokuma, V. G. Zakrzewski, G. A. Voth, P. Salvador, J. J. Dannenberg, S. Dapprich, A. D. Daniels, Ö. Farkas, J. B. Foresman, J. V. Ortiz, J. Cioslowski and D. J. Fox, Gaussian, Inc., Wallingford, CT, USA, 2009.
- W. E. Cooley, C. F. Liu and J. C. Bailar, J. Am. Chem. Soc., 1959, 81, 4189–4195 CrossRef CAS.
- M.-H. Kim, C. J. Glinka, S. A. Grot and W. G. Grot, Macromolecules, 2006, 39, 4775–4787 CrossRef CAS.
- B. Loppinet, G. Gebel and C. E. Williams, J. Phys. Chem. B, 1997, 101, 1884–1892 CrossRef CAS.
- S. Logette, C. Eysseric, G. Pourcelly, A. Lindheimer and C. Gavach, J. Membr. Sci., 1998, 144, 259–274 CrossRef CAS.
- D. Reichenberg, J. Am. Chem. Soc., 1953, 75, 589–597 CrossRef CAS.
- D. K. Hale and D. Reichenberg, Discuss. Faraday Soc., 1949, 7, 79–90 RSC.
- K.-D. Kreuer and G. Portale, Adv. Funct. Mater., 2013, 23, 5390–5397 CrossRef CAS PubMed.
- R. Turse and W. Rieman, J. Phys. Chem., 1961, 65, 1821–1824 CrossRef CAS.
- M. Hatanaka and M. Hoshi, J. Appl. Polym. Sci., 2014, 131, 39358 CrossRef.
Footnote |
| † Deceased: October 24, 2014. |
| This journal is © The Royal Society of Chemistry 2015 |

