 Open Access Article
Creative Commons Attribution 3.0 Unported Licence
High molecular weight mechanochromic spiropyran main chain copolymers via reproducible microwave-assisted Suzuki polycondensation†
Lukas
Metzler
a,
Thomas
Reichenbach
b,
Oliver
Brügner
b,
Hartmut
Komber
c,
Florian
Lombeck
a,
Stefan
Müllers
a,
Ralf
Hanselmann
a,
Harald
Hillebrecht
d,
Michael
Walter
bef and
Michael
Sommer
*abf
aMakromolekulare Chemie, Universität Freiburg, Stefan-Meier-Straße 31, 79104 Freiburg, Germany. E-mail: michael.sommer@makro.uni-freiburg.de
bFreiburger Materialforschungszentrum, Stefan-Meier-Straße 21, 79104 Freiburg, Germany
cLeibniz Institut für Polymerforschung Dresden e.V., Hohe Straße 6, 01069 Dresden, Germany
dInstitut für Anorganische und Analytische Chemie, Albertstr. 21, 79104 Freiburg, Germany
eFraunhofer Institut für Werkstoffmechanik, Wöhlerstraße 11, 79108 Freiburg, Germany
fFreiburger Institut für Interaktive Materialien und Bioinspirierte Technologien, Georges-Köhler-Allee 105, D-79110 Freiburg, Germany
First published on 1st April 2015
Abstract
Suzuki–Miyaura polycondensation (SPC) is widely used to prepare a variety of copolymers for a broad range of applications. Although SPC protocols are often used in many instances, the limits of this method and issues of molecular weight reproducibility are not often looked at in detail. By using a spiropyran-based (SP) mechanochromic copolymer, we present an optimized protocol for the microwave-assisted synthesis of a mechanochromic, alternating copolymer P(SP-alt-C10) via SPC that allows the reproduction of molecular weight distributions. Several parameters such as microwave power, temperature, stoichiometry, and ligand are screened, leading to molecular weights up to Mw ∼ 174 kg mol−1. The process of optimization is guided by NMR end group analysis which shows that dehalogenation, oxidative deborylation and SP cleavage are the limiting factors that impede further increase of molar mass, while other classical side reactions such as protiodeborylation are not observed. Embossing films of P(SP-alt-C10) yields the colored merocyanine (MC) copolymer P(MC-alt-C10) that undergoes a thermally facilitated back reaction to P(SP-alt-C10). DFT suggests that the barrier of the SP → MC transition has two contributions, with the first one being related to the color change and the second one to internal bond reorganizations. The barrier height is 1.5 eV, which suggests that the ease of the thermally facilitated back reaction is either due to residual energy stored in the deformed polymer matrix, or arises from an MC isomer that is not in the thermodynamically most stable state.
Introduction
Suzuki–Miyaura polycondensation (SPC) was established by Schlüter et al. in the 1990s and is nowadays a standard method to many functional polymers with outstanding mechanical, gas storage, catalytic, luminescence, or opto-electronic properties.1–11 However, despite the frequent use of SPC, detailed and mechanistic studies that address the fundamental limits of this method are limited, which can be one factor for moderate molar masses obtained can be limited.12–18 Concomitant with relatively short chain lengths is the high content of end groups (EG). Depending on the nature and extent of EGs, a non-negligible influence on the material's properties can be expected. In particular, the EGs of conjugated polymers for use in opto-electronic devices are critical as they pose electronic defects which act as quenchers or traps for excited states and charge carriers.19,20 From a mechanistic point-of-view, EGs either represent intact chains or side or termination reactions that allow the limiting factors of polycondensation to be revealed.13,21,22 Given the molecular weight (MW) dependence of mechanical and opto-electronic properties of conjugated polymers, the optimization of molar mass guided by EG analysis appears to be a particularly fruitful task.4,23,24It is well-known that polymerizations in general and Suzuki–Miyaura cross-coupling reactions in particular can be accelerated by microwave radiation compared to classical thermal reactions.25–32 At the same time, improvements in purity, yield and the elimination of side reactions are prevalent, which add to the benefits of microwave-accelerated syntheses.27–30 Considering the Carothers equation and extensions thereof, the great advantages of such improvements for polycondensation are obvious.33,34 However, although the benefits of microwave-assisted SPC are well-recognized, comprehensive protocols are scarce.3,35–40 In order to further establish microwave-assisted protocols for transition metal-catalyzed polycondensations, it is important to develop reliable procedures that allow reproducible control over molar masses and hence the correlation of the materials’ properties with reaction parameters.
Spiropyrans are molecular switches which respond to multiple external stimuli.41 Due to the many different properties of the spiropyran (SP) and merocyanine (MC) forms, a rich equilibrium exists between the less polar, non-conjugated, and colorless SP form and the polar, conjugated, and colored MC form (and several protonated species).42 In addition to the various transformations of SP-based materials, mechanical cleavage of the C–O bond of SP was recently demonstrated by Moore et al. in solution and bulk using polymer chains that exhibit a single SP unit (mechanophore) at the mid-point of the chain.43,44 Since then, this concept has been extended to a variety of SP-based materials that are able to detect chain stretching by developing color.45–51 We have recently used Suzuki–Miyaura polycondensation to prepare alternating SP main chain copolymers with different comonomers.52,53 Our motivation to use SPC to prepare linear chains with multiple SP incorporation was based on the advantage of a high and tunable mechanophore density. Thus, color intensity can be adjusted to the needs of the experimental method and sample geometry. Another advantage is the possibility to exploit potential cooperative effects of SP → MC conversion to enhance or accelerate the responsiveness of the material. Such effects are well-known from SP side chain polymers, but have not yet been demonstrated in linear SP copolymers.54 In addition, the copolymerization of SP with an aromatic comonomer introduces mesomeric effects which alter the relative stabilities of SP and MC.53 Thus, certain pathways between individual species of the complex SP/MC equilibrium might be selectively addressed to generate stable species with high conversion.53,55,56 As the mechanical properties of any polymeric material generally depend on entanglements and molecular weight, the reproduction of high molar masses is important. This is especially relevant for polycondensation, where high molar masses critically depend on conversion, which in turn is a complex function of a multitude of parameters.
In this paper we disclose an optimized protocol for the microwave-assisted SPC of a mechanochromic copolymer with alternating SP units and a phenyl-based comonomer (C10-[B(pin)]2). Reproducible molecular weights of P(SP-alt-C10) up to weight-average molecular weights up to Mw = 174 kg mol−1 are achieved using a stock solution approach and the screening of several instrumental and chemical parameters. Variations in stoichiometry, ligand, concentration and amount of the base, power, time, and temperature were carried out. Our protocol further shows that good reproducibility can be obtained with monomer batch sizes as small as 80 mg. Side reactions during SPC are monitored by 1H NMR end group analysis, revealing dehalogenation, SP cleavage and oxidative deborylation as main sources that limit further increase in molar mass. Compared to analogous thermal polycondensations, the polymerization time is reduced from days to hours, the molecular weight is higher, and the color of the SP copolymers is much lighter after hot-pressing. Embossed films of P(SP-alt-C10) exhibit a green color which rapidly disappears on annealing well below the glass transition temperature (∼60 °C, Tg 129 °C) despite a relatively high barrier of 1.5 eV for the MC → SP back reaction and very similar energies of SP and MC. This suggests that either energy is stored during the embossing process which is released rapidly at 60 °C, or that the MC form is not able to find its most stable state during embossing.
Experimental
Materials
All starting materials were purchased from Sigma Aldrich. SPBr2 and C10-[B(pin)]2 were prepared according to recently published procedures.52,53 Single crystals of C10-[B(pin)]2 were prepared in toluene at 0.125 mol l−1 at room temperature and left in the fridge at 4 °C for ten days, collected, and dried at 50 °C. All monomers, ligands and Pd2dba3 were stored under ambient conditions.Instrumentation
All polymerizations were carried out in a CEM Discover-SP microwave reactor and controlled with the Synergy 1.59 software. To generate conditions as reproducible as possible, all reactions were performed in 10 mL reaction vessels (a change to larger vials requires optimization again due to the different penetration depth of microwave radiation, hence for larger batches thermal heating might be the better choice) under argon with a Teflon septum cap and identical magnetic stir bars. Molecular weights were measured via SEC on a PSS SECcurity HP1200 G1310A from PSS with three columns of pore sizes of 102, 103, and 104 Å and a guard column (PSS). Calibration was done using polystyrene standards. THF was used as the eluent at room temperature at a flow rate of 1.0 mL min−1. 1H NMR (500.13 MHz) and 13C (125.77 MHz) NMR spectra were recorded on a Bruker Avance III 500 spectrometer using a 5 mm 1H/13C/19F/31P gradient probe. All spectra were recorded at 30 °C in CDCl3 as the solvent, and were referenced to the residual solvent peak δ (1H) 7.26 ppm; δ (13C) 77.0 ppm. 1H–1H and 1H–13C correlated 2D NMR spectra were recorded to verify the signal assignments using standard pulse sequences included in the Bruker TOPSPIN 2.1 software package. The crystal structure data were collected at 100 K on a Bruker SMART APEX2 CCD area detector diffractometer while using Mo-Kα radiation from a microsource (space group P![[1 with combining macron]](https://www.rsc.org/images/entities/char_0031_0304.gif) , Z = 4, a = 9.7994(3), b = 12.6632(3), c = 14.5262(4) Å, α = 96.185(1), β = 99.296(2), γ = 109.868(2)°). Data reduction was performed with SAINT (Madison, Wisconsin, USA, 2013), and scaling of the data and absorption correction was performed by SADABS-2012/1 (G. M. Sheldrick, SADABS 2012/1, University of Göttingen, Germany, 2012). The structure was solved by intrinsic phasing using SHELXT (G. M. Sheldrick, SHELXT, University of Göttingen, Germany, 2013) and refined by full-matrix least-squares minimization on F2 using all reflections with SHELXL (5811 reflections (4733 with I > 2σ(I)), 388 parameters, R1 = 0.042, wR2 = 0.121).57 The graphical representations were prepared using the software Diamond 3.2i.58 CCDC 1034507 contains the supplementary crystallographic data.
, Z = 4, a = 9.7994(3), b = 12.6632(3), c = 14.5262(4) Å, α = 96.185(1), β = 99.296(2), γ = 109.868(2)°). Data reduction was performed with SAINT (Madison, Wisconsin, USA, 2013), and scaling of the data and absorption correction was performed by SADABS-2012/1 (G. M. Sheldrick, SADABS 2012/1, University of Göttingen, Germany, 2012). The structure was solved by intrinsic phasing using SHELXT (G. M. Sheldrick, SHELXT, University of Göttingen, Germany, 2013) and refined by full-matrix least-squares minimization on F2 using all reflections with SHELXL (5811 reflections (4733 with I > 2σ(I)), 388 parameters, R1 = 0.042, wR2 = 0.121).57 The graphical representations were prepared using the software Diamond 3.2i.58 CCDC 1034507 contains the supplementary crystallographic data.
Simulations
The simulations were performed using density functional theory (DFT) where the exchange–correlation energy was approximated at the generalized gradient-corrected approximation as devised by Perdew et al.59 Density and wave-functions were represented on real space grids using the projector augmented wave method devised by Blöchl60 as implemented in the GPAW package.61,62 A grid spacing of 0.2 Å was used for the wave functions. The structures were relaxed in the gas-phase without any symmetry constraints until all forces were found to be below 0.05 eV Å−1. The transition path between SP and MC was explored using the nudged elastic band method.63General comments to the stock solution approach
The prerequisite to screen many parameters of a SPC reproducibly is a sufficiently large amount of highly pure monomer if powders are directly weighed into the polymerization vessel. In the case of functional monomers, this is not a realistic scenario as monomer scale-up can be highly expensive and time consuming. In addition, the outcome of a screening study is not certain and hence such huge efforts might not be rewarded with success. To develop a reproducible and easy to handle polymerization procedure using small quantities of monomer, stock solutions of monomers, sources of palladium, and ligands were used here. As will be reported, the most important factors to be controlled are stoichiometry and amount of catalyst. Generally, all stock solutions were prepared in degassed toluene and needed to be used in 1–2 days to avoid crystallization of C10-[B(pin)]2 and degradation of Pd2dba3. A high boiling point solvent seems prerequisite to avoid changes in concentration during pipetting. The monomer stock solutions prepared in air were then transferred into the microwave vials via pipette and degassed with argon. Catalyst and ligand were added as stock solutions (prepared in dried Schlenk tubes under argon) subsequently under a back stream of argon. All polymerizations were carried out in a CEM Discover microwave reactor with constant temperature and constant irradiation for indicated times.General procedure for microwave-assisted SPC
To a 10 mL microwave vial 2 mL of a 2 M K2CO3 solution in water (20 equiv.) and one droplet of pure Aliquat® 336 were added. 1 mL of each of the monomer stock solutions was added (typical size of a monomer stock solution: 2.435 mmol/25 ml toluene, i.e. 1093.8 mg SPBr2 and 1408.4 mg C10-[B(pin)]2). Thus, (1,10-bis(4-(4,4,5,5-tetramethyl-1,3,2-dioxaborolan)-phenoxy)decane, C10-[B(pin)]2: 97.4 μmol, 1.00 equiv. and 5,6′-bis(brom)-1-ethyl-3,3-dimethylspiro[2H-1-benzopyran-2,2′-indol], SPBr2: 1.00 equiv., 97.4 μmol) were added, the fill height was marked, and the mixture was stirred and purged with argon for 30 minutes. The typical size of the Pd2dba3 stock solution was 2.0 mg Pd2dba3 in 1 mL degassed toluene. From this stock solution, 223 μL (0.50 mol%, 0.487 μmol) was added. The typical size of the SPHOS stock solution was 2.0 mg SPHOS in 1 mL degassed toluene. From this stock solution, 398 μL (2 mol%, 1.94 μmol) was added. The mixture was stirred and purged with argon, which led to evaporation of toluene, until an overall fill height corresponding to 3.4 mL was achieved. Assuming that only toluene evaporated, the final monomer concentration was ∼0.14 M. The vessel was then transferred into the microwave reactor. The reaction was carried out at various temperatures, microwave powers, and times, whereby the independent variation of power and temperature was enabled by different cooling rates with air (for example: 90 °C, 31 W, 2 h). The stirring speed “high” was selected; this parameter was not varied but is likely to be important as it determines the interfacial area between the aqueous and organic phase. The mixture was cooled to room temperature, separated from the aqueous phase, precipitated into methanol, filtered, and dried at 50 °C overnight. All reported molecular weights are taken from as-precipitated samples without any re-precipitation, fractionation, or Soxhlet extraction.Results and discussion
Optimization of SPC conditions
 | ||
| Scheme 1 Suzuki polycondensation of a spiropyran monomer (SPBr2) with a flexible comonomer (C10-[B(pin)]2) under various conditions. | ||
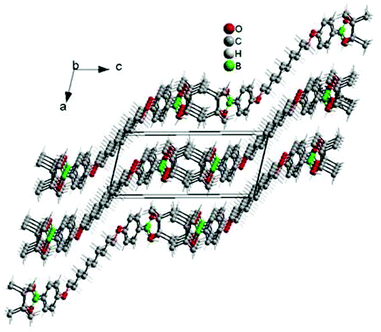
To maximize monomer purity for polycondensation, single crystals of the boronic ester monomer C10-[B(pin)]2 were grown from toluene. C10-[B(pin)]2 shows an interesting solid state structure in which all parts of the molecule (i.e. methyl groups, boron, oxygen, phenyl rings and C-10 alkyl chain segment) segregate into domains of equal atoms (Fig. 1). Single crystal data collected at room temperature show a centrosymmetric triclinic unit cell with a halved volume containing two molecules. All distances correspond to the expected values. The thermal displacement parameters of the atoms of the terminal boronic ester group are enlarged according to a higher thermal motion. While no residual solvent was seen in the single crystal structure, 1H NMR spectroscopy showed residual solvents (ethanol and toluene), and as a result, decreased purities of >98.1% for SPBr2 and to >99.1% for C10-[B(pin)]2. Interestingly, prolonged storage of the monomers at 60 °C under vacuum did not remove residual solvent. While these values may seem too low for polycondensation, we will show that the presented approach allows for empiric tuning of stoichiometry which is needed to achieve high molar masses, and this way the effect of residual solvent on stoichiometry can be compensated for.
| Entry | Parameter varied | Power/W | Temp./°C | Time/min | [SPBr2]![[thin space (1/6-em)]](https://www.rsc.org/images/entities/char_2009.gif) : :![[thin space (1/6-em)]](https://www.rsc.org/images/entities/char_2009.gif) [BSE] [BSE] |
Ligand | M n/kDa | M w/kDa | |
|---|---|---|---|---|---|---|---|---|---|
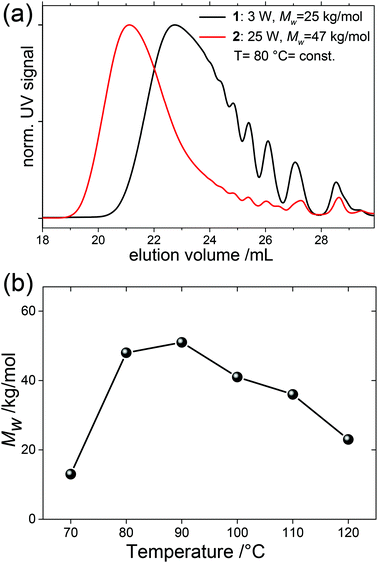
| 1 | μW power | 3 | 80 | 120 | 1 | SPhos | 11.6 | 24.8 | |
| 2 | 25 | 80 | 120 | 1 | SPhos | 17.7 | 46.7 | ||
| 3 | Reaction temperature | 20 | 70 | 120 | 1 | SPhos | 8.4 | 12.9 | |
| 4 | 25 | 80 | 120 | 1 | SPhos | 20.3 | 47.7 | ||
| 5 | 31 | 90 | 120 | 1 | SPhos | 20.1 | 50.8 | ||
| 6 | 35 | 100 | 120 | 1 | SPhos | 18.6 | 40.5 | ||
| 7 | 43 | 110 | 120 | 1 | SPhos | 17.1 | 36.2 | ||
| 8 | 62 | 120 | 120 | 1 | SPhos | 12.5 | 22.9 | ||
| 9 | Stoichiometry | 31 | 90 | 120 | 0.96 | SPhos | 28.3 | 69.3 | |
| 10 | 31 | 90 | 120 | 0.97 | SPhos | 22.9 | 53.1 | ||
| 11 | 31 | 90 | 120 | 0.98 | SPhos | 35.6 (28.6) | 110.3 (108.1) | ||
| 12 | 31 | 90 | 120 | 0.99 | SPhos | 21.2 (16.5) | 57.3 (39.5) | ||
| 5 | 31 | 90 | 120 | 1 | SPhos | 20.1 (16.0) | 50.8 (42.6) | ||
| 13 | 31 | 90 | 120 | 1.01 | SPhos | 15.0 (20.3) | 34.0 (59.1) | ||
| 14 | 31 | 90 | 120 | 1.02 | SPhos | 18.2 (16.7) | 42.0 (37.1) | ||
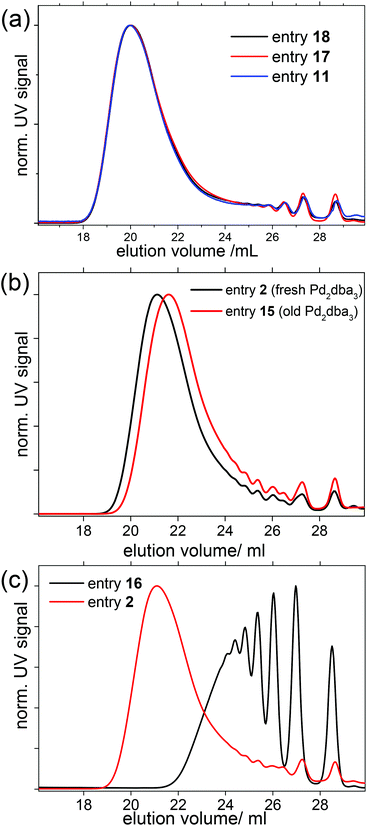
| 2 | Reproducibility | Pd fresh | 25 | 80 | 120 | 1 | SPhos | 17.7 | 46.7 |
| 15 | Pd old | 25 | 80 | 120 | 1 | SPhos | 16.2 | 33.8 | |
| 16 | m Crystallized | 31 | 90 | 120 | 1 | SPhos | 3.9 | 7.4 | |
| 11 | To be reproduced | 31 | 90 | 120 | 0.98 | SPhos | 35.6 | 110.3 | |
| 17 | Repeat 1 | 31 | 90 | 120 | 0.98 | SPhos | 25.8 | 104.0 | |
| 18 | Repeat 2 | 31 | 90 | 120 | 0.98 | SPhos | 28.6 | 108.0 | |
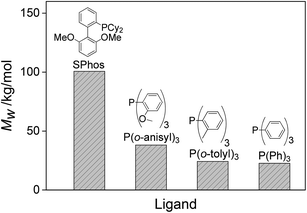
| 17 | Ligand | 31 | 90 | 120 | 0.98 | SPhos | 25.8 | 104.0 | |
| 19 | 31 | 90 | 120 | 0.98 | P(o-tolyl) 3 | 12.7 | 25.1 | ||
| 20 | 31 | 90 | 120 | 0.98 | P(o-anisyl) 3 | 11.4 | 23.3 | ||
| 21 | 31 | 90 | 120 | 0.98 | PPh 3 | 15.5 | 37.1 | ||
| 22 | Temperature and time | 31 | 90 | 10 | 0.98 | SPhos | 11.2 | 21.9 | |
| 23 | 31 | 90 | 30 | 0.98 | SPhos | 21.9 | 94.1 | ||
| 24 | 31 | 90 | 120 | 0.98 | SPhos | 24.5 | 97.7 | ||
| 25 | 31 | 90 | 180 | 0.98 | SPhos | 21.5 | 77.6 | ||
| 26 | 20 | 70 | 60 | 0.98 | SPhos | 4.7 | 6.7 | ||
| 27 | 20 | 70 | 120 | 0.98 | SPhos | 33.8 | 110.7 | ||
| 28 | 20 | 70 | 180 | 0.98 | SPhos | 26.8 | 157.6 | ||
| 29 | 20 | 70 | 300 | 0.98 | SPhos | 34.8 | 173.9 | ||
![[thin space (1/6-em)]](https://www.rsc.org/images/entities/char_2009.gif) :
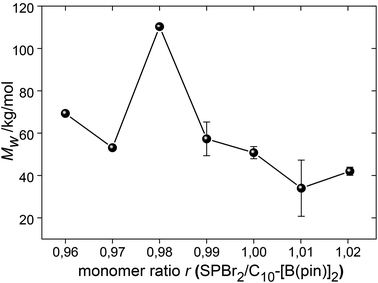
:![[thin space (1/6-em)]](https://www.rsc.org/images/entities/char_2009.gif) 1 ratio of bifunctional AA and BB monomers is needed to maximize MW.33,64,65 Schlüter et al. emphasize that monomer purity and amount is critical for the high MW and reproducibility of a SPC reaction.3,35 The stock solution approach is ideal for working with small amounts of monomer, and also to rule out systematic errors and errors from impurities or residual solvents. Thus, the monomer ratio r = SPBr2:C10-[B(pin)]2 was easily varied from 0.96 to 1.02 in steps of 1% (corresponding to variations in volume of 1 μL) (entries 9–14, Fig. 3) without taking the different purities of the two monomers into account.
1 ratio of bifunctional AA and BB monomers is needed to maximize MW.33,64,65 Schlüter et al. emphasize that monomer purity and amount is critical for the high MW and reproducibility of a SPC reaction.3,35 The stock solution approach is ideal for working with small amounts of monomer, and also to rule out systematic errors and errors from impurities or residual solvents. Thus, the monomer ratio r = SPBr2:C10-[B(pin)]2 was easily varied from 0.96 to 1.02 in steps of 1% (corresponding to variations in volume of 1 μL) (entries 9–14, Fig. 3) without taking the different purities of the two monomers into account.
Somewhat unexpectedly, a slight excess of C10-[B(pin)]2 of 2% led to the highest Mw ∼ 110 kg mol−1. Due to the slightly lower purity of SPBr2, a value r > 1 could have been expected to give a maximum Mw. However, Mw was doubled for r = 0.98 compared to r = 1.00 (Fig. 3). While a similar trend has previously been reported, it is not clear what exactly causes the slight excess of boronic ester to yield higher molar masses.53 Contaminants such as oxygen, water, or deborylation were discussed, and Schlüter et al. mentioned that this effect vanishes for gram scale experiments.3 However, while the exact reason for the need of an excess of boronic ester remains unknown, the herein used stock solution approach clearly allows the maximization of MW from an empiric point of view. This set of experiments was repeated (except for r = 0.96 and 0.97), which confirmed r = 0.98 as the most appropriate monomer ratio in order to maximize MW. The molecular weight obtained for r = 0.96 did not fit in the row, which may have been caused by invisible crystallization of C10-[B(pin)]2 at the glass wall of the stock solution from which the monomer was taken, which would have led to a reduction of the concentration of C10-[B(pin)]2 and a shift of r back towards 0.98.
Mechanistic investigations
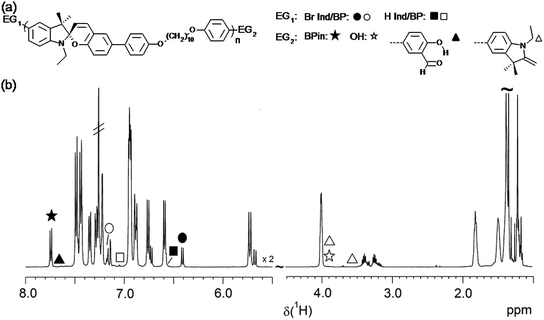 | ||
| Fig. 6 (a) Chemical structures of observed end groups. (b) Overview of full 1H NMR spectrum of a selected low MW sample of P(SP-alt-C10) with indicated chemical shifts of all possible end groups. | ||
Fig. 7 displays the regions of EGs of interest for several P(SP-alt-C10) samples polymerized at different temperatures (samples from Fig. 2b). From this figure the occurrence of a maximum in molar mass at 90 °C (cf.Fig. 2) can immediately be understood. At 70 °C, conversion is low as seen by the large amount of boronic acid pinacol ester and bromine EGs, resulting in low MW. At 80 °C, the boronic acid pinacol ester EGs have already vanished completely, while some of the bromine EGs are still visible. At the same time, SP units are being cleaved as can be seen most clearly by the sharp singlet at ∼10 ppm (salicylaldehyde end group, the broad and sometimes visible signal at ∼11 pm arises from the neighboring OH group) and the two doublets at 3.9 and 3.6 ppm (methyleneindoline end group). These side reactions are seen already at 70 °C to a very small extent and become much more pronounced at 110 °C. Consequently, it is the compromise between the highest conversion and lowest degree of SP cleavage that causes the maximum MW seen in Fig. 2b.
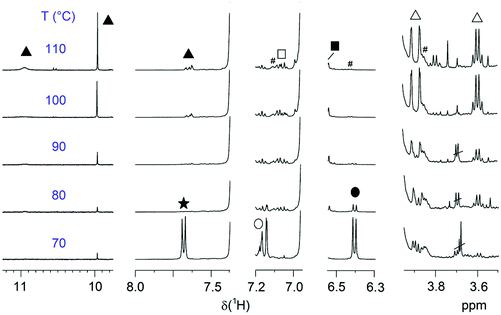 | ||
| Fig. 7 Regions of relevant end groups of entries 3–8 polymerized at different temperatures for a constant time of 2 h. EG symbols correspond to Fig. 6a. The spectra are normalized to the backbone signal of OCH2 (3.99 ppm). # marks 13C satellites. | ||
From Fig. 7 it is obvious that in order to further improve molar mass the elimination of SP cleavage is most promising. To this end, we subjected prepolymerized P(SP-alt-C10) to the same microwave reaction conditions as used for polymerization, but in the absence of catalyst, and monitored the cleavage process at 70 °C and 90 °C for different times by SEC (Fig. 8a).
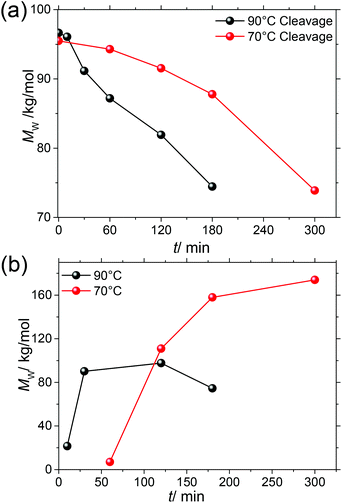 | ||
| Fig. 8 (a) The SP cleavage process is monitored by SEC for 70 and 90 °C in the absence of a catalyst. (b) Evolution of Mw with time for 70 and 90 °C (entries 22–29). | ||
At both temperatures, MW decreases with time, but the decrease at 70 °C is slower. We therefore investigated the evolution of MW during SPC at these two temperatures with time (Table 1, entries 22–29, Fig. 8b). Again, in agreement with the good reproducibility of the SPC protocol, the highest Mw ∼ 100 kg mol−1 was obtained after 2 h at 90 °C, and Mw > 80 kg mol−1 was already obtained after ∼30 min. For reaction times longer than 2 h SP cleavage led to a reduction of the attained chain length. The situation is much different at 70 °C, at which temperature ∼3 h are needed to reach a near-plateau region of Mw = 174 kg mol−1, which is now accessible due to suppressed SP cleavage. It can also be anticipated that even higher MWs might be achieved in both cases in the absence of SP cleavage. To extract more mechanistic differences between the series of polymerizations run at 70 and 90 °C, the EGs of these samples were again investigated by NMR spectroscopy. Fig. 9 shows the same regions of interest as a function of reaction time. It is obvious that next to the reduced SP cleavage at 70 °C, the reaction is much slower at this temperature. While at 90 °C almost all boronic acid pinacol ester EGs have disappeared after ∼30 min, a comparable situation is found at 70 °C after ∼180 min. However, another difference is an increased degree of debromination at 90 °C, seen by the SP-H EGs (cf.Fig. 6). The absence of this side reaction at 70 °C might additionally contribute to the higher MW plateau that can be reached at reduced temperature. Dehalogenation is commonly observed in basically all Pd-catalyzed polycondensations such as SPC, direct arylation polycondensation, or Stille polycondensation.21,53,70–74 What is observed at 70 °C, however, is the presence of phenolic end groups demonstrated by the characteristic triplet at 3.89 ppm (comparison with 4-heptylphenol as model compound) as a result of oxidative deborylation.68 This side reaction is usually accompanied by boronic acid ester homocoupling, detection of which is not possible here. Thus, hydroxylated EGs can be used as markers to identify SPCs in which invasion of oxygen could not be impeded.21 As this characteristic triplet is already present from the beginning of the polymerization at 70 °C, we can exclude the possibility of oxygen contamination during prolonged reaction times and hence conclude that oxygen must have been present from the beginning due to incomplete degassing. We also note that the occurrence of this side reaction at 70 °C is only apparently coincidental, as the slower kinetics of the reaction at 70 °C leave much more time for other reactions such as oxidative deborylation.
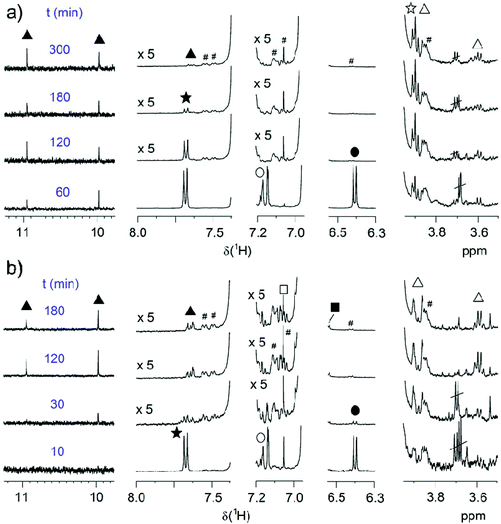 | ||
| Fig. 9 Time-dependent evolution of EGs of P(SP-alt-C10) at a) 70 °C (entries 26–29) and (b) 90 °C (entries 22–25). EG symbols correspond to Fig. 6a. The spectra are normalized to the backbone signal of OCH2 (3.99 ppm). # marks 13C satellites. | ||
As the experimental parameters applied here were always the same, we assumed that residual oxygen had also been present in all other polymerization entries, but was simply not detected due to the fast consumption of C10-[B(pin)]2 at 90 °C. We also note that the small degree of hydroxyl-end capped chains does not seem to affect molar mass negatively. Thus, these detailed NMR end group analyses not only allow optimizing SPC reactions through the identification and elimination of side reactions, but also enable a detailed understanding of the factors that limit conversion to approach unity.
Ring molecules
An extension of the Carothers equation includes the possibility of cyclic molecules at any stage of a step-growth polymerization.34 Since the formation of ring molecules does not alter the ratio of functional groups, it does not limit maximum conversion. This is not the case for the molecular weight distribution. If a significant amount of cyclic molecules is formed, molar mass is lower, dispersity can be higher, and the number average molecular weights determined by NMR end group analysis are overestimated. In P(SP-alt-C10), the flexible alkyl chain of the comonomer C10-[B(pin)]2 should permit ring formation. However, differently than for strained fully aromatic rings, the chemical shifts of the flexible rings formed here are unlikely to differ much from the linear analogs.17 In a P(SP-alt-C10) sample with low molar mass (Mw = 21.9 kg mol−1, entry 22), different series of oligomers were detected via MALDI-TOF mass spectrometry. Besides the expected series of oligomers with all combinations of Br- and/or Bpin-EGs, ring molecules with sizes n = 2–6 were clearly identified (Fig. 10a). The presence of all these oligomers shows that the SPC reaction takes place as expected, and the presence of ring molecules is in line with the flexibility of the comonomer C10-[B(pin)]2.75 The MALDI-TOF mass spectrum of an unfractionated high molar mass sample (Mw = 174 kg mol−1, entry 29), only exhibited the peak series of the ring molecules (Fig. 10b), as all other chains were too large to be detected. Thus, we can assume that larger rings are present as well, but these are simply invisible by both NMR spectroscopy and MALDI-TOF. The occurrence of cyclic molecules can also explain the several signals of the SEC curves at large elution volume (see Fig. 4).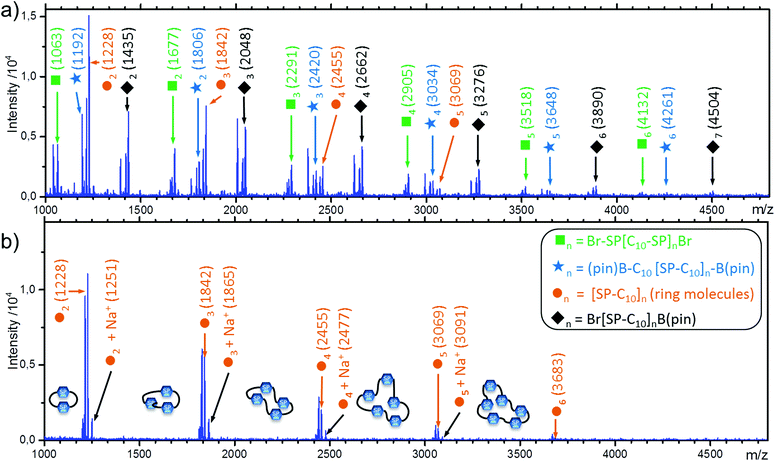 | ||
| Fig. 10 MALDI-TOF analysis of unfractionated polymers with a) Mw = 21.5 kg mol−1 and b) Mw = 174 kg mol−1. | ||
Mechanically-induced SP → MC isomerization
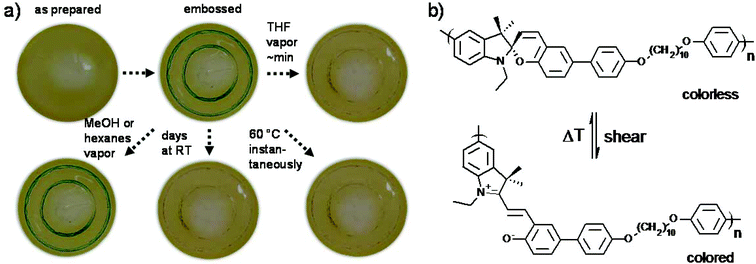
The typical experiment for verifying the mechanochromic response of a polymeric material is a stress–strain test.44–50 However, the high Tg of P(SP-alt-C10) of 129 °C and its non-ductile character did not allow for such experiments, as films ruptured before developing color. Plasticizing the material or stress–strain under elevated temperature can circumvent this behavior, which was not attempted here.76 The light-induced SP → MC isomerization did not occur within the time scales investigated (not shown), most likely due to the high Tg of P(SP-alt-C10).77 Instead, the mechanochromic response was assessed by embossing films of P(SP-alt-C10) with a metal stamp (Fig. 11). These conditions led to the development of a green color at the embossed regions, which we found to be metastable. Embossed films kept their color for about 2–3 d at room temperature before undergoing a back reaction to the SP form. Under solvent vapor annealing with good solvents such as THF, the films lost color within about minutes, but in non-solvents such as hexanes or methanol this effect was absent. Interestingly, thermal annealing at temperatures >60 °C discolored embossed films instantaneously. From these experiments, it is evident that the back reaction is facilitated with increasing mobility within the film, which is either induced by solvent vapor or thermal annealing.An interesting question is as to why a green color is observed, which is unusual compared to known SP derivatives.1 We assume that this color is caused by two factors, (i) phenyl substitution para to the phenolate part of the MC form, and (ii) due to aggregation effects arising from the high SP density in the film. However, aggregation effects are more complex as a result of the different types of alignment of the dipole moments. This will be looked at in detail in future investigations. Meanwhile, a comparison of this behaviour with several reported SP polymer architectures is not straightforward, as several parameters are different. First, in most cases a common SP derivative carrying a nitro group in 6-position is used, while a phenyl ring was employed here.44,45,47–50,76 Second, the position of polymer chain linkage is different as well, which is likely to be important for the mechanochromic response, although this detail has not yet been investigated consistently.44 Third, the mentioned difference of the glass transition temperature strongly influences mechanochromic activation.76 Clarifying whether the external force is transduced to the SP unit by putting strain on the polymer chains or simply transferred through the glassy and stiff nature of P(SP-alt-C10) is not trivial and not attempted here. To this end, the potential mechanochromic behavior of low molar mass SP derivatives that are not covalently linked to a polymer chain but rather dispersed in a glassy polymer matrix of varying Tg might help, which will be addressed by future experiments. The possible reasons of the thermally facilitated back reaction appeared to be most interesting. To obtain a deeper understanding, the energetics and the nature of the transition barrier of the SP → MC reaction of the model compound SP-Ph-OMe were elucidated in the gas phase via density functional theory (DFT, Fig. 12).53 This model compound exhibits the same substitution pattern on the benzopyran side of P(SP-alt-C10) and thus represents the relevant SP chromophore. Importantly, we did not model the force-activated SP → MC isomerization directly, but rather looked at the energetics of the SP and MC forms as well as the height of the barrier between the two states. The investigation of the barrier is especially interesting for the discussion of the thermally accelerated MC → SP back reaction as discussed below.
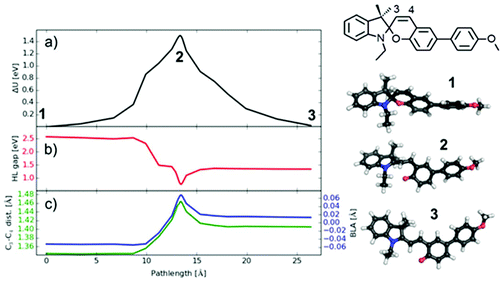
The energetics of the transition path obtained from DFT are displayed in Fig. 12a, where the path length is defined as the geometrically added distances between all atomic positions (corresponding to a mechanical experiment). The energies of SP and MC isomers differ by 0.02 eV (the lowest energy TTC isomer is investigated here, which is slightly lower than the CTT isomer treated by Komber et al.53), but are separated by a high barrier of 1.54 eV in agreement with barrier heights found in other spiropyrans.41,78 The barrier consists of two contributions: a first shoulder at 10 Å path length followed by the highest energy around 14 Å path length. Interestingly, the C–O bond breaks at the position of the first shoulder, as seen by the sharp drop in the energy gap between the highest occupied (HOMO) and lowest unoccupied molecular orbital (LUMO) (Fig. 12b), showing a color change when MC is formed. The successive barrier at 14 Å path length arises from an internal rotation of the two halves of the molecule and affects the color less. The additional dip in the HOMO/LUMO gap in this region is related to the necessary bond reorganization that can be characterized by the bond length alternation (BLA) value78 or equivalently by the length of the C3–C4 bond (see Fig. 12). This bond has a double bonding character in SP (as compared to the CC bond length of 1.33 Å in ethylene) and exhibits a mixed character in MC (the single bond in ethane has 1.52 Å). Exactly in the region of the barrier this bond takes a more single character which is energetically unfavorable.
The energy difference between SP and MC is very small and the isomers are separated by a large barrier. This suggests very little probability for a back transition to SP once MC is formed under the experimental conditions (thermal energy is 0.03 eV at 60 °C), and decoloration via temperature observed here has to be caused by other effects. One possibility could be that the rather stiff polymer matrix does not allow the MC form to find its most stable TTC form. In other words, a possible restriction of the internal rotation would leave the MC form in a final state of higher energy, from which a thermally-induced back reaction could be possible even at low temperatures. An alternative explanation is that energy is stored in the deformed polymer matrix during the embossing process which can be released very fast at 60 °C, and which is sufficient to overcome the barrier between MC and SP. If so, this decoloration process might pose a possibility to directly visualize relaxation processes in polymeric materials.
Conclusions
We have presented an optimized microwave-assisted protocol towards the reproducible synthesis of a high molecular weight mechanochromic copolymer on a small scale by Suzuki–Miyaura polycondensation. Using this protocol, small amounts of monomer can be copolymerized with good molecular weight reproducibility, which enables the screening of a large number of experimental parameters for a limited amount of monomer available. The herein screened parameters included stoichiometry, base, ligand, time, temperature, and power. The process of optimization was guided by NMR end group analysis, which revealed base-induced cleavage of spiropyran (SP), dehalogenation, and oxidative deborylation as side reactions. Lower temperatures decreased the extent of SP cleavage and dehalogenation, which enabled higher molar masses of P(SP-alt-C10) up to Mw = 174 kg mol−1 to be obtained for longer reaction times. The copolymer exhibits an interesting mechanochromic behavior. Embossed films are stained green at regions of high shear forces and decolorize fast at temperatures well-below the glass transition temperature, despite a relatively high barrier of 1.54 eV. These results might be an indication that energy can be stored in the polymer matrix by embossing, release of which can be visualized by the MC → SP back reaction. Possible task fields of such SP copolymers with a high glass transition temperature involve applications in which high shear fields and/or relaxation processes in polymeric materials are to be visualized by reversible color changes.Author contributions
The manuscript was written through contributions of all authors. All authors have given approval to the final version of the manuscript.Funding sources
The Fonds der Chemischen Industrie (FCI) and the Innovationsfond Forschung of the Universität Freiburg are greatly acknowledged for funding.Acknowledgements
The authors thank M. Hagios for GPC measurements. Computational resources from FZ Jülich are gratefully acknowledged.References
- M. Rehahn, A. D. Schlüter, G. Wegner and W. J. Feast, Polymer, 1989, 1060–1062 CrossRef CAS.
- A. D. Schlüter, J. Polym. Sci., 2001, 39, 1533–1556 CrossRef PubMed.
- J. Sakamoto, M. Rehahn, G. Wegner and A. D. Schlüter, Macromol. Rapid Commun., 2009, 30, 653–687 CrossRef CAS PubMed.
- R. Kandre, K. Feldman, H. E. H. Meijer, P. Smith and A. D. Schlüter, Angew. Chem., Int. Ed., 2007, 46, 4956–4959 CrossRef CAS PubMed.
- Y. Xu, S. Jin, H. Xu, A. Nagai and D. Jiang, Chem. Soc. Rev., 2013, 42, 8012–8031 RSC.
- F. Vilela, K. Zhang and M. Antonietti, Energy Environ. Sci., 2012, 5, 7819–7832 CAS.
- F. Wang, J. Mielby, F. H. Richter, G. Wang, G. Prieto, T. Kasama, C. Weidenthaler, H.-J. Bongard, S. Kegnæs, A. Fürstner and F. Schüth, Angew. Chem., Int. Ed., 2014, 53, 8645–8648 CrossRef CAS PubMed.
- A. C. Grimsdale, K. Leok Chan, R. E. Martin, P. G. Jokisz and A. B. Holmes, Chem. Rev., 2009, 109, 897–1091 CrossRef CAS PubMed.
- P. M. Beaujuge and J. R. Reynolds, Chem. Rev., 2010, 110, 268–320 CrossRef CAS PubMed.
- D. T. McQuade, A. E. Pullen and T. M. Swager, Chem. Rev., 2000, 100, 2537–2574 CrossRef CAS PubMed.
- Y.-J. Cheng, S.-H. Yang and C.-S. Hsu, Chem. Rev., 2009, 109, 5868–5923 CrossRef CAS PubMed.
- F. E. Goodson, T. I. Wallow and B. M. Novak, Macromolecules, 1998, 31, 2047–2056 CrossRef CAS.
- M. Jayakannan, J. L. J. van Dongen and R. A. J. Janssen, Macromolecules, 2001, 34, 5386–5393 CrossRef CAS.
- Z. Bo and A. D. Schlüter, Chem. – Eur. J., 2000, 6, 3235–3241 CrossRef CAS.
- J. Murage, J. W. Eddy, J. R. Zimbalist, T. B. McIntyre, Z. R. Wagner and F. E. Goodson, Macromolecules, 2008, 41, 7330–7338 CrossRef CAS.
- M. Liu, Y. Chen, C. Zhang, C. Li, W. Li and Z. Bo, Polym. Chem., 2013, 4, 895–899 RSC.
- B. Hohl, L. Bertschi, X. Zhang, A. D. Schlüter and J. Sakamoto, Macromolecules, 2012, 45, 5418–5426 CrossRef CAS.
- M. Jayakannan, X. Lou, J. L. J. van Dongen and R. A. J. Janssen, J. Polym. Sci., Part A: Polym. Chem., 2005, 43, 1454–1462 CrossRef CAS PubMed.
- Y. Kim, S. Cook, J. Kirkpatrick, J. Nelson, J. R. Durrant, D. D. C. Bradley, M. Giles, M. Heeney, R. Hamilton and I. McCulloch, J. Phys. Chem. C, 2007, 111, 8137–8141 CAS.
- J. K. Park, J. Jo, J. H. Seo, J. S. Moon, Y. D. Park, K. Lee, A. J. Heeger and G. C. Bazan, Adv. Mater., 2011, 23, 2430–2435 CrossRef CAS PubMed.
- M. Sommer, H. Komber, S. Huettner, R. Mulherin, P. Kohn, N. C. Greenham and W. T. S. Huck, Macromolecules, 2012, 45, 4142–4151 CrossRef CAS.
- H. Komber, V. Senkovskyy, R. Tkachov, K. Johnson, A. Kiriy, W. T. S. Huck and M. Sommer, Macromolecules, 2011, 44, 9164–9172 CrossRef CAS.
- R. J. Kline, M. D. McGehee, E. N. Kadnikova, J. Liu and J. M. J. Fréchet, Adv. Mater., 2003, 15, 1519–1522 CrossRef CAS PubMed.
- A. Gasperini and K. Sivula, Macromolecules, 2013, 46, 9349–9358 CrossRef CAS.
- F. Wiesbrock, R. Hoogenboom, M. Leenen, S. F. G. M. van Nispen, M. van der Loop, C. H. Abeln, A. M. J. van den Berg and U. S. Schubert, Macromolecules, 2005, 38, 7957–7966 CrossRef CAS.
- K. Kempe, C. R. Becer and U. S. Schubert, Macromolecules, 2011, 44, 5825–5842 CrossRef CAS.
- C. O. Kappe, Angew. Chem., Int. Ed., 2004, 116, 6408–6443 CrossRef PubMed.
- I. R. Baxendale, C. M. Griffiths-Jones, S. V. Ley and G. K. Tranmer, Chem. Weinh. Bergstr. Ger., 2006, 12, 4407–4416 CAS.
- M. Larhed and A. Hallberg, J. Org. Chem., 1996, 61, 9582–9584 CrossRef CAS.
- P. Lindström, J. Tierney and J. Westman, Tetrahedron, 2001, 57, 9225–9283 CrossRef.
- L. André, Microwaves in Organic Synthesis, WILEY-VCH Verlag, Weinheim, 1. Auflage., 2002 Search PubMed.
- N. E. Leadbeater and M. Marco, J. Org. Chem., 2003, 68, 888–892 CrossRef CAS PubMed.
- W. H. Carothers, J. Am. Chem. Soc., 1929, 51, 2548–2559 CrossRef CAS.
- C. Wutz and H. R. Kricheldorf, Macromol. Theory Simul., 2012, 21, 266–271 CrossRef CAS PubMed.
- J. Sakamoto, M. Rehahn and A. D. Schlüter, Design and Synthesis of Conjugated Polymers, WILEY-VCH, Weinheim, 2010 Search PubMed.
- B. S. Nehls, S. Füldner, E. Preis, T. Farrell and U. Scherf, Macromolecules, 2005, 38, 687–694 CrossRef CAS.
- F. Galbrecht, T. W. Bünnagel, T. Farrell and U. Scherf, Macromol. Rapid Commun., 2007, 28, 387–394 CrossRef CAS PubMed.
- S. Schmücker and D. Kuckling, Macromol. Chem. Phys., 2012, 213, 1725–1734 CrossRef PubMed.
- A. Britze, J. Jacob, V. Choudhary, V. Moellmann, G. Grundmeier, H. Luftmann and D. Kuckling, Polymer, 2010, 51, 5294–5303 CrossRef CAS PubMed.
- W. Zhang, P. Lu, Z. Wang and Y. Ma, J. Polym. Sci., Part A: Polym. Chem., 2013, 51, 1950–1955 CrossRef CAS PubMed.
- V. I. Minkin, Chem. Rev., 2004, 104, 2751–2776 CrossRef CAS PubMed.
- R. Klajn, Chem. Soc. Rev., 2014, 43, 148–184 RSC.
- S. L. Potisek, D. A. Davis, N. R. Sottos, S. R. White and J. S. Moore, J. Am. Chem. Soc., 2007, 129, 13808–13809 CrossRef CAS PubMed.
- D. A. Davis, A. Hamilton, J. Yang, L. D. Cremar, D. Van Gough, S. L. Potisek, M. T. Ong, P. V. Braun, T. J. Martínez, S. R. White, J. S. Moore and N. R. Sottos, Nature, 2009, 459, 68–72 CrossRef CAS PubMed.
- G. O'Bryan, B. M. Wong and J. R. McElhanon, ACS Appl. Mater. Interfaces, 2010, 2, 1594–1600 Search PubMed.
- K. M. Wiggins, J. N. Brantley and C. W. Bielawski, Chem. Soc. Rev., 2013, 42, 7130–7147 RSC.
- G. R. Gossweiler, G. B. Hewage, G. Soriano, Q. Wang, G. W. Welshofer, X. Zhao and S. L. Craig, ACS Macro Lett., 2014, 3, 216–219 CrossRef CAS.
- C. K. Lee, D. A. Davis, S. R. White, J. S. Moore, N. R. Sottos and P. V. Braun, J. Am. Chem. Soc., 2010, 132, 16107–16111 CrossRef CAS PubMed.
- C. K. Lee, C. E. Diesendruck, E. Lu, A. N. Pickett, P. A. May, J. S. Moore and P. V. Braun, Macromolecules, 2014, 47, 2690–2694 CrossRef CAS.
- S. Jiang, L. Zhang, T. Xie, Y. Lin, H. Zhang, Y. Xu, W. Weng and L. Dai, ACS Macro Lett., 2013, 2, 705–709 CrossRef CAS.
- Y. Chen and R. P. Sijbesma, Macromolecules, 2014, 47, 3797–3805 CrossRef CAS.
- M. Sommer and H. Komber, Macromol. Rapid Commun., 2013, 34, 57–62 CrossRef CAS PubMed.
- H. Komber, S. Müllers, F. Lombeck, A. Held, M. Walter and M. Sommer, Polym. Chem., 2014, 5, 443–453 RSC.
- V. A. Krongauz and E. S. Goldburt, Macromolecules, 1981, 14, 1382–1386 CrossRef CAS.
- X. Guo, Y. Zhou, D. Zhang, B. Yin, Z. Liu, C. Liu, Z. Lu, Y. Huang and D. Zhu, J. Org. Chem., 2004, 69, 8924–8931 CrossRef CAS PubMed.
- G. Copley, J. G. Gillmore, J. Crisman, G. Kodis, C. L. Gray, B. R. Cherry, B. D. Sherman, P. A. Liddell, M. M. Paquette, L. Kelbauskas, N. L. Frank, A. L. Moore, T. A. Moore and D. Gust, J. Am. Chem. Soc., 2014, 136, 11994–12003 CrossRef CAS PubMed.
- G. M. Sheldrick, Acta Crystallogr., Sect. A: Fundam. Crystallogr., 2008, 64, 112–122 CrossRef CAS PubMed.
- H. Putz and K. Brandenburg, Diamond: Crystal and Molecular Structure Visualization, vol. 3.2i, Crystal Impact GbR, Bonn, Germany, 2012 Search PubMed.
- J. P. Perdew, K. Burke and M. Ernzerhof, Phys. Rev. Lett., 1996, 77, 3865–3868 CrossRef CAS.
- P. E. Blöchl, Phys. Rev. B: Condens. Matter, 1994, 50, 17953–17979 CrossRef.
- J. J. Mortensen, L. B. Hansen and K. W. Jacobsen, Phys. Rev. B: Condens. Matter, 2005, 71, 035109 CrossRef.
- J. Enkovaara, C. Rostgaard, J. J. Mortensen, J. Chen, M. Dułak, L. Ferrighi, J. Gavnholt, C. Glinsvad, V. Haikola, H. A. Hansen, H. H. Kristoffersen, M. Kuisma, A. H. Larsen, L. Lehtovaara, M. Ljungberg, O. Lopez-Acevedo, P. G. Moses, J. Ojanen, T. Olsen, V. Petzold, N. A. Romero, J. Stausholm-Møller, M. Strange, G. A. Tritsaris, M. Vanin, M. Walter, B. Hammer, H. Häkkinen, G. K. H. Madsen, R. M. Nieminen, J. K. Nørskov, M. Puska, T. T. Rantala, J. Schiøtz, K. S. Thygesen and K. W. Jacobsen, J. Phys. Condens. Matter, 2010, 22, 253202 CrossRef CAS PubMed.
- G. Henkelman, B. P. Uberuaga and H. Jónsson, J. Chem. Phys., 2000, 113, 9901–9904 CrossRef CAS PubMed.
- J. M. G. Cowie, Chemie und Physik der synthetischen Polymere, Friedr. Vieweg & Sohn Verlagsgesellschaft mbH, Wiesbaden, 1997 Search PubMed.
- W. H. Carothers, Trans. Faraday Soc., 1936, 32, 39–49 RSC.
- R. Martin and S. L. Buchwald, Acc. Chem. Res., 2008, 41, 1461–1473 CrossRef CAS PubMed.
- C. Amatore and A. Jutand, Coord. Chem. Rev., 1998, 178–180 Search PubMed , Part 1, 511–528.
- C. Adamo, C. Amatore, I. Ciofini, A. Jutand and H. Lakmini, J. Am. Chem. Soc., 2006, 128, 6829–6836 CrossRef CAS PubMed.
- L.-L. Chua, J. Zaumseil, J.-F. Chang, E. C.-W. Ou, P. K.-H. Ho, H. Sirringhaus and R. H. Friend, Nature, 2005, 434, 194–199 CrossRef CAS PubMed.
- F. Lombeck, R. Matsidik, H. Komber and M. Sommer, Macromol. Rapid Commun., 2015, 36, 231–237 CrossRef CAS PubMed.
- F. Lombeck, H. Komber, S. I. Gorelsky and M. Sommer, ACS Macro Lett., 2014, 819–823 CrossRef CAS.
- A. Luzio, D. Fazzi, F. Nübling, R. Matsidik, A. Straub, H. Komber, E. Giussani, S. E. Watkins, M. Barbatti, W. Thiel, E. H. Gann, L. Thomsen, C. R. McNeill, M. Caironi and M. Sommer, Chem. Mater., 2014, 26, 6233–6240 CrossRef CAS.
- M. Brinkmann, E. Gonthier, S. Bogen, K. Tremel, S. Ludwigs, M. Hufnagel and M. Sommer, ACS Nano, 2012, 6, 10319–10326 CrossRef CAS PubMed.
- O. Navarro, N. Marion, Y. Oonishi, R. A. Kelly and S. P. Nolan, J. Org. Chem., 2006, 71, 685–692 CrossRef CAS PubMed.
- Y. Sangvikar, K. Fischer, M. Schmidt, A. D. Schlüter and J. Sakamoto, Org. Lett., 2009, 11, 4112–4115 CrossRef CAS PubMed.
- B. A. Beiermann, D. A. Davis, S. L. B. Kramer, J. S. Moore, N. R. Sottos and S. R. White, J. Mater. Chem., 2011, 21, 8443–8447 RSC.
- G. K. Such, R. A. Evans and T. P. Davis, Macromolecules, 2006, 39, 1391–1396 CrossRef CAS.
- Y. Sheng, J. Leszczynski, A. A. Garcia, R. Rosario, D. Gust and J. Springer, J. Phys. Chem. B, 2004, 108, 16233–16243 CrossRef CAS.
Footnote |
| † CCDC 1034507. For crystallographic data in CIF or other electronic format see DOI: 10.1039/c5py00141b |
| This journal is © The Royal Society of Chemistry 2015 |

