
 Open Access Article
 This Open Access Article is licensed under a
 Creative Commons Attribution 3.0 Unported Licence
Synthesis of liquid crystalline thioether-functionalized hydroxypropyl cellulose esters†
Peter
Ohlendorf
and
Andreas
Greiner
*
Macromolecular Chemistry II and Bayreuth Center for Colloid and Interfaces, Universität Bayreuth, Universitätsstraße 30, 95440 Bayreuth, Germany. E-mail: greiner@uni-bayreuth.de; Fax: +49-921-553393
First published on 23rd February 2015
Abstract
The successful synthesis of novel cholesteric hydroxypropyl cellulose (HPC) ester derivatives with pitch heights in the visible range and with functional thioether groups is reported here. The new methylthiopropionated HPC (HPC-MTP) was synthesized by the esterification of hydroxypropyl cellulose with 3-methylthiopropionyl chloride (MTP). Chain degradation and cross-linking of cellulose chains during esterification were avoided and complete esterification of all OH groups was achieved by the use of N,N-dimethylacetamide (DMAc) as the solvent. The structure of HPC-MTP was analyzed by NMR- and IR-spectroscopy and SEC. The physical properties of this new material were measured by TGA, DSC, wide angle X-ray scattering, polarization microscopy and UV/Vis spectroscopy. HPC-MTP products were found to be thermotropic liquid crystalline and formed cholesteric and nematic phases. The formation of lyotropic phases was observed with triglyme as the solvent.
Introduction
Functionalization of renewable cellulose leads to altering of the hydrogen bond network or creates new interactions between polymer chains.1 This functionalization provides access to a broad variety of materials with new structures and properties. The physical and chemical properties can be modified by the degree of functionalization (DS value).2 Besides the most commonly used modifications of cellulose via esterification3 or etherification4 of the hydroxyl groups, functional groups can also be introduced by oxidation,5 nucleophilic substitution,6 ring opening reactions,7 grafting,8 elimination reactions,9 cross-linking10 or intramolecular cyclization of the anhydroglucose units (AGU).11 Due to different reactivities of hydroxyl groups12,13 and the usage of protecting groups regioselectively, partially functionalized products are as well accessible.11One important aspect of the functionalization of cellulose is the insertion of sulfur-containing groups. Cellulose xanthate (thioester group) is a well-known derivative of cellulose, which is used in the production of rayon and cellophane.14 Functionalization of cellulose with thiosulfate,15,16 thiol,17,18 or thioether19,20 groups is mostly done in a two-step reaction and resulted yet only in low DS values. Another problem for further use of these thiol derivatives is the tendency for the formation of disulfide moieties.
Cellulose derivatives are known for possible formation of a cholesteric liquid crystalline phase,21 where the pitch height can be tuned by the degree of substitution (DS value). Functionalization via esterification results in an increasing pitch height, if the DS value increases, whereas modification via etherification leads to a decreasing pitch height with increasing DS value.22
The aim of this work was the synthesis of a thioether functionalized cellulose derivative with short side chains having the following properties: a high DS value for obtaining a homogeneous, better analyzable cellulose structure, a liquid crystalline phase for studies of supramolecular structures and being soluble in organic solvents like acetone, THF or chloroform for flexibility in processing. The synthesis via esterification should be an easy one-step reaction and should not lead to chain degradation23,24 or cross-linking.25
HPC instead of pure cellulose was selected for the functionalization with thioethers due to its better solubility. The short thioether side groups were introduced via esterification with 3-methylthiopropionyl chloride. HPC has not only similar properties but also some advantages compared to pure cellulose. It has like cellulose free hydroxyl groups for further modifications such as esterification, but is better soluble in organic solvents26 and derivatives are also known to form thermotropic and sometimes lyotropic LC phases also.27,28 In contrast to pure cellulose, the resulting functionalized HPC products should be soluble in organic solvents without degradation.23,24 Unwanted chain degradation was avoided with DMAc as the solvent.
The product of esterification HPC-MTP showed cholesteric properties with the pitch height in the range of visible light. Additionally, lyotropicity of HPC-MTP was observed in the solution of glycol ethers. The combination of chemical functionalization and supramolecular structure formation makes HPC-MTP a highly promising candidate for materials, for example for novel HPC-metal-nanoparticle conjugates with liquid crystalline order.
Experimental
Materials
Hydroxypropyl cellulose (average MW ∼ 100![[thin space (1/6-em)]](https://www.rsc.org/images/entities/char_2009.gif) 000 and 80000, Sigma-Aldrich) was dried under vacuum (4 × 10⁻² mbar) at 80 °C bath temperature for 8 h before synthesis. 3-Methylthiopropionyl chloride (>98%, TCI Europe) was used without any purification. N,N-Dimethylacetamide (≥99%, Carl Roth) was dried for 24 h over calcium chloride, distilled and stored under argon over 4 Å molecular sieves before use.
000 and 80000, Sigma-Aldrich) was dried under vacuum (4 × 10⁻² mbar) at 80 °C bath temperature for 8 h before synthesis. 3-Methylthiopropionyl chloride (>98%, TCI Europe) was used without any purification. N,N-Dimethylacetamide (≥99%, Carl Roth) was dried for 24 h over calcium chloride, distilled and stored under argon over 4 Å molecular sieves before use.
Analytical methods
IR spectra were obtained with Digilab Excalibur FTS-3000 with the Pike Miracle ATR unit (ZnSe crystal) and WinIRPro software version 3.3. 1H-NMR (1024 scans) and 13C-NMR (4096 scans) spectra were measured on a Bruker AMX-300 spectrometer with 300 MHz. The molecular weight was determined by size exclusion chromatography (SEC) with 30 cm SDV-gel columns (5 μm particle size and pore size of 105, 104, 103 and 102 Å), a refractive index detector (λ = 254 nm) and THF (rate 1 mL min−1) as an eluent. SEC was calibrated with polystyrene standards. TGA analysis was done with a NETZSCH TG 209 F1 Libra by heating-up to 800 °C with a rate of 10 °C min−1 under a nitrogen atmosphere. DSC scans were recorded with a Mettler Toledo DSC 821c under a nitrogen atmosphere with a heating/cooling rate of 10 °C per minute. Pitch heights were measured with a JASCO spectrophotometer V-670. Polarization microscopy images were obtained with a Nikon Diaphot 300 inverted microscope. Wide-angle X-ray scattering (WAXS) data reported here were measured with a “Double Ganesha AIR” (SAXSLAB, Denmark) small-angle X-ray system. A rotating copper anode (MicroMax 007HF, Rigaku Corporation, Japan) was used as an X-ray source for providing a micro-focused beam at λ = 0.154 nm. Data were recorded at room temperature with a PILATUS 300K (Dectris) sensitive position detector. The sulfur content was determined with a HEKAtech elementaranalyser EA 3000 (limit of determination: 0.05 wt%).Synthesis of HPC-MTP
The synthesis was performed with two HPC (80000 g mol−1 which results in HPC-MTP_80 and 100000 g mol−1 providing HPC-MTP_100 after esterification). In a typical synthesis 1.5 g hydroxypropyl cellulose (10 mmol related to the hydroxyl groups) and 60 mL N,N-dimethylacetamide were filled in a 100 mL three-neck round-bottom flask with a condenser, which was already evacuated, baked out, and flushed with argon. HPC was completely dissolved under stirring for 2 h at 130 °C. After gently cooling the solution down to room temperature followed by 12 h stirring at this temperature, a 4.38 mL (37.5 mmol) 3-methylthiopropionyl chloride was added under reverse flow to the reaction mixture, then stirred for 24 h at 68 °C and finally precipitated in 1.25 L water. The reaction product was purified by dissolving in THF, followed by precipitation in water (1.25 L), redissolving again in THF and finally by precipitation in ethanol. The light yellow, sticky, iridescent product (Fig. 2) was dried under high vacuum at 40 °C (5 × 10⁻² mbar for 48 h). Yield: HPC-MTP_100 = 2.05 g (81%), HPC-MTP_80 = 1.9 g (75%). ![[M with combining macron]](https://www.rsc.org/images/entities/i_char_004d_0304.gif) W: HPC-MTP_80 = 230000 g mol−1 and HPC-MTP_100 = 390000 g mol−1. FTIR(ATR): νmax/cm−1 2970–2870, 1730, 1430–910, 833. 1H-NMR δH (300 MHz; CDCl3; Me4Si): 5.03 (2H, m, OCH2CHCH3), 2.8–4.6 (9H, m, OCH2CHCH3, OCH, OCH2), 2.75 (6H, t, OCCH2CH2SCH3), 2.60 (6H, t, OCCH2CH2SCH3), 2.11 (3H, s, OCCH2CH2SCH3), 1.24 (9H, m, OCH2CHCH3), 1.13 (9H, m, OCH2CHCH3).
W: HPC-MTP_80 = 230000 g mol−1 and HPC-MTP_100 = 390000 g mol−1. FTIR(ATR): νmax/cm−1 2970–2870, 1730, 1430–910, 833. 1H-NMR δH (300 MHz; CDCl3; Me4Si): 5.03 (2H, m, OCH2CHCH3), 2.8–4.6 (9H, m, OCH2CHCH3, OCH, OCH2), 2.75 (6H, t, OCCH2CH2SCH3), 2.60 (6H, t, OCCH2CH2SCH3), 2.11 (3H, s, OCCH2CH2SCH3), 1.24 (9H, m, OCH2CHCH3), 1.13 (9H, m, OCH2CHCH3).
Film preparation of HPC-MTP
Homogeneous polymer films for pitch height measurement were prepared by placing samples between two glass slides with a 0.5 mm PTFE foil spacer.Results and discussion
Synthesis of HPC-MTP
Esterification with acid chlorides in acetone27 and pyridine29 is most commonly used to functionalize HPC. However, acetone reacts with the released hydrogen chloride and forms phorone and water.30 Water in combination with hydrogen chloride cleaves the glycosidic linkage and results in chain degradation. Furthermore, it cannot be excluded that the hydroxypropyl side chains will be unaffected from hydrochloric acid. The chain degradation increases with increasing reaction time.23 However, a long reaction time is essential to get high DS values i.e. a complete esterified product.31 Acetone and pyridine were tested as reaction solvents and pyridine in addition as hydrogen chloride scavenger.23 However, pyridine induced cross-linking of the cellulose chains. Non-covalent bonds between pyridinium chloride or acylium salt and the sulfur of the thioether end group were formed, which resulted in insoluble solids. Similar cross-linking was observed with other salts or by the use of a catalyst like carbonyldiimidazole (CDI).DMAc, a mild reaction solvent for esterifications of polysaccharides reported by Heinze et al.32 leads to less side products and was also used for esterification of HPC with methacryloyl chloride.33 Using DMAc as the solvent, HPC-MTP was synthesized according to Scheme 1 in a one-step reaction with optimized reaction parameters e.g. shorter reaction times (24 h) and higher reaction temperature (68 °C) compared to the literature33 (see the Experimental section). The product showed a high DS value (completely esterified) and no degradation or cross-linking during synthesis.
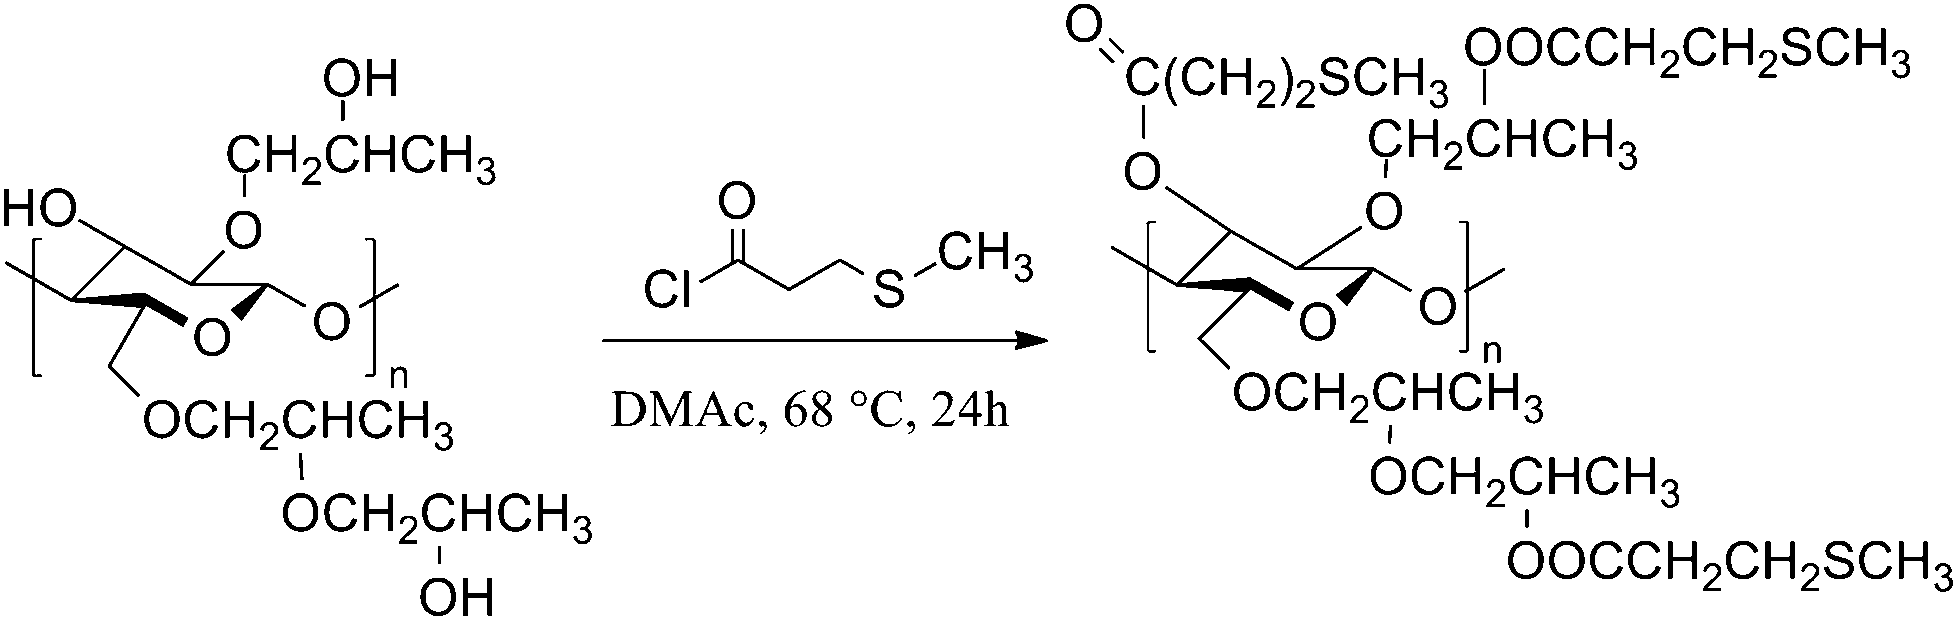 | ||
| Scheme 1 Synthesis of HPC-MTP. The structure for HPC and HPC-MTP is idealized with a degree of etherification of three25 and a degree of esterification of 3. | ||
Structure analysis and determination of DS-values
Complete and successful esterification was confirmed by the appearance of an IR C![[double bond, length as m-dash]](https://www.rsc.org/images/entities/char_e001.gif) O ester valence vibration band at 1730 cm−1 and the disappearance of the IR O–H valence vibration band in the IR spectra (see Fig. S1†). In addition, 1H-NMR confirms the successful synthesis of HPC-MTP by triplet signals at 2.75 and 2.60 ppm and the singlet at 2.12 ppm which occur only in the presence of thioether functional groups. Additionally, the signals “e”, “f” and “g” in Fig. 1, are caused by modifications of the HPC side chains. However, a direct determination of the degree of esterification (DS) from the 1H-NMR spectrum of the synthesized HPC-MTP products is not possible, since the signals of ring protons (2.8–4.6 ppm) overlap with the signal “d” of the side chains.
O ester valence vibration band at 1730 cm−1 and the disappearance of the IR O–H valence vibration band in the IR spectra (see Fig. S1†). In addition, 1H-NMR confirms the successful synthesis of HPC-MTP by triplet signals at 2.75 and 2.60 ppm and the singlet at 2.12 ppm which occur only in the presence of thioether functional groups. Additionally, the signals “e”, “f” and “g” in Fig. 1, are caused by modifications of the HPC side chains. However, a direct determination of the degree of esterification (DS) from the 1H-NMR spectrum of the synthesized HPC-MTP products is not possible, since the signals of ring protons (2.8–4.6 ppm) overlap with the signal “d” of the side chains.
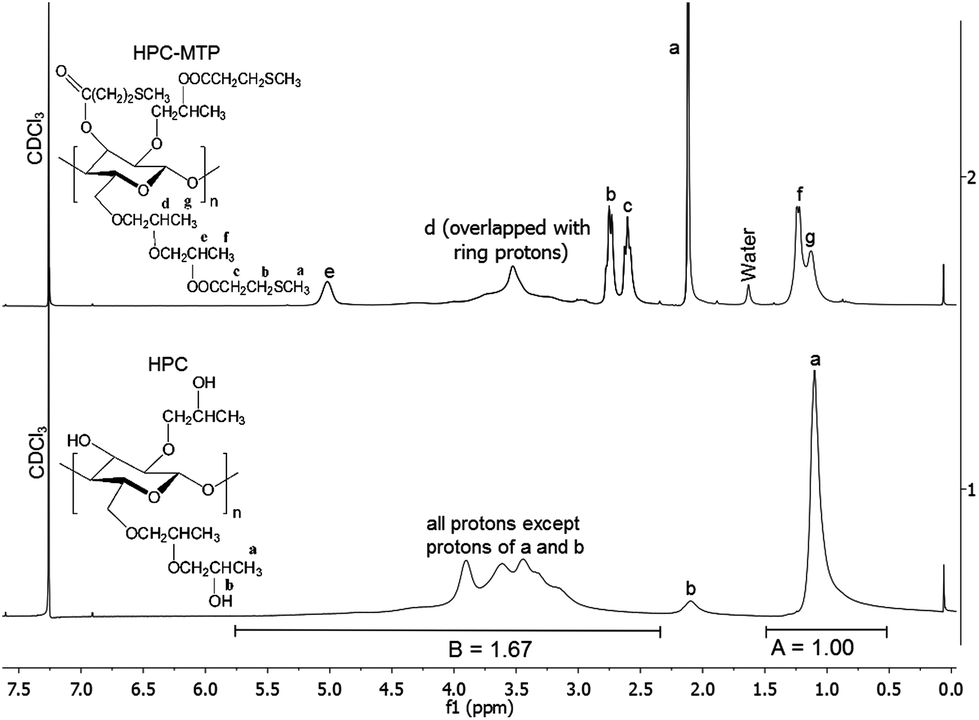 | ||
| Fig. 1 1H-NMR spectra of HPC-MTP (top) and HPC (bottom) in CDCl3. The structure for HPC-MTP is idealized with a degree of etherification of three25 and a degree of esterification of 3. | ||
Therefore an indirect method was applied to determine the DS values of both HPC-MTP products. First the degree of etherification (DE) of the used HPC compound was calculated from the 1H-NMR spectrum of HPC by using the method of F. F. L. Ho et al.34 Applying the formula DE = 10A/(3(B − A)) delivers a DE value of 4.98 (see Fig. 1 for A and B values). Based on this DE value a MW of 4.98 × 58 + 162 = 450.56 g mol−1 per repeating unit can be calculated, where 58 is the molecular weight of the hydroxypropyl groups and 162 is the MW of the anhydroglucose unit. If all OH groups of HPC are esterified with 3-methylthiopropionyl chloride (corresponding to the maximum degree of esterification DS = 3) the MW is 450.56 + 3 × 102.15 = 757.02 g mol−1 from which a sulfur content of 12.707 wt% can be calculated.
In the 2nd step the sulfur contents of both products were determined by elementary analysis resulting in 12.24 wt% sulfur for HPC-MTP_100 and 12.70 wt% sulfur for HPC-MTP_80. Comparing these experimental values (margin of error ∼0.5 wt%) with the above calculated sulfur content of 12.707 wt% (based on the calculated DE value of 4.98 and a theoretical DS value of 3), a complete esterification of all OH groups for both HPC products i.e. DS = 3 can be concluded.
The molecular weight of HPC-MTP_100 was 390000 g mol−1 and 230000 g mol−1 for HPC-MTP_80 according to SEC analysis (see Fig. S2†). Compared to the used HPC starting materials, these higher MWs imply that no chain degradation took place during esterification by HCl(aq.) ether cleavage. In addition, it can be concluded that ether cleavage can only be observed in the presence of HCl and water but does not occur with dry HCl(gas).
Chemical and physical properties of HPC-MTP
Both HPC-MTP products were well soluble in acetone, THF, chloroform, DMF, dioxane, and triglyme. The produced HPC-MTP products were stable for several months, if they were stored under inert gas and light exclusion in a fridge. Otherwise the product started to cross-link after a few weeks, which decreased the solubility of the products. Handling the products in the presence of air and light during further synthesis is readily possible. Both synthesized HPC-MTP products showed a one-step degradation at 370 °C (see Fig. S3†), when heated up to 800 °C with a rate of 10 °C per minute. They existed at room temperature (25 °C) in a high viscous, iridescent polymer melt state (Fig. 2) and showed phase transitions at −33 °C (Tg) and at 165 °C to the isotropic melt (Ti) (see Fig. S4†). | ||
| Fig. 2 Photographic image of an iridescent film of HPC-MTP (film thickness 0.5 mm) in daylight at room temperature. | ||
The iridescent character of the HPC-MTP products (see Fig. 2) was already a distinct hint for the liquid crystalline phase. X-ray scattering was measured to detect any short and long range order in HPC-MTP. The diffractograms of both HPC-MTP products (see Fig. S5†) showed a polymer halo by a very broad reflex at a larger scattering angle (2θ = 20°) which demonstrated the short range intramolecular order of the polymer and a very strong reflex at 2θ = 6.5° resulting from the long range intermolecular order between the polymer chains.35 This result indicated an alignment of the single polymer chains. The chain lengths of both HPC-MTP products had no influence on the wide angle X-ray diffractogram.
Polarizing microscopy showed for both products (HPC-MTP_100 & HPC-MTP_80), thermotropic LC phases with the same transition temperatures to isotropic melt (Fig. 3). The complete phase transition to the isotropic melt was in the range of 165–170 °C, which was in agreement with the melting peak of the DSC curve in Fig. S4.† The brightness of the LC phase in the polarizing microscope increased when shear forces were being applied to the sample. The rate of formation of the liquid crystal phase after heating was very slow but can be also accelerated by shearing (see the left image in cooling process in Fig. 3).
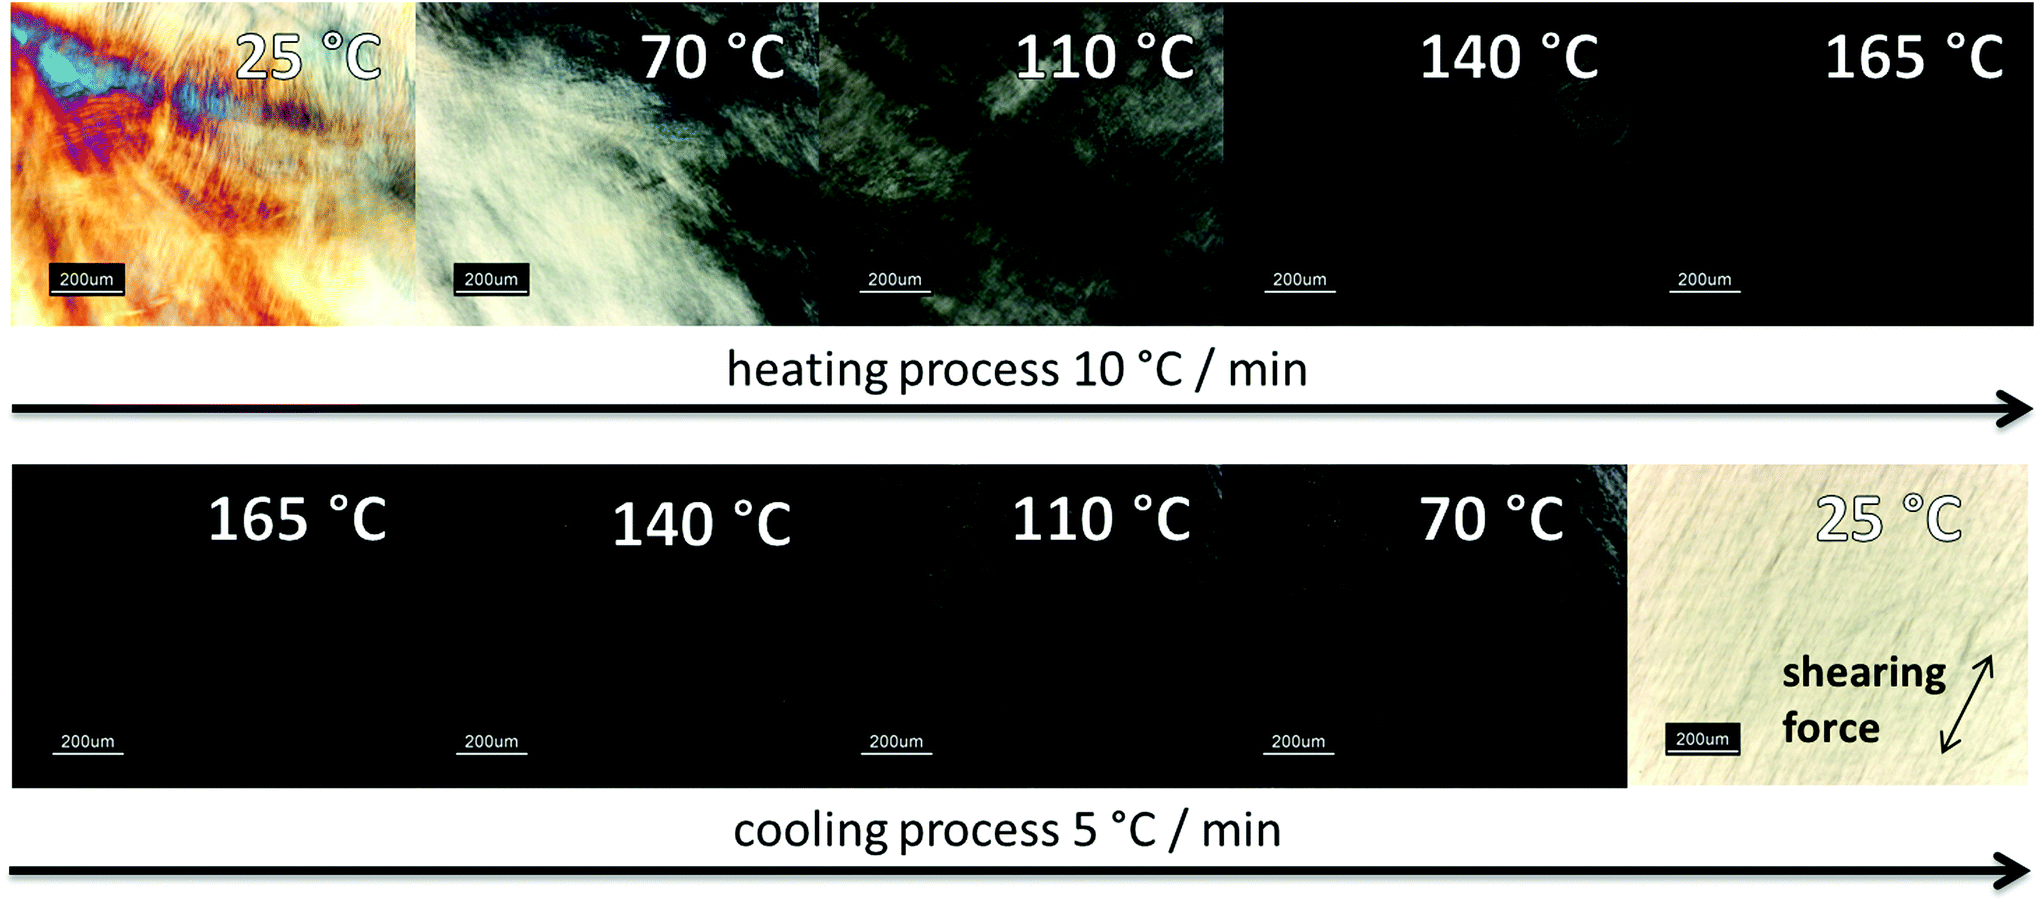 | ||
| Fig. 3 Polarized microscopy images from HPC-MTP film under crossed polarizers between two glass slides at different temperatures. | ||
The first image in Fig. 3 as well as the iridescent properties of HPC-MTP (both at room temperature) are typical for a cholesteric liquid crystal phase. The color disappearance at approx. 70 °C implies a phase transition to a nematic LC phase. For further confirmation of a cholesteric LC phase at 25 °C the reflection band via UV/Vis spectroscopy was measured. The pitch height was calculated with the formula of De Vries.36
| λ = P × ñ × sinφ |
φ, angle of incidence (90°).
Homogeneous 0.5 mm polymer films were prepared for the measurement by placing the polymer between two glass slides and using a 0.5 mm PTFE foil as the spacer. The maximum of the reflection band showed for both HPC-MTP products a bathochromic shift with time which converged at λmax = 800 nm for HPC-MTP_80 after 14 days (Fig. 4 and 5). For HPC-MTP_100 only a broad and not distinctive maximum in the reflection band was formed at approximately λmax = 739 nm which still shows a slow ongoing bathochromic shift after 18 weeks. The use of pre-oriented polyamide coated glass slides,37 silylated or quartz glass slides, or annealing had no effect on the formation time of the pitch. The pitch heights were calculated from the λmax values to be P = 532 nm for HPC-MTP_80 and roughly P = 491 nm for HPC-MTP_100.
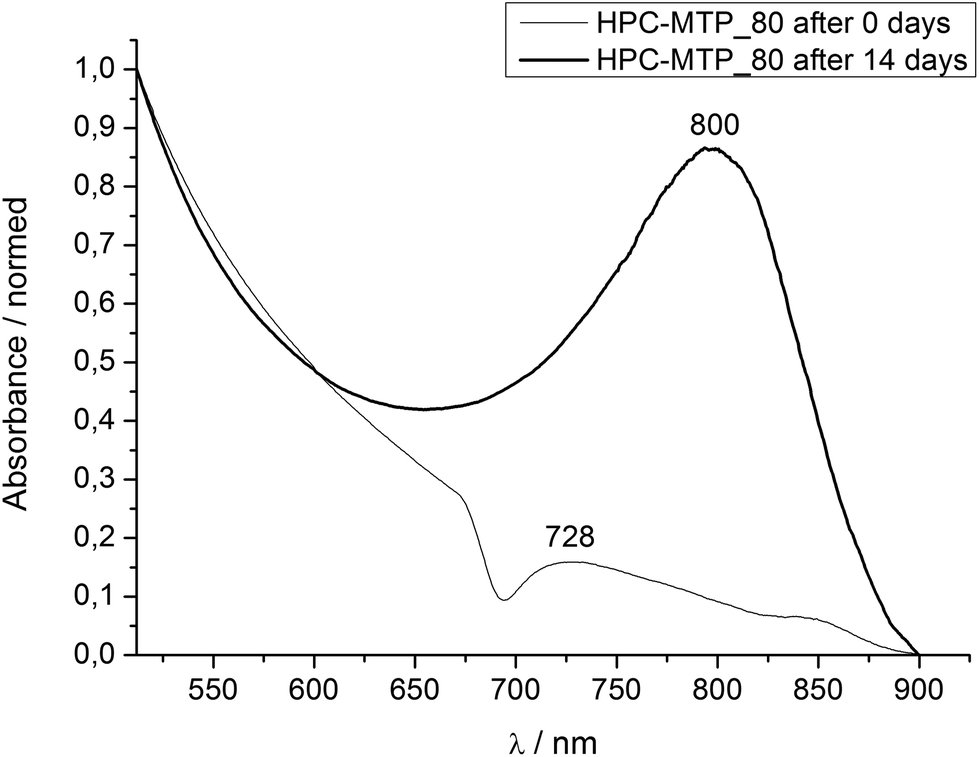 | ||
| Fig. 4 UV/Vis spectrum of HPC-MTP_80 at 25 °C directly and 14 days after film preparation. | ||
 | ||
| Fig. 5 Bathochromic shift of the reflection band of HPC-MTP with time. λmax was determined via UV/Vis spectroscopy of 0.5 mm thick polymer films at 25 °C. | ||
Additional UV/Vis spectra of HPC-MTP_80 were recorded at defined increasing temperatures to confirm the cholesteric–nematic phase transition as observed with the polarization microscope. After reaching the final position of the reflection band at 25 °C (see Fig. 5) the polymer film of HPC-MTP_80 was annealed at the respective defined temperatures for 24 h and then directly measured with a UV/Vis spectrometer. Due to the experimental setup, the temperature could not be controlled during the UV/Vis measurement. However, the impact of cooling during measurement on the reflection band should not be too high, since the kinetic of the pitch formation of HPC-MTP_80 is very slow (see also the caption of Fig. 6). As can be seen in Fig. 6 and 7, with the increasing temperature the reflection band shifts to higher wavelengths and the absorbance intensity decreases. The reflection band and thus the helical pitch height nearly linearly increase with the increasing temperature until a maximum is reached at 90 °C (λmax = 1093 nm → P = 727 nm; under the restrictions of the limited temperature control). No reflection band could be observed anymore at 100 °C (neither at higher wavelengths than 1200 nm), meaning that above ∼90 °C the pitch becomes infinite and by this the cholesteric order is transformed into a nematic phase (the sample was birefringent till the transition to the isotropic melt at 160 °C). We assume that the increasing Brownian movement with higher temperatures causes the increase of the pitch height and finally the formation of a nematic phase above ∼90 °C.
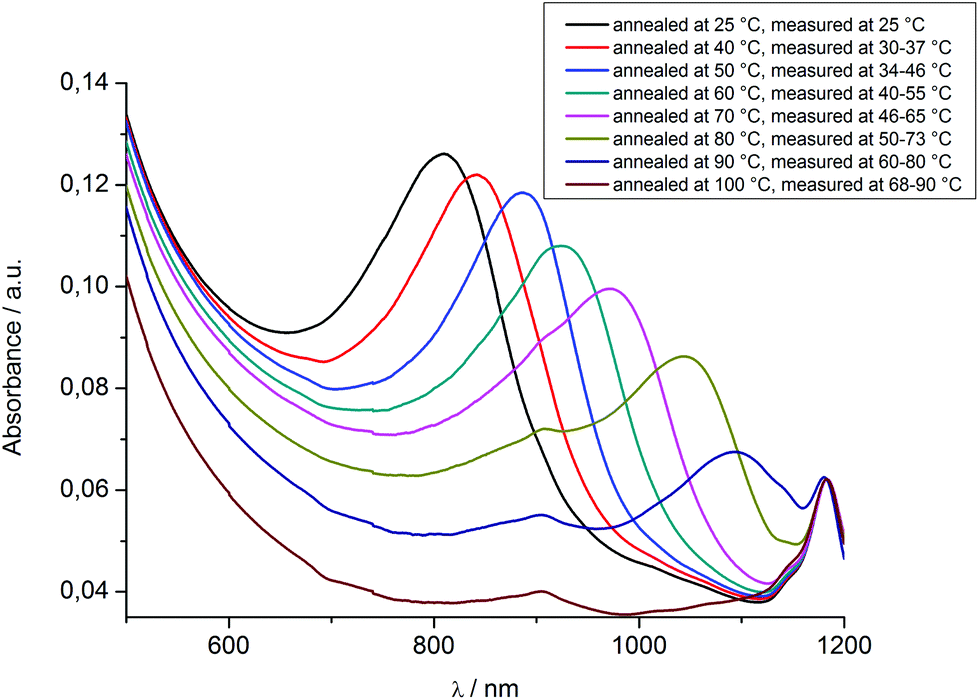 | ||
| Fig. 6 UV/Vis spectra of a 0.5 mm thick HPC-MTP_80 film at different temperatures. Temperatures during measurements were detected with an infrared camera. The remaining absorption signals at 100 °C at 1182 and 904 nm were also detected in the isotropic melt at 170 °C (see Fig. S6†) and are caused by the experimental setup. | ||
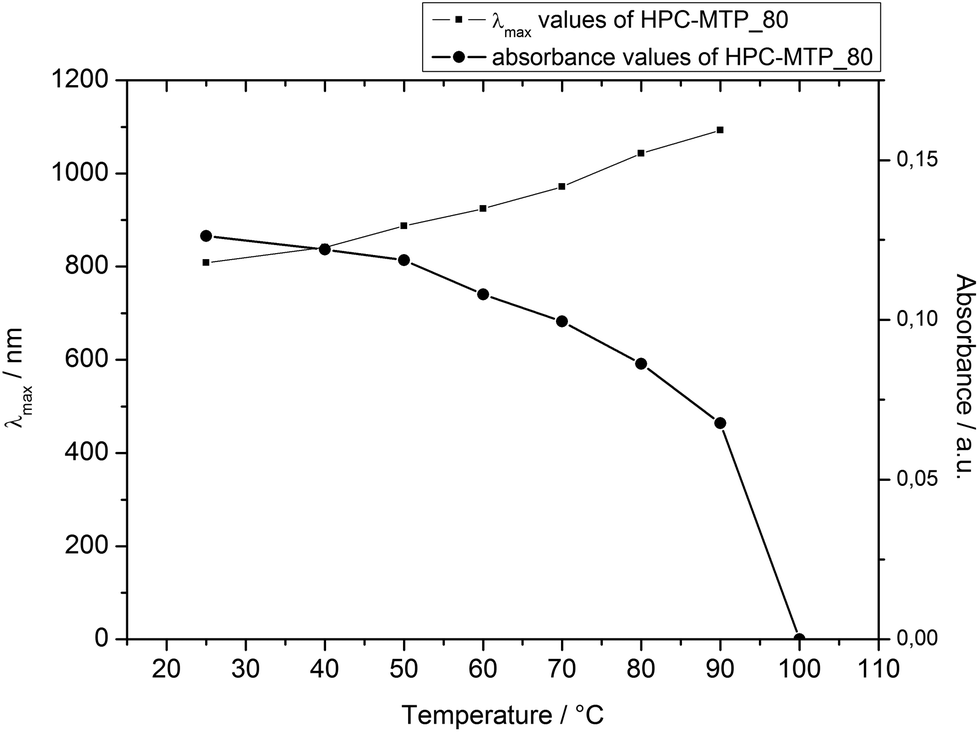 | ||
| Fig. 7 Reflection band and absorbance intensity of HPC-MTP_80 as a function of temperature. | ||
Highly concentrated solutions of HPC-MTP_80 in triglyme were obtained from ternary solutions with acetone. HPC-MTP was first solubilized in acetone and then different amounts of triglyme were added. Afterwards, acetone was completely removed under vacuum to obtain a homogeneous, pure polymer–triglyme solution. Polarizing microscopy of the solutions revealed the formation of lyotropic phases with concentrations >50 wt% of HPC-MTP_80 in triglyme (Fig. 8).
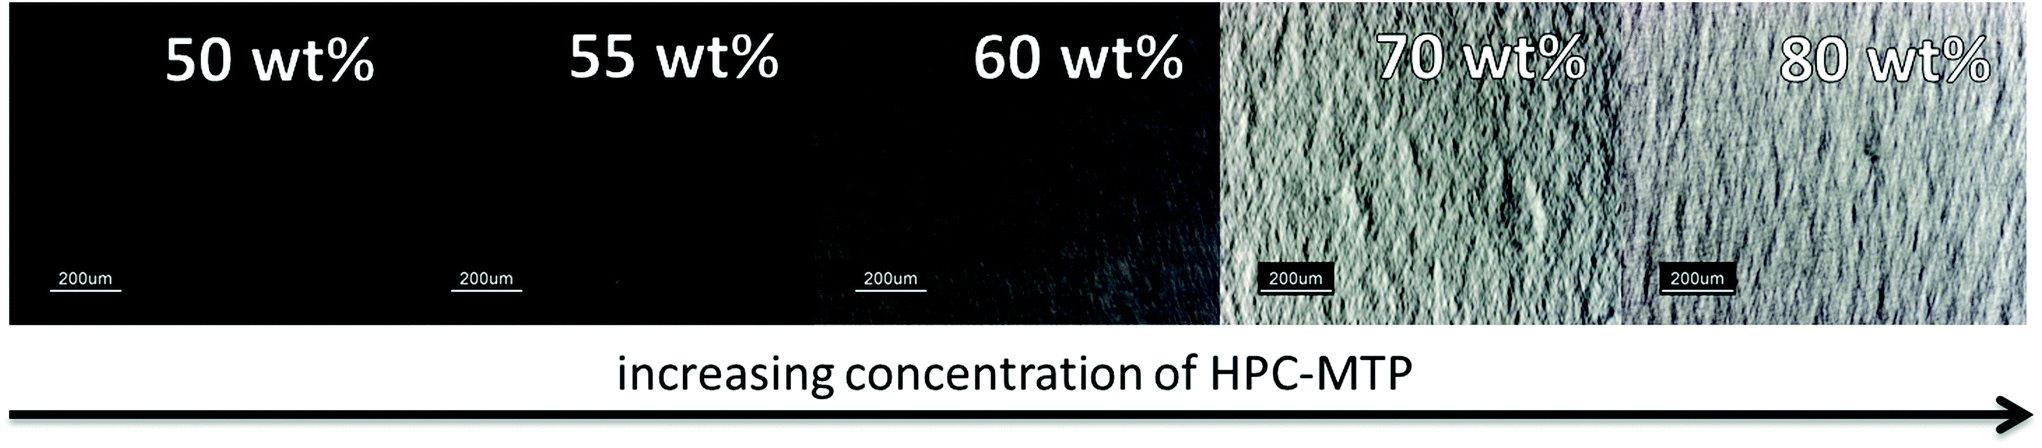 | ||
| Fig. 8 Polarized microscopy images of HPC-MTP triglyme solutions under a crossed polarizer. The samples were placed on normal glass slides with cover slips and directly measured after preparation at 25 °C. | ||
Conclusions
Quantitative esterification was demonstrated as a straightforward method for the preparation of hydroxypropyl cellulose functionalized with thioether groups. Chain degradation was prevented by the use of DMAc as the reaction solvent during esterification. No further additives were needed and thereby cross-linking due to non-covalent bonds could be prevented. The synthesized HPC-MTP products were well soluble in acetone, THF, chloroform, dioxane, DMF, and triglyme. They were stable for several months under inert gas, light exclusion, and storage in a fridge. The HPC-MTP polymers showed a broad thermotropic liquid crystal phase from −33 to 165 °C, which was independent from the investigated polymer chain lengths. A cholesteric liquid crystal phase was observed at room temperature and a nematic LC phase above 90 °C. The cholesteric pitch of HPC-MTP_80 was in the visible range and shifted with time to higher values until it reached its final value of 523 nm after 2 weeks. The maximum in the reflection band of HPC-MTP_100 was not very distinctive and still not reached after 18 weeks. Lyotropic liquid crystalline phases were formed in triglyme at room temperature and concentrations >50 wt%. The chemical functionalization of HPC with thioether end groups combined with a broad thermotropic LC phase makes HPC-MTP a promising candidate for new materials with exciting properties, for example HPC-MTP@metal-nanoparticle hybrid materials with liquid crystalline order.Acknowledgements
We would like to thank M. Dulle from the PCI department of the University of Bayreuth for wide angle X-ray scattering analysis, the chair of chemical engineering in Bayreuth for elementary analysis and Prof. T. Heinze from the University of Jena for valuable advise.Notes and references
- M. Granström, Cellulose Derivatives: Synthesis, Properties and Applications, PhD thesis, University of Helsinki, 2009 Search PubMed.
- V. K. Varshney and S. Naithani, in Cellulose Fibers: Bio- and Nano-Polymer Composites, ed. S. Kalia, B. S. Kaith and I. Kaur, Springer, Berlin Heidelberg, 2011, pp. 43–60 Search PubMed.
- C. Wan, Methanol, carbon monoxide, acetic anhydride, methyl acetate, Google Patents, 1980. http://www.google.com/patents/US4234719 Search PubMed.
- M. P. Adinugraha, D. W. Marseno and Haryadi, Carbohydr. Polym., 2005, 62, 164–169 CrossRef CAS PubMed.
- R. L. Kenyon, R. H. Hasek, L. G. Davy and K. J. Broadbooks, J. Ind. Eng. Chem., 1949, 41, 2–8 CrossRef CAS.
- T. Ishii, A. Ishizu and J. Nakano, Carbohydr. Res., 1977, 59, 155–163 CrossRef CAS.
- C. L. McCormick and T. R. Dawsey, Macromolecules, 1990, 23, 3606–3610 CrossRef CAS.
- A. Hufendiek, V. Trouillet, M. A. R. Meier and C. Barner-Kowollik, Biomacromolecules, 2014, 15, 2563–2572 CAS.
- A. Potthast, S. Schiehser, T. Rosenau and M. Kostic, Holzforschung, 2009, 63, 12–17 CrossRef CAS.
- S. N. Bhadani and D. G. Gray, Mol. Cryst. Liq. Cryst., 2011, 102, 255–260 CrossRef.
- D. Klemm, T. Heinze, B. Philipp and W. Wagenknecht, Acta Polym., 1997, 48, 277–297 CrossRef CAS.
- R. J. J. Samuels, J. Polym. Sci., Part A2, 1969, 7, 1197–1258 CrossRef CAS.
- M. G. J. Wirick, J. Polym. Sci., Part A1, 1968, 6, 1705–1718 CrossRef CAS.
- J. Kim, S. Yun and Z. Ounaies, Macromolecules, 2006, 39, 4202–4206 CrossRef CAS.
- D. F. Siqueira Petri, S. Choi, H. Beyer, T. Schimmel, M. Bruns and G. Wenz, Polymer, 1999, 40, 1593–1601 CrossRef.
- J.-L. Huang, C.-J. Li and D. G. Gray, RSC Adv., 2014, 4, 6965–6969 RSC.
- G. N. Richards, J. Appl. Polym. Sci., 1961, 5, 558–562 CrossRef.
- J. Tan, H. Kang, R. Liu, D. Wang, X. Jin, Q. Li and Y. Huang, Polym. Chem., 2011, 2, 672–678 RSC.
- G.-L. Zhao, J. Hafrén, L. Deiana and A. Córdova, Macromol. Rapid Commun., 2010, 31, 740–744 CrossRef CAS PubMed.
- G. Wenz, P. Liepold and N. Bordeanu, Cellulose, 2005, 12, 85–96 CrossRef CAS.
- M. Müller and R. Zentel, Macromol. Chem. Phys., 2000, 201, 2055–2063 CrossRef.
- T. A. Yamagishi, F. Guittard, M. H. Godinho, A. F. Martins, A. Cambon and P. Sixou, Polym. Bull., 1994, 32, 47–54 CrossRef CAS.
- R. Riemschneider and J. Sickfeld, Monatsh. Chem. verw. Teile anderer Wiss., 1964, 95, 194–202 CrossRef CAS.
- A. Grün and F. Z. Wittka, Angew. Chem., 1921, 34, 645–648 CrossRef.
- A. Greiner, H. Hou, A. Reuning, A. Thomas, J. H. Wendorff and S. Zimmermann, Cellulose, 2003, 10, 37–52 CrossRef CAS.
- T. Heinze, T. Liebert and A. Koschella, Esterification of polysaccharides, Springer, Berlin, New York, 2006 Search PubMed.
- S. L. Tseng, G. V. Laivins and D. G. Gray, Macromolecules, 1982, 15, 1262–1264 CrossRef CAS.
- F. Guittard, T. Yamagishi, A. Cambon and P. Sixou, Macromolecules, 1994, 27, 6988–6990 CrossRef CAS.
- S. N. Bhadani and D. G. Gray, Mol. Cryst. Liq. Cryst., 1983, 99, 29–38 CrossRef CAS.
- Competition Science Vision, April 2009, 182–183.
- H. Hou, A. Reuning, J. H. Wendorff and A. Greiner, Macromol. Chem. Phys., 2000, 201, 2050–2054 CrossRef CAS.
- T. Heinze, P. Talaba and U. Heinze, Carbohydr. Polym., 2000, 42, 411–420 CrossRef CAS.
- T. Cai, Z. Hu, B. Ponder, J. St. John and D. Moro, Macromolecules, 2003, 36, 6559–6564 CrossRef CAS.
- F. F. L. Ho, R. R. Kohler and G. A. Ward, Anal. Chem., 1972, 44, 178–181 CrossRef.
- E. Arici, A. Greiner, H. Hou, A. Reuning and J. H. Wendorff, Macromol. Chem. Phys., 2000, 201, 2083–2090 CrossRef CAS.
- H. de Vries, Acta Crystallogr., 1951, 4, 219–226 CrossRef CAS.
- J. Stöhr and M. G. Samant, J. Electron Spectrosc. Relat. Phenom., 1999, 98–99, 189–207 CrossRef.
Footnote |
| † Electronic supplementary information (ESI) available: IR spectrum, SEC elugram, TGA curve, DSC curve and X-ray scattering diffractogram. See DOI: 10.1039/c4py01709a |
| This journal is © The Royal Society of Chemistry 2015 |