 Open Access Article
Upper or lower critical solution temperature, or both? Studies on cationic copolymers of N-isopropylacrylamide†
Erno
Karjalainen
,
Vladimir
Aseyev
and
Heikki
Tenhu
 *
*
Laboratory of Polymer Chemistry, Department of Chemistry, University of Helsinki, P.O. Box 55, 00014 Helsinki, Finland. E-mail: heikki.tenhu@helsinki.fi
First published on 5th March 2015
Abstract
The solution properties of statistical copolymers of N-isopropyl acrylamide (NIPAm) and cationic (3-acrylamidopropyl) trimethylammonium chloride (AMPTMA) have been studied. The phase behavior of the copolymers in aqueous solutions is strongly affected by the addition of lithium bis(trifluoromethane)sulfonimide (LiNTf2), NaCl, or both. Hydrophobic NTf2 counter ions bind to the AMPTMA repeating units. By adjusting the balance between hydrophobic and electrostatic interactions the transition temperature of the copolymers may be tuned over a wide temperature range. It was observed that a homopolymer PAMPTMA undergoes an UCST-type phase separation in an aqueous solution in the presence of both NaCl and LiNTf2. When AMPTMA and NIPAm are present in the copolymer in nearly equal amounts both LCST and UCST can coexist. It was observed that the effect of LiNTf2 is similar to that of the salts in the kosmotropic end of the Hofmeister series for PNIPAm.
Introduction
A well-known method to change the phase separation temperature of an aqueous thermoresponsive polymer as PNIPAm is to copolymerize hydrophilic or hydrophobic units to the chain. This report discusses a further step taken to alter the solubility of cationic copolymers of N-isopropylacrylamide.Poly(N-isopropyl acrylamide) (PNIPAm) is by far the most studied thermoresponsive polymer.1 Since the original report of 1968, the lower critical solution temperature (LCST) of PNIPAm in water has been a subject of numerous publications.2,3 The cloud point (Tc) is approximately 32 °C, though this slightly varies with the concentration and molecular weight at low degrees of polymerization.3–6 The cause of the phase separation at the cloud point is the change of water from a good solvent to a poor one, which is manifested as a decrease in the second virial coefficient (A2) and leads to a coil-to-globule-transition.7 In very dilute solutions, the globules are stable, but a higher concentration leads to the formation of stable mesoglobules.8
At the cloud point, the polymer chains dehydrate and new intra- and intermolecular hydrogen bonds are formed.9–11 In particular the breaking of the hydration layer or “water cage” around the isopropyl groups plays a central role.12 However, even above Tc, the polymer globules are still hydrated and a large majority of the amide groups keep hydrogen bonded to water.8,10,13–15 The transition takes place in domains, or “cooperative units”, which dehydrate as a whole.16,17 These domains consist only of a part of the chain in a high molecular weight PNIPAm, but the whole chain acts as one in the case of a low molecular weight polymer.17 Thermodynamically, the driving force behind the LCST phenomenon can be understood to be the gain in entropy caused by the release of the bound water to the bulk.18–20 The enthalpy of the transition is endothermic.9,16,21
The system is partially reversible on cooling, but not all newly formed hydrogen bonds break during cooling, which is seen as hysteresis.22,23 Breaking the new intrachain hydrogen bonds is observed, when PNIPAm solution is kept at low temperature for a long time.23 The dissolution process has also calorimetrically been found to be slow, especially when the PNIPAm solution has been kept at temperatures above Tc for a long time.24 The redissolution of PNIPAm happens in two exothermic steps, which are believed to correspond to the dissolution of the shell and the core of the formed structure.25
Some salts, e.g. NaI and NaSCN, may increase the Tc of PNIPAm at low concentrations. However, generally the addition of salts to an aqueous solution of PNIPAm decreases the Tc.9,26,27 The magnitude of this effect follows the Hofmeister series and is more related to the anion than to the cation of a given salt.26,27 The effect has been attributed to a change of surface tension at the polymer–water interface, polarization of water, and anion bonding to the amide groups of PNIPAm.27–30 According to another view, the effect arises from binding of the cation to the amide oxygen of PNIPAm.31 The strength of this interaction is then modulated by the anion. The enthalpy of transition is slightly less endothermic when ions are introduced, which may be due to an exothermic contribution arising from the hydration of the ions.19 Ways to influence the Tc of a PNIPAm homopolymer also include the end-groups,5,6,32–34 tacticity,34–36 and the addition of cosolvents.37,38
Copolymerization also influences the Tc. Hydrophilic comonomers increase the Tc and hydrophobic comonomers decrease it.39–44 This is due to the fact that the overall hydrophobicity of the polymer determines the entropic gain associated with the dehydration of the chains.19 Enthalpy of the transition decreases linearly as a function of Tc when a more hydrophilic comonomer is introduced, regardless of the nature of the comonomer.19,39,45,46 The strength of hydrogen bonding between water molecules in the hydration layer is lower at elevated temperatures and therefore the decrease in enthalpy is caused by an increase in the Tc.19,39,46 Another factor affecting the Tc is the incomplete dehydration induced by the hydrophilic groups.45 Analogously, incorporation of hydrophobic comonomers increases the enthalpy of transition.39 The finding is in accordance with the view that differences in the strength of hydrogen bonding between water molecules are responsible for the differences in enthalpy.19
Bokias et al. studied random copolymers of PNIPAm and acrylic acid.47 They found out that a copolymer with a PNIPAm content of 17.5 mol% as a 10 mg mL−1 solution has not only a LCST type of Tc, but also an upper critical solution temperature (UCST) type of Tc at high temperature. This is possible in a NaCl solution in the concentration range of 0.15 to 0.4 M. This is probably the only example of a PNIPAm containing a random copolymer with a soluble–insoluble–soluble behaviour with increasing temperature. Some examples of other copolymers with such behaviour in aqueous systems exist, however.48–50
Bis(trifluoromethane)sulfonimide (NTf2) is known to turn many polycations insoluble in water.51 This anion was recently used to modify the thermal response of a weak polycation, poly(2-(dimethylamino) ethyl methacrylate) (PDMAEMA).52 Also, the introduction of NTf2 to solutions of two different polycations triggered UCST-type behaviour, provided that the overall ionic strength of the solution was sufficiently high.53 The present study develops these ideas further using copolymers of NIPAm and cationic (3-acrylamidopropyl)trimethylammonium chloride (AMPTMA) with various monomer ratios. Such polymers should respond not only to ionic strengths but also to low concentrations of NTf2. Other investigators have shown that it is possible to influence the Tc of analogous polymers by ionic strength.48–50,54 By introducing a hydrophobic anion and simultaneously changing the ionic strength with a simple salt it should be possible to change the thermal response of the copolymers over a wide range of temperatures.
Experimental
Materials
Ethyl 2-chloropropionate (EClPr) (Aldrich, 97%) and dimethyl formamide (DMF) (Lab-Scan, HPLC-grade) were distilled in a vacuum. Tris(2-dimethylaminoethyl)amine (Me6TREN) was synthesized as reported earlier.55 (3-Acrylamidopropyl)trimethylammonium chloride (AMPTMA) (Aldrich, 75 w% solution in water) was precipitated and thoroughly washed with acetone and dried in a vacuum. Water used to prepare polymer solutions, salt solutions and samples was purified with ELGA purelab ultra-purification system to obtain conductivity of 0.05–0.07 μS cm−1. Water used in syntheses was distilled. N-isopropyl acrylamide (NIPAm) (Acros Organics, 99%) was recrystallized from hexane. CuCl (Aldrich, 99.995%), CuCl2 (Aldrich, 99.999%), lithium bis(trifluoromethane)sulfonimide (LiNTf2) (Aldrich, 99%), NaCl (Fluka, 99%), and hexane (VWR, HPLC-grade) were used as received. Deuterated solvents were obtained from Euriso-top and used as received.Polymerizations
All the polymerizations were conducted with atom transfer radical polymerization (ATRP).56 In the polymerizations ethyl 2-chloropropionate (EClPr) was used as the initiator (I). All of the studied copolymers were synthesized with reagent ratios ([NIPAm] + [AMPTMA])![[thin space (1/6-em)]](https://www.rsc.org/images/entities/char_2009.gif) :
:![[thin space (1/6-em)]](https://www.rsc.org/images/entities/char_2009.gif) [EClPr]
[EClPr]![[thin space (1/6-em)]](https://www.rsc.org/images/entities/char_2009.gif) :
:![[thin space (1/6-em)]](https://www.rsc.org/images/entities/char_2009.gif) [CuCl]
[CuCl]![[thin space (1/6-em)]](https://www.rsc.org/images/entities/char_2009.gif) :
:![[thin space (1/6-em)]](https://www.rsc.org/images/entities/char_2009.gif) [CuCl2]
[CuCl2]![[thin space (1/6-em)]](https://www.rsc.org/images/entities/char_2009.gif) :
:![[thin space (1/6-em)]](https://www.rsc.org/images/entities/char_2009.gif) [Me6TREN] of 100
[Me6TREN] of 100![[thin space (1/6-em)]](https://www.rsc.org/images/entities/char_2009.gif) :
:![[thin space (1/6-em)]](https://www.rsc.org/images/entities/char_2009.gif) 1
1![[thin space (1/6-em)]](https://www.rsc.org/images/entities/char_2009.gif) :
:![[thin space (1/6-em)]](https://www.rsc.org/images/entities/char_2009.gif) 0.8
0.8![[thin space (1/6-em)]](https://www.rsc.org/images/entities/char_2009.gif) :
:![[thin space (1/6-em)]](https://www.rsc.org/images/entities/char_2009.gif) 0.2
0.2![[thin space (1/6-em)]](https://www.rsc.org/images/entities/char_2009.gif) :
:![[thin space (1/6-em)]](https://www.rsc.org/images/entities/char_2009.gif) 1. Polymerizations were conducted with a total monomer concentration of approximately 2 M in 1
1. Polymerizations were conducted with a total monomer concentration of approximately 2 M in 1![[thin space (1/6-em)]](https://www.rsc.org/images/entities/char_2009.gif) :
:![[thin space (1/6-em)]](https://www.rsc.org/images/entities/char_2009.gif) 1 (vol.) water–DMF-mixture at 25 °C for 4 hours. The PNIPAm homopolymer (PNIPAm-1) was synthesized without CuCl2, with a relative [CuCl] of 1 and a reaction time of 3 hours, but the procedure was otherwise the same as in the case of copolymers. The PAMPTMA-homopolymer (PAMPTMA-1) was synthesized similarly as the copolymers, but with a relative [AMPTMA] of 50.
1 (vol.) water–DMF-mixture at 25 °C for 4 hours. The PNIPAm homopolymer (PNIPAm-1) was synthesized without CuCl2, with a relative [CuCl] of 1 and a reaction time of 3 hours, but the procedure was otherwise the same as in the case of copolymers. The PAMPTMA-homopolymer (PAMPTMA-1) was synthesized similarly as the copolymers, but with a relative [AMPTMA] of 50.
One of the polymerizations is described below (CP-17), other polymerizations were conducted similarly. Also other methods were used, but they did not produce satisfactory results. These polymers were used to examine the randomness of the copolymerization (see Results and discussion).
NIPAm (2.2703 g, 20.1 mmol), CuCl (0.0198 g, 0.200 mmol), CuCl2 (0.0067 g, 0.0498) and AMPTMA (1.0438 g, 5.05 mmol) were dissolved in 6 mL of water and 4 mL of DMF. A zero-sample was taken at this point and analysed later with NMR. The mixture was bubbled with nitrogen for 15 minutes, after which Me6TREN (0.0579 g, 0.251 mmol) in 1 mL of DMF was added. The mixture was bubbled with nitrogen for 45 minutes. EClPr (0.0340 g, 0.249 mmol) in 1 mL of DMF, which was also bubbled with nitrogen for 45 minutes, was then added using a nitrogen-flushed syringe. The reaction was allowed to proceed in a bath thermostated to 25 °C.
After 4 hours reaction time, the reaction was quenched by freezing the reaction flask with liquid nitrogen and opening it to the atmosphere. After melting, a sample was taken and analysed later with NMR. In order to oxidize all the possibly remaining, sparingly soluble, CuCl, water was added to the flask and the mixture was stirred under air for 30 minutes. Next, the reaction mixture was moved to a dialysis bag (molecular weight cutoff 3500 g mol−1) and dialysed against water for 5 days with 5 water changes. The product was then recovered by freeze-drying the contents of the dialysis bag.
Characterization
In the second method the system consisted of a Waters 515 HPLC pump, Waters Ultrahydrogel columns and Waters 2410 refractive index (RI) detector. The samples were run in 0.8 M aqueous NaNO3 with 3% of acetonitrile. The system was calibrated with poly(ethylene oxide) standards. The samples were prepared by mixing the polymer and eluent to a polymer concentration of 4 mg mL−1 and allowing the samples to dissolve under refrigeration overnight.
The experiments were typically conducted by heating the sample holder from 5 °C to 90 °C, with an initial stabilization period of 10 minutes at 5 °C. Also a cooling cycle from 90 °C to 5 °C was usually measured, with 10 minutes of stabilization at the starting temperature. In some cases, the heating and cooling scans were done in succession. In these measurements, the first scan was always the heating scan. The effect of the cooling rate was in some cases tested by cooling the sample, after the initial heating run, from 90 °C as fast as possible (in approximately five minutes) to 5 °C. Then, the sample was heated for the second time as described above.
The reversibility of the transition was studied with controlled cooling by first stabilizing the sample at 5 °C for 10 minutes, then heating it to 75 °C and finally cooling it back to 5 °C. After the first heating and cooling cycle, the following measurements were done by varying the stabilization period, starting from the longest one. Some samples were heated only to 50 °C and cooled to 5 °C as fast as possible (in this case the cooling rate is not constant but it takes approximately 6 minutes to reach 20 °C). This was done in order to minimize the time spent at high temperatures.
Results and discussion
Copolymerization
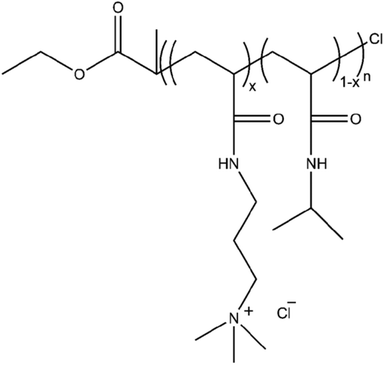
A series of copolymers consisting of NIPAm and AMPTMA repeating units were synthesized, along with the corresponding homopolymers. The general structure of the polymers is given in Scheme 1.The ratios of the repeating units and degrees of polymerization were determined by NMR spectroscopy (ESI, Fig. S1†) and listed in Table 1. The copolymers (CPs) have been named according to their AMPTMA content as mol%, e.g. CP-17 and CP-46 contain 17 and 46 mol% of AMPTMA, respectively. The degrees of polymerization of the copolymers are relatively constant.
| Polymer | f(w)a (%) | f(NMR)b (%) | F (%) | Conv.d (%) | DPe | M n (SEC, DMF)f (kg mol−1) (Mw/Mn) | M n (SEC, aq.)g (kg mol−1) (Mw/Mn) | M n (NMR)h (kg mol−1) | M n (th.)i (kg mol−1) |
|---|---|---|---|---|---|---|---|---|---|
| a Mole fraction of AMPTMA in the reaction mixture, based on weighing of the monomers to the reaction mixture. b Mole fraction of AMPTMA in the reaction mixture by NMR. c Mole fraction of AMPTMA in the copolymer by NMR. d Total conversion, including both monomers. e Total degree of polymerization determined by end group analysis. f Measured in DMF with 1% of LiBr after ion exchange with NTf2. Calibrated with poly(methyl methacrylate) standards. g Measured in 0.8 M aqueous NaNO3. Calibrated with poly(ethylene oxide) standards. h M(EClPr) + F × DP × M(AMPTMA) + (1 − F) × DP × M(NIPA). i Theoretical molecular weight: [M(NIPAm) × conv. × n(NIPAm)/n(EClPr)] + [M(AMPTMA) × conv. × n(NIPAm) × (f(NMR)/(1 − f(NMR))/n(EClPr)] + M(EClPr). | |||||||||
| PAMPTMA-1 | 100 | 100 | 100 | 96.7 | 43.2 | Insoluble | 2.92 (1.12) | 8.93 | 10.1 |
| PNIPAm-1 | 0 | 0 | 0 | 90.4 | 69.0 | 17.5 (1.28) | 1.36 (1.07) | 7.94 | 10.4 |
| CP-8 | 10.0 | 8.05 | 7.82 | 97.0 | 90.4 | 24.9 (1.18) | 5.90 (1.28) | 11.0 | 11.5 |
| CP-17 | 20.1 | 18.1 | 17.1 | 90.7 | 86.2 | 28.0 (1.21) | 10.4 (1.32) | 11.3 | 11.6 |
| CP-26 | 30.0 | 28.1 | 26.4 | 90.5 | 87.6 | 23.6 (1.18) | 9.13 (1.31) | 12.2 | 12.4 |
| CP-46 | 50.0 | 49.5 | 46.2 | 84.8 | 79.1 | 18.0 (1.16) | 10.0 (1.26) | 12.5 | 13.5 |
| CP-65 | 70.0 | 68.7 | 65.3 | 88.0 | 76.9 | Insoluble | 9.59 (1.19) | 13.6 | 15.0 |
The conversions of the reactions (Table 1) were calculated by analysing the change in the integrals of the double bond signals at 5.5–5.9 ppm (ESI, Fig. S2†). The methyl protons at 1 ppm were used as an internal standard. However, as the double bond peaks of the monomers overlap the conversions for individual monomers could not be determined. The reported values of conversion are the total conversion of all of the different double bonds in the reaction mixture.
It was observed that the AMPTMA content in the reaction mixture determined by NMR (f(NMR)) was systematically lower than what could be expected from the amount of AMPTMA weighed to the reaction flask (f(w)). From this it can be concluded that washing with acetone and drying in a vacuum are not very effective ways to remove water from AMPTMA, which was supplied as a 75% aqueous solution (see the Materials section). However, the f(NMR) values are in good agreement with the AMPTMA content of the final copolymers (F).
At high conversions the relative amounts of repeating units in the copolymers correspond well to the amounts in the feed. The result as such does not give information on the randomness of the polymerization. While optimizing the reaction conditions it was observed that regardless of the ratios of monomers the AMPTMA content in the final copolymer is close to that in the feed (ESI, Fig. S3†). This also holds with varying conversions (ESI, Fig. S4†). The results taken together indicate that the polymers may be regarded as random ones. The conclusion is important since the chain microstructure has a strong impact on the thermoresponsive properties of copolymers.44,57
Determination of the molecular weight distribution turned out to be complicated, as noted also by others for PAMPTMA containing polymers.58 SEC was conducted with two eluents and columns. First measurements were done in DMF with 1% LiBr, and the polymer counter ions exchanged with NTf2 to improve solubility. Second measurements were run in 0.8 M aqueous NaNO3 (see Experimental for details). Both methods gave reasonable results, see Table 1. PAMPTMA-1 and CP-65 were insoluble in DMF even after the ion exchange with NTf2, which usually improves the solubility of polycations in organic solvents.51 In the aqueous eluent, PAMPTMA-1 evidently interacts with the stationary phase since the apparent molecular weight was very low.
Molecular weight data in Table 1 are somewhat scattered, though the NMR results are close to the theoretical values. The overall conclusion is that the polymers are of the same order of molecular weights, and the distributions are sufficiently narrow.
Thermal behaviour in aqueous solutions
This study discusses polymers which show both LCST (TcL) and UCST (TcU) type cloud points. (For determining the Tcs, see Fig. S5.†) Unless otherwise noted, the values have been determined by approaching the transition from the soluble side i.e. TcL from the heating curve and TcU from the cooling curve. Micro-DSC was used to determine the temperature of maximum heat capacity (Tmax) and the enthalpy associated with the transition (ΔH). These values were always determined from the heating curves.Homopolymers
When a small amount of LiNTf2 is added to aqueous PAMPTMA-1, no profound thermal transitions can be observed (ESI, Fig. S6†). If the same experiment is conducted in 100 mM NaCl a clear UCST transition appears (ESI, Fig. S7†) in the presence of LiNTf2. Similar behaviour has recently been observed with two other polycations.53The TcU of PAMTPMA-1 (Fig. 1) can be tuned by adjusting the concentrations of LiNTf2 and NaCl. As can be seen from S8 in ESI,† the main factor determining TcU is the absolute concentration of LiNTf2, not the ratio between AMPTMA units and NTf2 anions. This simplifies the investigation of the copolymers in which the AMPTMA content varies. The phase separation is reversible and the transition temperatures were maintained constant when the measurement was conducted three times (ESI, Fig. S9†).
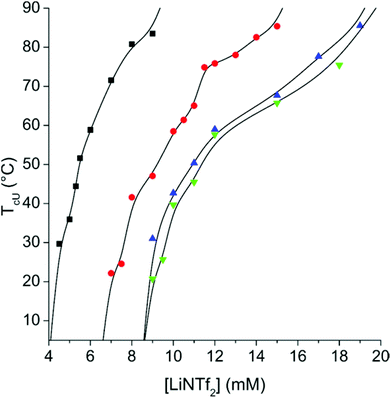 | ||
| Fig. 1 T cU of 1 mg mL−1 solution of PAMPTMA-1 as a function of LiNTf2 concentration with NaCl concentrations of 100 mM (■), 250 mM (●), 500 mM (▲) and 750 mM (▼). The lines are to guide the eye. | ||
The effect of the addition of LiNTf2 and NaCl to the solutions of PNIPAm-1 was studied calorimetrically. Calorimetry was not employed in the case of PAMPTMA-1, because the enthalpy change of the phase separation at the UCST is more than an order of magnitude lower than that of PNIPAm at the LCST.59
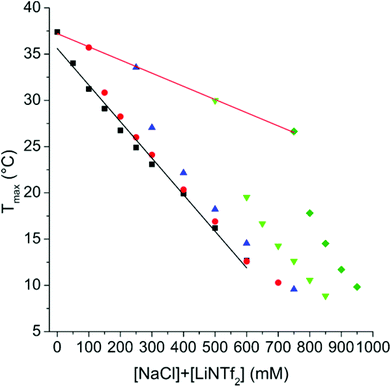
Values of Tmax (the maximum of the endothermic peak, see Fig. 2) show that increasing NaCl concentration decreases the transition temperature linearly, with a slope −14.3 °C M−1, which is in reasonable agreement with the literature values of −13 °C M−1 and −10.3 °C M−1.26,29 Also the effect of LiNTf2 concentration is linear, and the slope is −39.5 °C M−1. The highly negative slope of LiNTf2 is of the same order as the slopes of the strongest kosmotropes of the Hofmeister series, like NaSO4, which has a slope between −33.7 and −38.0 °C M−1, depending on the molecular weight of PNIPAm.29
The salts have a synergistic effect since the Tmax decreases faster in the case of mixtures than it does with either salt alone. In the case of the present pair of salts, the contributions of individual ions, as is the case with potassium halides, cannot be distinguished.26 The enthalpy associated with the PNIPAm phase separation is practically constant with the NaCl concentration, but decreases heavily when LiNTf2 is introduced (ESI, Fig. S10†).
Some representative thermograms of PNIPAm-1 are shown in ESI (Fig. S11†). Comparison of Fig. 1 and 2 reveals that LiNTf2 concentration has a much stronger effect on the transition temperature of PAMPTMA-1 than on PNIPAm-1. The observation indicates that the effect of LiNTf2 on the copolymers arises completely from interactions between AMPTMA units and NTf2 ions.
Copolymers
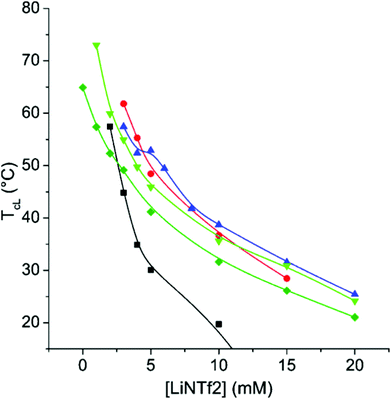
The TcL of CP-17 in varying NaCl concentrations can be altered within a broad range of temperatures by altering the LiNTf2 concentration (Fig. 3). LiNTf2 “switches off” the AMPTMA charges and thus the polymer becomes a PNIPAm copolymer, the hydrophilic/hydrophobic ratio of which can be varied after the polymerization. The adjustment of the ionic strength is crucial to screen the charges in the mixture. At a NaCl concentration of 750 mM the ionic strength is high enough to screen the charges so effectively that TcL is observable even without any LiNTf2. This effectively sets an upper limit to TcL.The results for CP-8 and CP-26 are qualitatively the same (ESI, Fig. S12 and S13†). The major difference is that with CP-8, 250 mM NaCl-concentration is enough for the detection of Tc without any LiNTf2, but with CP-26 not even 750 mM is enough for this. This is in line with the results of Soll et al. who studied copolymers of NIPAm and a cationic monomer in various concentrations of KBr.54 Due to electrostatic interactions, the transitions are broad even at 500 mM NaCl (ESI, Fig. S14†). The transition gets narrower with increasing concentrations of LiNTf2, indicating effective ion pairing and therefore “switching off” the charges. The TcL is fairly independent of the polymer concentration (ESI, Fig. S15†).
Altogether, the results with CP-8, CP-17, and CP-26 show that with these copolymers, the TcL is adjustable over a broad range of concentrations using NaCl and LiNTf2.
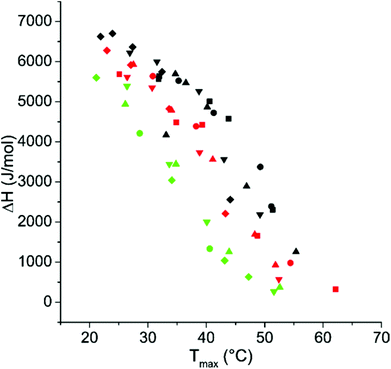
The enthalpy changes associated with the dehydration of NIPAm units upon thermal transition decrease with increasing transition temperature (Fig. 4). The results of the calorimetric measurements show similar trends as the turbidity measurements discussed above (ESI, Fig. S16–18†).
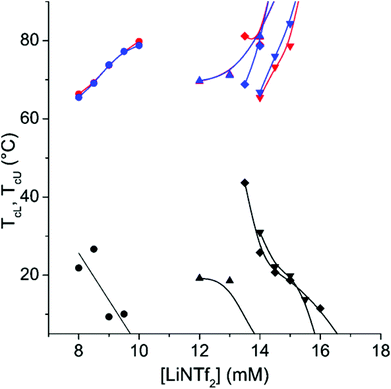
As CP-46 contains nearly equal amounts of the two different repeating units its phase separation characteristics show features of the corresponding homopolymers (Fig. 5). Evidently the ion pairing decreases the electrostatic repulsion at low temperatures, but when temperature increases the ion pairs start to dissociate. Thus, at high temperatures the electrostatic interactions overrule the hydrophobic ones and this leads to the redissolution of the polymer. As a result the polymer shows both TcL and TcU in NaCl containing solutions. Only very wide transitions can be observed in a solution without NaCl. The concentration range of LiNTf2 between complete solubility and complete insolubility is narrow, less than 4 mM in each case. The temperature range in which CP-46 is insoluble narrows as the polymer concentration decreases (ESI, Fig. S19†). Owing to the low NIPAm content of CP-46, the phase separation could not be observed calorimetrically.
As can be seen in Fig. 5, the phase separation at the TcU shows only minimal hysteresis. On the other hand, the hysteresis in the process occurring at TcL is very strong (Fig. 6). Longenecker et al. have observed similar behaviour for copolymers of hydroxyethyl methacrylate and a methacrylamide analogue of AMPTMA.50 They attribute this to the formation of hydrogen bonds, which probably is the case also with the copolymer of NIPAm and AMPTMA.
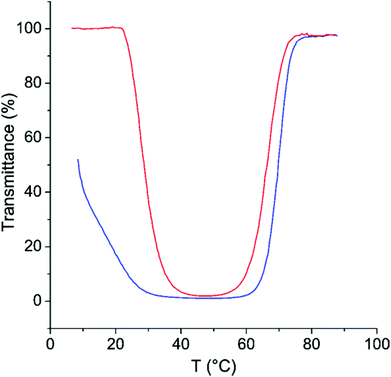 | ||
| Fig. 6 Transmittance as a function of temperature on heating (red) and on cooling (blue) for CP-46 in 500 mM NaCl with 14.5 mM LiNTf2. | ||
The formation of hydrogen bonds is known to be the reason for the hysteresis for the PNIPAm homopolymer.23 The much more pronounced hysteresis in the present case can be rationalized by the fact that AMPTMA units with NTf2 ions are hydrophobic at low temperatures and thus are more likely to remain hydrogen bound to NIPAm units instead of forming hydrogen bonds with water. The formation of complexes between the cationic groups of AMPTMA and amides of NIPAm in the collapsed state cannot be ruled out either.
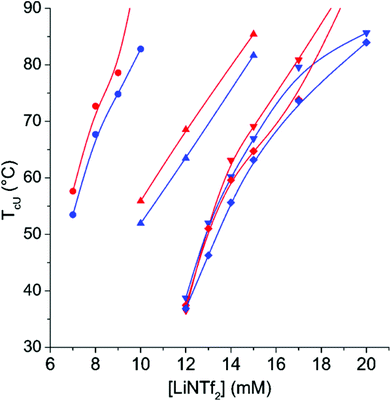
The AMPTMA content of CP-65 is so high that the polymer behaves as PAMPTMA-1 (Fig. 7). The polymer displays only TcU, which indicates that at low temperatures the solubility of PNIPAm is not sufficient to dissolve CP-65 in the presence of the added salts. The hysteresis upon the heating and cooling cycles is very small. Interestingly, comparison of Fig. 1 and 7 shows that TcU of PAMPTMA-1 is always higher than TcU of CP-65, when the NaCl and LiNTf2 concentrations are the same. In the CP-65–NTf2 system, NIPAm units seem to increase polymer solubility even at elevated temperatures.
Finally, a note on the reversibility of the transitions needs to be added. CP-46 did not show complete redissolution upon controlled cooling, as can be seen in Fig. 6. In general, addition of salts slowed down remixing. For PNIPAm-1 this was observed in 500 mM NaCl and for CP-8 in 10 mM LiNTf2 (ESI, Fig. S20 and S21†). A clear shoulder could be observed in the endotherms, and it did not totally vanish upon stabilizing the samples for 16 hours at 5 °C. However, when the time the sample was kept above TcL was minimized (ESI, Fig. S22 and S23†), or when the sample was quenched to the starting temperature, the system was completely reversible (Fig. S24†).
The slower redissolution of PNIPAm-1 in the salt solution is due to the poorer solvent quality of 500 mM NaCl for PNIPAm compared to pure water, and this is why the Tmax is also lower. It is known from PNIPAm in water that the redissolution slows down when the polymer is kept above its transition temperature for long.24 This is also the case for the present polymers and is probably due to the fact that intra- and intermolecular hydrogen bonds have more time to form.
Conclusions
Copolymers of NIPAm and cationic AMPTMA were successfully synthesized. The ratios of repeating units in the copolymers were similar to those in the feed. The determination of molecular weights proved to be difficult, but the polymers were of equal size and the molecular weights were narrowly distributed.The introduction of LiNTf2 to the solution of PAMPTMA-1 turned the polymer insoluble in water and a UCST type behaviour was observed when NaCl was also present in the solution. This is probably due to the ion pairing which is reversed at high temperatures. A sufficiently high concentration of NaCl is required to screen the charges in a way that the AMPTMA units and NTf2 ions do not “sense” each other, and the polymer dissolves. The competition between NTf2 and chloride ions of the cationic sites in the polymer made PAMPTMA-1 less sensitive to LiNTf2 at higher NaCl concentrations. The UCST behaviour as described above is reported for the first time for this particular pair of ions.
For PNIPAm, it was shown that LiNTf2 has an effect similar to the strongest kosmotropes in the Hofmeister series, seen as the strong transition temperature lowering effect of LiNTf2. Although the effect of LiNTf2 on the transition temperature of PNIPAm is strong, its effect on PAMPTMA is much stronger. Thus the effect of LiNTf2 on the copolymers arises mostly from the interactions between AMPTMA units and NTf2 ions.
The charges in the copolymers with a low AMPTMA content could be “switched off” with LiNTf2 due to the ion pairing. The addition of the bulky hydrophobic NTf2 anion to the copolymer solution is analogous to a case where NIPAm is copolymerized with a hydrophobic monomer. However, in the present case the “comonomer content” can be manipulated after the polymerization. As with the homopolymer PAMPTMA-1, the strength of the effect of LiNTf2 on the copolymer TcL is modulated by the presence of NaCl. In several cases the phase remixing was slow, which can be attributed to hydrogen and ionic bonds in the collapsed state.
When the AMPTMA content of the copolymer is sufficiently high, both LCST and UCST transitions occur. With the highest AMPTMA content, 65 mol%, only UCST could be observed, however, with less sensitivity towards LiNTf2 than was the case with the PAMPTMA-1 homopolymer.
In short, a new method has been developed to adjust the phase transition temperature(s) of NIPAm-containing copolymers. This should be also generally applicable to several thermosensitive copolymers that contain cationic units.
Acknowledgements
Financial support from the Academy of Finland (grant number 264990) and ERA.Net RUS (Project SILICAMPS) is gratefully acknowledged.References
- J. Seuring and S. Agarwal, Macromol. Rapid Commun., 2012, 33, 1898–1920 CrossRef CAS PubMed.
- M. Heskins and J. E. Guillet, J. Macromol. Sci., Chem., 1968, 2, 1441–1455 CrossRef CAS.
- V. Aseyev, H. Tenhu and F. M. Winnik, Adv. Polym. Sci., 2011, 242, 29–89 CrossRef CAS.
- S. Fujishige, K. Kubota and I. Ando, J. Phys. Chem., 1989, 93, 3311–3313 CrossRef CAS.
- Y. Xia, X. Yin, N. A. D. Burke and H. D. H. Stöver, Macromolecules, 2005, 38, 5937–5943 CrossRef CAS.
- Y. Xia, N. A. D. Burke and H. D. H. Stöver, Macromolecules, 2006, 39, 2275–2283 CrossRef CAS.
- K. Kubota, S. Fujishige and I. Ando, J. Phys. Chem., 1990, 94, 5154–5158 CrossRef CAS.
- P. Kujawa, V. Aseyev, H. Tenhu and F. M. Winnik, Macromolecules, 2006, 39, 7686–7693 CrossRef CAS.
- H. G. Schild and D. A. Tirrell, J. Phys. Chem., 1990, 94, 4352–4356 CrossRef CAS.
- Y. Maeda, T. Higuchi and I. Ikeda, Langmuir, 2000, 16, 7503–7509 CrossRef CAS.
- Y. Maeda, T. Nakamura and I. Ikeda, Macromolecules, 2001, 34, 1391–1399 CrossRef CAS.
- S. A. Deshmukh, S. K. R. S. Sankaranarayanan, K. Suthar and D. C. Mancini, J. Phys. Chem. B, 2012, 116, 2651–2663 CrossRef CAS PubMed.
- C. Wu and S. Zhou, Macromolecules, 1995, 28, 5388–5390 CrossRef CAS.
- C. Wu and X. Wang, Phys. Rev. Lett., 1998, 80, 4092–4094 CrossRef CAS.
- X. Wang, X. Qiu and C. Wu, Macromolecules, 1998, 31, 2972–2976 CrossRef CAS.
- E. I. Tiktopulo, V. E. Bychkova, J. Ricka and O. B. Ptitsyn, Macromolecules, 1994, 27, 2879–2882 CrossRef CAS.
- E. I. Tiktopulo, V. N. Uversky, V. B. Lushchik, S. I. Klenin, V. E. Bychkova and O. B. Ptitsyn, Macromolecules, 1995, 28, 7519–7524 CrossRef CAS.
- J. Heyda and J. Dzubiella, J. Phys. Chem. B, 2014, 118, 10979–10988 CrossRef CAS PubMed.
- Y. Maeda, T. Higuchi and I. Ikeda, Langmuir, 2001, 17, 7535–7539 CrossRef CAS.
- T. Principi, C. C. E. Goh, R. C. W. Liu and F. M. Winnik, Macromolecules, 2000, 33, 2958–2966 CrossRef CAS.
- H. G. Schild and D. A. Tirrell, Langmuir, 1991, 7, 665–671 CrossRef CAS.
- B. Sun, Y. Lin, P. Wu and H. W. Siesler, Macromolecules, 2008, 41, 1512–1520 CrossRef CAS.
- H. Cheng, L. Shen and C. Wu, Macromolecules, 2006, 39, 2325–2329 CrossRef CAS.
- K. Van Durme, G. Van Assche and B. Van Mele, Macromolecules, 2004, 37, 9596–9605 CrossRef CAS.
- H. Lai, Q. Chen and P. Wu, Soft Matter, 2013, 9, 3985–3993 RSC.
- R. Freitag and F. Garret-Flaudy, Langmuir, 2002, 18, 3434–3440 CrossRef CAS.
- Y. Zhang, S. Furyk, D. E. Bergbreiter and P. S. Cremer, J. Am. Chem. Soc., 2005, 127, 14505–14510 CrossRef CAS PubMed.
- Y. Zhang and P. S. Cremer, Curr. Opin. Chem. Biol., 2006, 10, 658–663 CrossRef CAS PubMed.
- Y. Zhang, S. Furyk, L. B. Sagle, Y. Cho, D. E. Bergbreiter and P. S. Cremer, J. Phys. Chem. C, 2007, 111, 8916–8924 CAS.
- I. Shechter, O. Ramon, I. Portnaya, Y. Paz and Y. D. Livney, Macromolecules, 2010, 43, 480–487 CrossRef CAS.
- H. Du, R. Wickramasinghe and X. Qian, J. Phys. Chem. B, 2010, 114, 16594–16604 CrossRef CAS PubMed.
- F. Kohori, K. Sakai, T. Aoyagi, M. Yokoyama, Y. Sakurai and T. Okano, J. Controlled Release, 1998, 55, 87–98 CrossRef CAS.
- S. Furyk, Y. Zhang, D. Ortiz-Acosta, P. S. Cremer and D. E. Bergbreiter, J. Polym. Sci., Part A: Polym. Chem., 2006, 44, 1492–1501 CrossRef CAS.
- M. Ito and T. Ishizone, J. Polym. Sci., Part A: Polym. Chem., 2006, 44, 4832–4845 CrossRef CAS.
- B. Ray, Y. Okamoto, M. Kamigaito, M. Sawamoto, K. Seno, S. Kanaoka and S. Aoshima, Polym. J., 2005, 37, 234–237 CrossRef CAS.
- T. Hirano, Y. Okumura, H. Kitajima, M. Seno and T. Sato, J. Polym. Sci., Part A: Polym. Chem., 2006, 44, 4450–4460 CrossRef CAS.
- F. M. Winnik, H. Ringsdorf and J. Venzmer, Macromolecules, 1990, 23, 2415–2416 CrossRef CAS.
- H. G. Schild, M. Muthukumar and D. A. Tirrell, Macromolecules, 1991, 24, 948–952 CrossRef CAS.
- H. Feil, Y. H. Bae, J. Feijen and S. W. Kim, Macromolecules, 1993, 26, 2496–2500 CrossRef CAS.
- Y. G. Takei, T. Aoki, K. Sanui, N. Ogata, T. Okano and Y. Sakurai, Bioconjugate Chem., 1993, 4, 341–346 CrossRef CAS.
- Z. Shen, K. Terao, Y. Maki, T. Dobashi, G. Ma and T. Yamamoto, Colloid Polym. Sci., 2006, 284, 1001–1007 CAS.
- J. E. Chung, M. Yokoyama, T. Aoyagi, Y. Sakurai and T. Okano, J. Controlled Release, 1998, 53, 119–130 CrossRef CAS.
- H. Liu, D. Avoce, Z. Song and X. X. Zhu, Macromol. Rapid Commun., 2001, 22, 675–680 CrossRef CAS.
- Y. Weng, Y. Ding and G. Zhang, J. Phys. Chem. B, 2006, 110, 11813–11817 CrossRef CAS PubMed.
- T. Maeda, K. Yamamoto and T. Aoyagi, J. Colloid Interface Sci., 2006, 302, 467–474 CrossRef CAS PubMed.
- Y. Maeda, H. Yamamoto and I. Ikeda, Langmuir, 2001, 17, 6855–6859 CrossRef CAS.
- G. Bokias, G. Staikos and I. Iliopoulos, Polymer, 2000, 41, 7399–7405 CrossRef CAS.
- T. Mori, M. Nakashima, Y. Fukuda, K. Minagawa, M. Tanaka and Y. Maeda, Langmuir, 2006, 22, 4336–4342 CrossRef CAS PubMed.
- J. Fang, F. Bian and W. Shen, J. Appl. Polym. Sci., 2008, 110, 3373–3378 CrossRef CAS.
- R. Longenecker, T. Mu, M. Hanna, N. A. D. Burke and H. D. H. Stöver, Macromolecules, 2011, 44, 8962–8971 CrossRef CAS.
- R. Marcilla, J. A. Blazquez, R. Fernandez, H. Grande, J. A. Pomposo and D. Mecerreyes, Macromol. Chem. Phys., 2005, 206, 299–304 CrossRef CAS.
- E. Karjalainen, V. Aseyev and H. Tenhu, Macromolecules, 2014, 47, 2103–2111 CrossRef CAS.
- E. Karjalainen, V. Aseyev and H. Tenhu, Macromolecules, 2014, 47, 7581–7587 CrossRef CAS.
- S. Soll, M. Antonietti and J. Yuan, ACS Macro Lett., 2012, 1, 84–87 CrossRef CAS.
- S. Strandman, P. Pulkkinen and H. Tenhu, J. Polym. Sci., Part A: Polym. Chem., 2005, 43, 3349–3358 CrossRef CAS.
- J. Wang and K. Matyjaszewski, J. Am. Chem. Soc., 1995, 117, 5614–5615 CrossRef CAS.
- B. A. Pineda-Contreras, F. Liu and S. Agarwal, J. Polym. Sci., Part A: Polym. Chem., 2014, 52, 1878–1884 CrossRef CAS.
- E. V. Korchagina, X. Qiu and F. M. Winnik, Macromolecules, 2013, 46, 2341–2351 CrossRef CAS.
- J. Seuring, F. M. Bayer, K. Huber and S. Agarwal, Macromolecules, 2012, 45, 374–384 CrossRef CAS.
Footnote |
| † Electronic supplementary information (ESI) available: NMR-spectra, definitions of the cloud points, representative transmittance as a function of temperature curves, TcL as a function of LiNTf2 concentration for CP-8 and CP-26, effect of polymer concentration on TcL and TcU, representative micro-DSC-thermograms, and figures on the effect of heating rate on reversibility of the transitions. See DOI: 10.1039/c4py01700e |
| This journal is © The Royal Society of Chemistry 2015 |

