
 Open Access Article
 This Open Access Article is licensed under a
 Creative Commons Attribution 3.0 Unported Licence
Fluorinated counterion-enhanced emission of rhodamine aggregates: ultrabright nanoparticles for bioimaging and light-harvesting†
Ievgen
Shulov
ab,
Sule
Oncul
ac,
Andreas
Reisch
a,
Youri
Arntz
a,
Mayeul
Collot
a,
Yves
Mely
a and
Andrey S.
Klymchenko
*a
aLaboratoire de Biophotonique et Pharmacologie, UMR 7213 CNRS, Université de Strasbourg, Faculté de Pharmacie, 74, Route du Rhin, 67401 ILLKIRCH Cedex, France. E-mail: andrey.klymchenko@unistra.fr; Tel: +33 368 85 42 55
bOrganic Chemistry Department, Chemistry Faculty, Taras Shevchenko National University of Kyiv, 01601 Kyiv, Ukraine
cDepartment of Biophysics, School of Medicine, Istanbul Medeniyet University, 34700 Istanbul, Turkey
First published on 2nd October 2015
Abstract
The key to ultrabright fluorescent nanomaterials is the control of dye emission in the aggregated state. Here, lipophilic rhodamine B derivatives are assembled into nanoparticles (NPs) using tetraphenylborate counterions with varied fluorination levels that should tune the short-range dye ordering. Counterion fluorination is found to drastically enhance the emission characteristics of these NPs. Highly fluorinated counterions produce 10–20 nm NPs containing >300 rhodamine dyes with a fluorescence quantum yield of 40–60% and a remarkably narrow emission band (34 nm), whereas, for other counterions, aggregation caused quenching with a weak broad-band emission is observed. NPs with the most fluorinated counterion (48 fluorines) are ∼40-fold brighter than quantum dots (QD585 at 532 nm excitation) in single-molecule microscopy, showing improved photostability and suppressed blinking. Due to exciton diffusion, revealed by fluorescence anisotropy, these NPs are efficient FRET donors to single cyanine-5 acceptors with a light-harvesting antenna effect reaching 200. Finally, NPs with the most fluorinated counterion are rather stable after entry into living cells, in contrast to their less fluorinated analogue. Thus, the present work shows the crucial role of counterion fluorination in achieving high fluorescence brightness and photostability, narrow-band emission, efficient energy transfer and high intracellular stability of nanomaterials for light harvesting and bioimaging applications.
Introduction
Designing brightly fluorescent nanomaterials is the key step for obtaining fluorescent nanoparticles (NPs) for imaging applications.1,2 Quantum dots are considered as the brightest materials among inorganic NPs, since their cores of ∼5 nm diameter can exhibit extinction coefficients up to 106 M−1 cm−1 together with high quantum yields (40–100%).3,4 However, for imaging applications, QDs require a robust water-compatible shell, which makes them much larger with a hydrodynamic radius usually around 15–25 nm. On the other hand, it is well known that organic dyes present an even higher capacity to absorb photons, with extinction coefficients of 105–3 × 10⁵ M−1 cm−1 for molecules with a size of only ∼1 nm and that they also emit with high quantum yields (20–100%).5 Hence, the organization of organic dyes in the form of water-compatible NPs should lead to nanomaterials with comparable or better brightness than QDs of the same size. Moreover, these organic fluorescent nanomaterials are potentially biodegradable in contrast to QDs, making them particularly attractive for biomedical imaging applications.1,2 Several organic systems have already been developed: conjugated polymer NPs,6,7 dye-doped polymer NPs8–14 and dye-based NPs.10,11,15–17 Conjugated polymer NPs are probably the brightest organic nanomaterials,6,18,19 but, they lack biodegradability, due to their polymer backbone made from carbon–carbon bonds. Dye-based NPs are of particular interest because of their very high density of fluorophores per volume compared to dye-doped (blended) systems, where the dye is diluted in a matrix. However, the major problem of dye-based particles is aggregation-caused quenching (ACQ), originated from aggregation of usually flat fluorophores into non-fluorescent pi-stacked structures (H-aggregates).20,21 In recent years, several solutions to the ACQ problem were proposed, where fluorophores exhibit unique arrangements in the solid phase, so that self-quenching is prevented.11,17,22 The first one exploits the phenomenon of aggregation induced emission (AIE),23–25 where non-radiative pathways due to internal rotations are prevented after aggregation of the fluorophores in the form of distorted H- or J-aggregates. The second approach is to couple bulky groups to the fluorophore, as it was shown for BODIPY,26 fluorene27 and push–pull triphenylamine28 derivatives. The third approach utilizes dye salts with bulky counterions, so-called non-coordinating ions,29 which serve as spacers for ionic dyes inside NPs.30,31 Warner et al. named this type of salts “frozen ionic liquids”,30 because they presented intermediate properties between ordered crystals and disordered liquids, while Yao et al. called “ion-association” the process to form NPs from these salts.32 This approach was mainly applied to cyanines,31,33–35 using different counterions, such as bis(trifluoromethanesulfonyl)imide, bis(pentafluoroethanesulfonyl)imide,33 bis(2-ethylhexyl)sulfosuccinate30 and tetraphenylborate derivatives.31,36 Many of these counterions contain fluorine atoms, but so far there has been no systematic study showing the importance of counterion fluorination on the emission properties of the ion-associated (we will call them counterion-assembled) NPs. The role of fluorine is particularly important, because fluorinated groups exhibit strong electron withdrawing and super-hydrophobic properties, orthogonal to aqueous and organic species.37–39 Highly fluorinated, or fluorous compounds, were successfully used in molecular electronics40–43 as well as in vivo for imaging and oxygen delivery.44–46 Importantly, fluorination was also reported to improve the characteristics of photovoltaic materials,47,48 and fluorescent properties of dyes49 and nanomaterials.50,51 On the other hand, the single particle emission performance of counterion-assembled NPs has not been sufficiently addressed, so it remains unclear, whether these systems can really compete with QDs. Rhodamine derivatives are probably the most interesting dyes for constructing ultrabright nanomaterials, because of their high extinction coefficient, excellent quantum yields (40–100%) and photostability.5,52 Recently, we showed that self-quenching of rhodamines in a polymer matrix can be strongly reduced using perfluorinated tetraphenylborate, though this was not the case with all tetraphenyl-borate derivatives.9 Moreover, we showed that these systems presented exceptional collective behavior, suggesting that the rhodamine molecules were assembled by the counterions inside the polymer matrix into a unique arrangement.In the present work, we prepared NPs through nano-precipitation of rhodamine B derivatives bearing different alkyl chains with tetraphenylborate counterions containing different numbers of fluorine atoms (0 to 12 per phenyl). We found that fluorination of the counterion drastically enhanced the characteristics of rhodamine NPs: increased the fluorescence quantum yield, narrowed the emission band in comparison to the dye in solution, enhanced the brightness and photostability at the single-particle level and finally improved the stability of the NPs inside living cells. As a result, for the most fluorinated counterion, we obtained NPs of 20 nm size with a brightness corresponding to >300 rhodamine molecules and a quantum yield of 60% (extinction coefficient × quantum yield = 2.4 × 10⁷ M−1 cm−1). Single molecule microscopy suggested that they were 40-fold brighter than QDs of similar color (QD585 at 532 nm excitation) and comparable hydrodynamic diameter. The obtained NPs were found promising for light-harvesting and bioimaging applications.
Results
Dyes and counterions
Alkyl rhodamine B was selected as a cationic dye, for which the length of the alkyl chain was varied from 2 (R2) to 18 (R18) (Fig. 1). Variation of the length of the alkyl chain may influence the organization and mode of interaction with the hydrophobic counterion. As counterions, we selected five bulky anions with increasing fluorination level: from non-fluorinated (TPB) to 12 fluorines (F12-TPB) per phenyl ring (Fig. 1). In addition to the number of fluorine groups, these ions differ by size, with the nonfluorinated TPB being the smallest (∼1.08 nm diameter), while F12-TPB being the largest (∼1.6 nm diameter). We hypothesized that the level of fluorination and the size of the counterion could change the molecular arrangement of the dyes and vary the inter-fluorophore distance.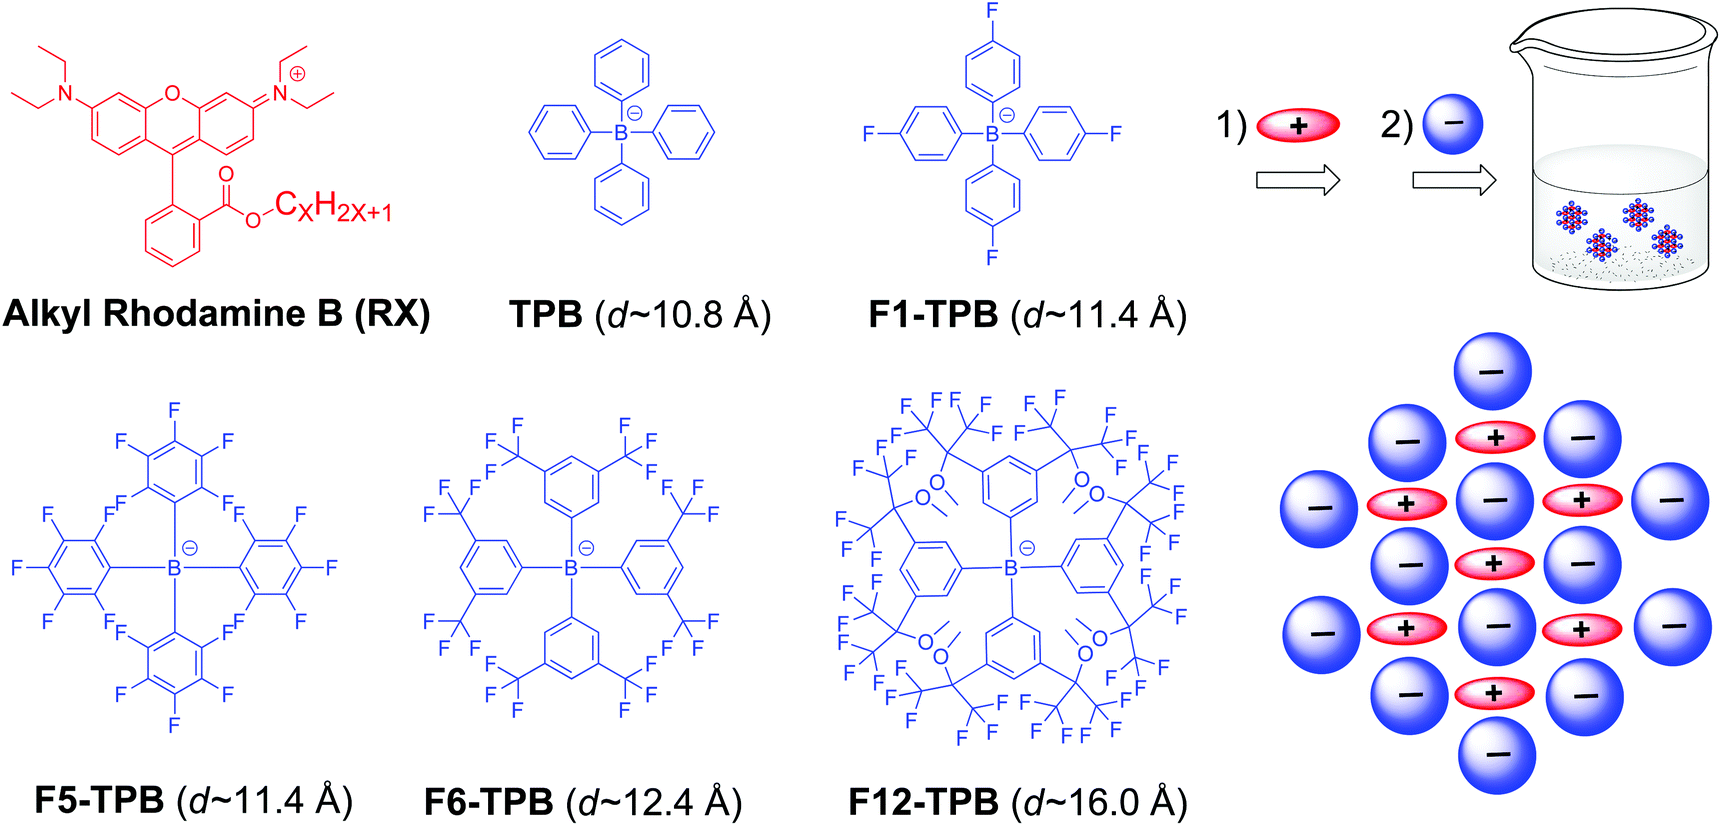 | ||
| Fig. 1 Chemical structures of the rhodamine B derivatives (RX, X varies from 2 to 18) and the different tetraphenylborate counterions used in this work. | ||
Ion-association: formation of NPs
In the ion-association method for preparation of fluorescent NPs, the hydrophobic cation and anion dissolved in water are mixed together to form insoluble salts that may precipitate in the form of NPs.30–33 Primarily, we checked whether our alkyl-rhodamines are well soluble in water at micromolar concentrations and do not form aggregates without the hydrophobic counterion. The absorption spectrum of dodecyl-rhodamine B (R12) iodide in water was composed of one band with the maximum centered at 561 nm with a relatively low-intensity short-wavelength shoulder located ∼30 nm from the maximum similar to that in methanol (Fig. 2A). Earlier studies showed that, the relative intensity of this shoulder, being low in molecular form, increases drastically on the formation of non-fluorescent H-aggregates.9 Hence, in aqueous medium R12 probably remains in the molecular form. The same behavior was observed for all rhodamines with alkyl chain lengths ≤12, where the relative intensity of the short-wavelength shoulder was Ashoulder/Amaximum = 0.34–0.36 (Fig. 2B). By contrast, the most hydrophobic derivative R18 iodide in water showed a much larger relative intensity of the short-wavelength shoulder (0.57, Fig. 2B and S1†), suggesting the formation of H-aggregates, where the R18 dyes are pi-stacked.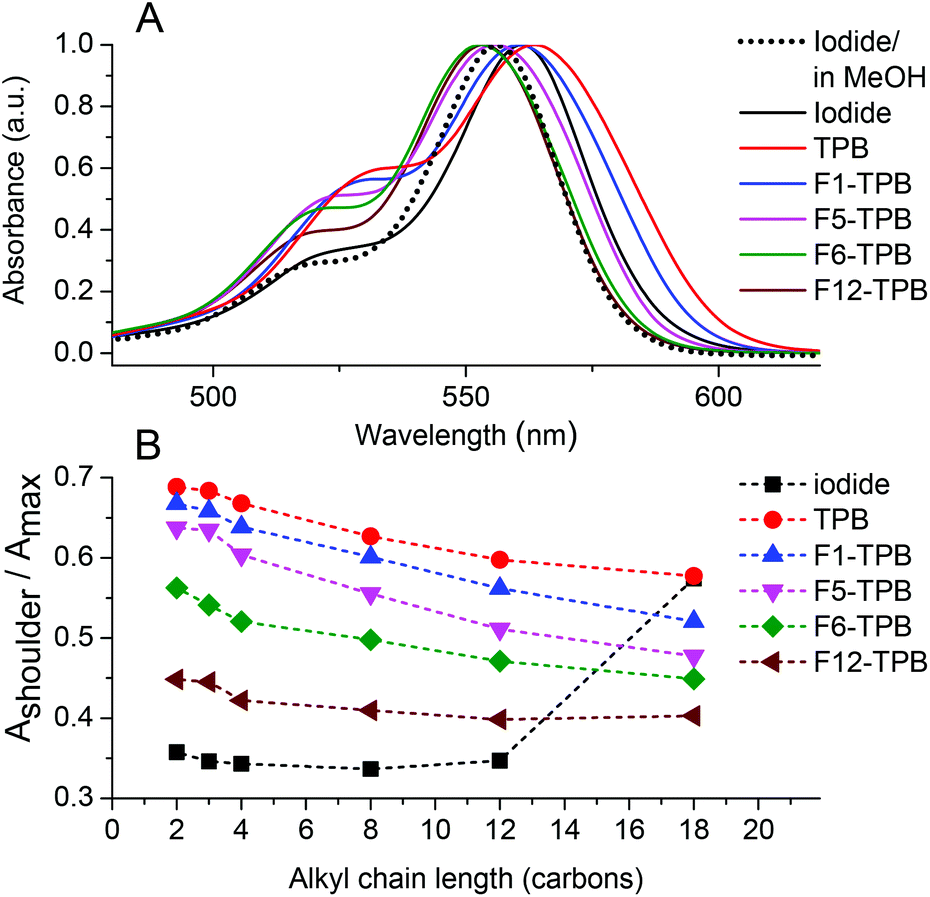 | ||
| Fig. 2 Effect of counterion fluorination and alkyl chain length on the absorption spectra of alkyl rhodamines B in water. (A) Normalized absorption spectra of R12 NPs with different TPB counterions and comparison to R12 iodide in water. (B) Absorbance ratio of the short-wavelength shoulder to the maximum for different alkyl chains and counterions. | ||
Then, we studied the formation of NPs by ion-association. To this end, we mixed an alkyl rhodamine B derivative in water (1 μM) with a 10-fold molar excess of the corresponding borate counterion. In the presence of the non-fluorinated TPB counterion, the band maximum of R12 was red-shifted and the short-wavelength shoulder increased compared to iodide as a counterion, indicating that the dyes aggregate in the presence of this counterion (Fig. 2A). This phenomenon was observed for all rhodamine B derivatives with alkyl chain lengths ≤12, as can be seen from the high short-wavelength shoulder in the presence of TPB (Fig. 2B). In the case of R18, which was already aggregated in water, the addition of TPB did not change this ratio significantly. The nature of the borate counterion had an important influence on the absorption spectra of the dyes. Indeed, the contribution of the short-wavelength shoulder decreased with increasing TPB fluorination: TPB > F1-TPB > F5-TPB > F6-TPB > F12-TPB. Thus, higher fluorination of TPB decreased H-aggregation of rhodamine B fluorophore in these assemblies. Moreover, the band maximum shifted to the blue with increasing counterion fluorination. As a result for F6-TPB and F12-TPB counterions, the absorption maximum of the dye was blue shifted by ca. 8 nm with respect to that in water. This shift originates probably from the unique super-hydrophobic fluorinated environment of the dye within the aggregates. It should be also noted that with most counterions, an increase in the length of the alkyl chain decreased the fraction of H-aggregates (Fig. 2B).
Dynamic light scattering (DLS) data showed that R12 in the presence of hydrophobic counterions forms relatively small particles with TPB and F1-TPB counterions (∼25 nm), but a bit larger ones (32–50 nm) with highly fluorinated counterions, F5-TPB, F6-TPB and F12-TPB (Table 1). However, we suspected that DLS data for NPs built from highly fluorinated counterions were biased because of their strong fluorescence (see below). Therefore, we additionally studied all NPs by atomic force microscopy (AFM). We found that R12 salts with different counterions form NPs of 21–22 nm diameter, except F5-TPB giving 11 nm NPs (Table 1, and Fig. 3, S2, S3†). Importantly, these NPs presented very high negative zeta potentials between −51 and −74 mV (Table 1). The zeta potential decreased from +70 to −51 mV, when the ratio of TPB/R12 increased from 1 to 10 (Fig. S4†). This suggests that the negative surface charge originates from the adsorption of the excess of borate counterions at the particle surface. The latter create a negatively charged protection shell that can explain the formation of small NPs.
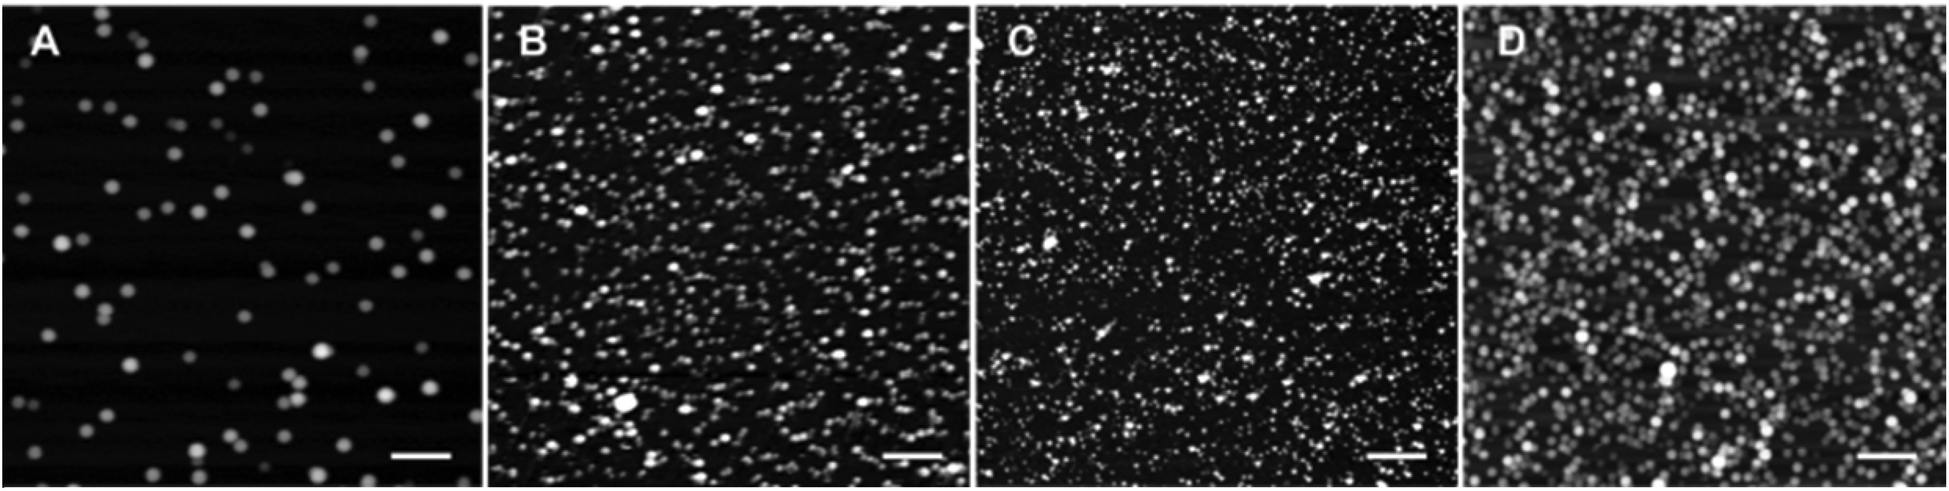 | ||
| Fig. 3 Atomic force microscopy of NPs assembled from R12 with fluorinated counterions TPB (A), F1-TPB (B), F5-TPB (C) and F12-TPB (D). The imaging was done in the liquid phase with 10–100 mM CaCl2 (B). Scale bar is 500 nm. Particle diameter was estimated from the height measurements, because the measured lateral dimensions of NPs depended on the AFM tip geometry. | ||
| Counterion | Diameter (nm) | Polydispersity (PDI) | Zeta potential (mV) | Diameter (AFM)b (nm) |
|---|---|---|---|---|
| a The values obtained for these NPs by DLS are probably affected by their efficient fluorescence. b Diameter was obtained from height AFM measurements. | ||||
| TPB | 25 (±1) | 0.19 | −51 (±5) | 22 (±2) |
| F1-TPB | 26 (±1) | 0.15 | −52 (±3) | 22 (±2) |
| F5-TPBa | 25 (±2) | 0.17 | −58 (±8) | 11 (±1) |
| F6-TPBa | 40 (±2) | 0.19 | −80 (±7) | 21 (±2) |
| F12-TPBa | 45 (±2) | 0.16 | −74 (±4) | 21 (±2) |
We then verified whether these NP suspensions of R12 salts with different counterions are stable over time. To this end, we studied the absorbance values of these suspensions in plastic cuvettes as a function of time. The decrease in the absorbance value depended clearly on the fluorination level: iodide ∼ TPB > F1-TPB > F5-TPB ∼ F6-TPB (Fig. 4). As the shape of the absorption spectra for these counterions remained unchanged with time, we could conclude that the decrease in the absorption, observed mainly for non-fluorinated counterions, was related to sedimentation of the particles and their adsorption on the walls of the cuvette. On the other hand the most fluorinated one F12-TPB showed an increase in the absorbance with time, especially in the first 1 h. This initial rapid increase in absorbance was associated with a decrease in the short-wavelength shoulder (data not shown), probably reflecting the “maturation” of the NPs towards minimum dye H-aggregation. This maturation was observed only for F12-TPB, probably because this large counterion requires more time to stably assemble with the R12 dye. Overall, we could conclude that the increase in counterion fluorination improved the stability of suspensions of NPs against sedimentation and adsorption to the walls of the plastic cuvette. For the most promising NPs (R12/F12-TPB) the stability was tested at different biologically relevant pH. In the pH range of 5.0–9.0 within 24 h, absorption measurements suggested no signs of sedimentation of NPs, while DLS showed no significant variations in their size (Fig. S5†).
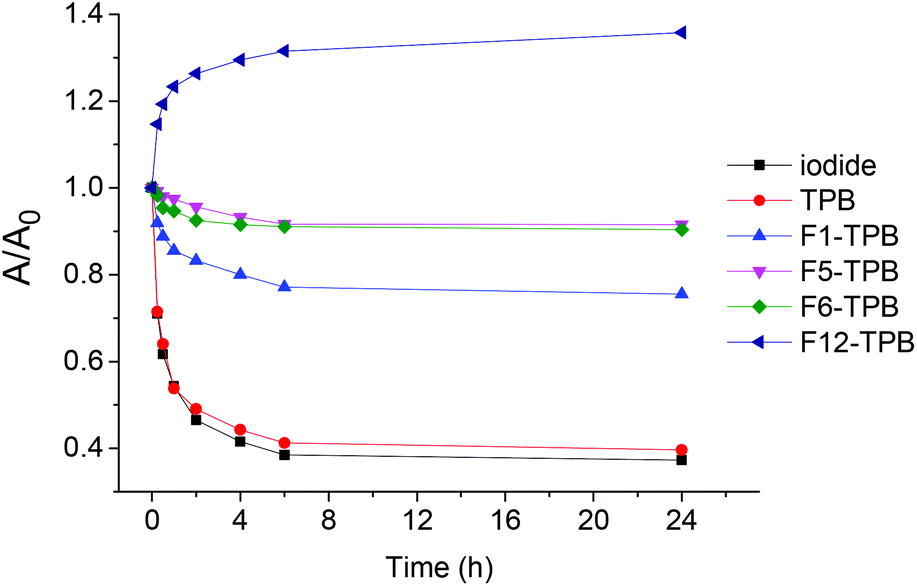 | ||
| Fig. 4 Maturation and stability of NPs assembled from R12 dye with different counterions in plastic cuvettes measured by the absorbance at the maximum. Concentrations of R12 and TPB counterions were 1 μM and 10 μM, respectively. | ||
Fluorescence properties of NPs
Encouraged by the AFM and stability data, we next studied the effect of counterions on the NPs’ fluorescence properties. The fluorescence quantum yield (QY) of NPs showed a remarkable variation as a function of the counterion. Iodide derivatives with a chain length from 2 to 12 showed high QY in water, in agreement with highly efficient fluorescence of the molecular form of rhodamine B in water (Fig. 5). By contrast, R18 bearing a long C18 alkyl chain, showed a very low QY, which is clearly due to the aggregation-induced self-quenching in water, in line with the absorption spectral data. While non-fluorinated TPB induced strong quenching with QY values <1% for all dyes, an increase in the fluorination level of TPB produced a systematic increase in the quantum yield: TPB < F1-TPB ≪ F5-TPB < F6-TPB < F12-TPB (Fig. 5). As a result, the QY values for F12-TPB were 2-fold larger than those in water, reaching >60%. This increase in QY for counterions with higher fluorination correlated perfectly with the decrease in the H-aggregation state of rhodamine B suggested by absorption spectroscopy. The length of the alkyl chains on rhodamine B had some influence on QYs only for the TPB counterions with intermediate fluorination levels, F5-TPB and F6-TPB, where the QY values increased for the longer alkyl chains (Fig. 5).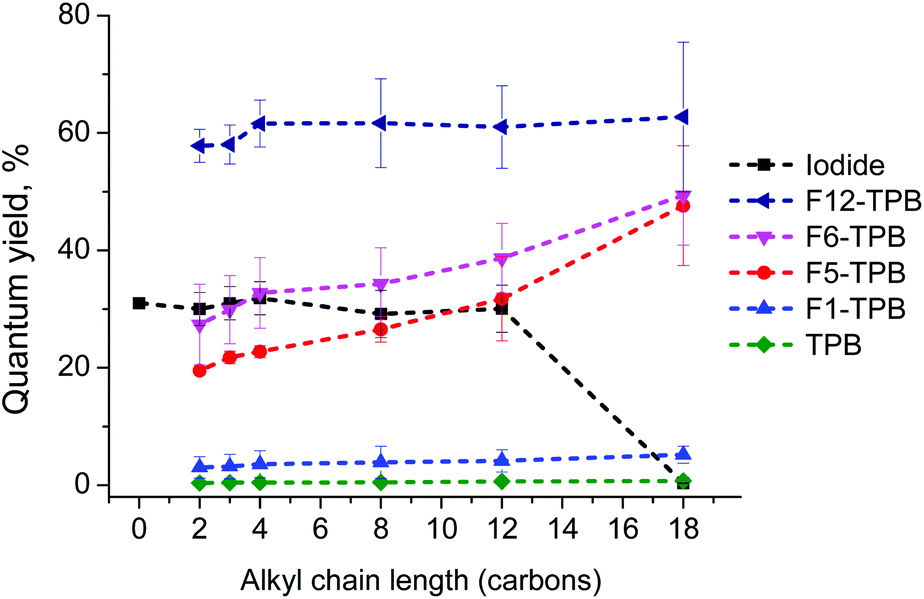 | ||
| Fig. 5 Fluorescence quantum yields of NPs assembled from alkyl rhodamine B derivatives with different counterions in water. Rhodamine B in water was used as a reference for the quantum yield measurements (QY = 31%).53 | ||
The nature of the counterion also influenced the spectral shape of the emission of the obtained NPs. We found that the emission maximum shifted to the blue and the long-wavelength shoulder decreased with increasing TPB fluorination level (Fig. 6A). The emission spectra resembled closely to the mirror-image of the absorption spectra. The striking observation was that the emission band narrowed significantly with an increase in the fluorination level (Fig. 6B). Thus, in comparison to R12 iodide in water, the FWHM of the salts with F5-TPB and F12-TPB decreased from 41 nm to 34 nm. A similar tendency was observed for rhodamine B with other alkyl chain lengths. The sharper emission bands may indicate that highly fluorinated TPB counterions not only decrease the H-aggregation inside NPs but also create a rigid environment for the rhodamine dyes.
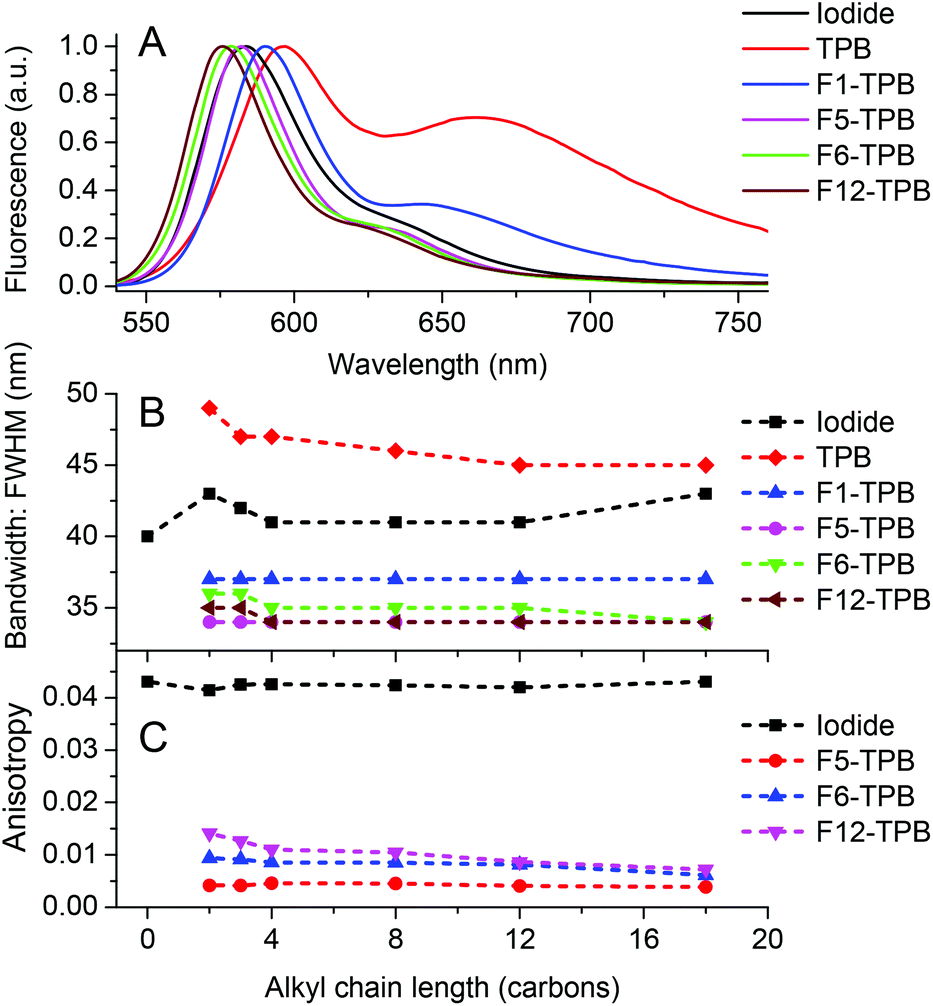 | ||
| Fig. 6 Effect of the counterion fluorination and the chain length of alkyl rhodamine B on the fluorescence properties of NPs. (A) Normalized fluorescence spectra of R12 with different counterions in water. (B) Full width at half maximum (FWHM) for rhodamine B dyes with alkyl chains of different lengths with different counterions. (C) Fluorescence anisotropy of alkyl rhodamine B dyes in the presence of selected fluorinated counterions. | ||
Fluorescence anisotropy is a measure of the polarization of the emitted light with respect to polarized excitation and is normally used to access the mobility of the fluorophore in a given environment. However, this value can be strongly altered when the excitation energy migrates through dyes exhibiting different orientations within dye assemblies.54–56 Here, we studied the fluorescence anisotropy of alkyl rhodamine B salts that exhibited high fluorescence QYs, because quenching produces deviation of the anisotropy upwards. All rhodamine B iodides showed an anisotropy value around 0.041–0.043, which is typical for Rhodamine B in water. By contrast, the rhodamine salts with fluorinated TPB, expected to be in the form of NPs, exhibited 5–10-fold lower anisotropy values (Fig. 6C). As the fluorophore rotation inside NPs should be much slower compared to that in water, the low anisotropy values are likely due to very fast energy migration inside NPs. This is not surprising, as the distance between the fluorophores is controlled by the size of the TPB counterions, and thus, varies between 1 and 2 nm. Taking into account that the Förster radius for homo-FRET of alkyl rhodamine B is 5.2 nm,9 the excitation energy should undergo very fast transfer between the dyes at distances around 1 nm, efficiently depolarizing the emission of the NPs. These results are in line with the low anisotropy values described earlier for polymer NPs encapsulating a salt of R18 with F5-TPB, where energy migration was suggested to occur on a time scale below 30 ps.9 Remarkably, the anisotropy values increased with increasing fluorination level: F5-TPB < F6-TPB < F12-TPB, suggesting that energy migration is likely the slowest with the F12-TPB counterion. We can hypothesize that F12-TPB, being larger than F5-TPB, should further separate the fluorophores and thus, slow down the energy migration. Alternatively, in the case of F12-TPB, the dyes may have some levels of preferential orientation, which could also contribute to the observed slightly higher values of anisotropy.
Single-particle fluorescence
We then took the most representative ion pairs, R12/F5-TPB and R12/F12-TPB and studied their fluorescence properties at the single particle level. First, we used fluorescence correlation spectroscopy, which is a powerful method to characterize simultaneously the size, brightness and concentration of NPs.57,58 The correlation times obtained for R12 salts with F5-TPB and F12-TPB were 0.60 and 0.82 ms, which corresponded to NPs of 14 and 19 nm hydrodynamic diameters, respectively (Table 2). These data are in line with our observations by AFM (Table 1). The corresponding single particle brightnesses for these NPs were 340 and 540 equivalents of single rhodamine B dyes in solution. To understand this exceptional brightness of the NPs, we estimated the number of dyes per NPs. We first did an estimation based on the size of NPs assuming the core size (without a monolayer of the TPB counterions of ∼1 nm) of 12 and 17 nm for F5-TPB and F12-TPB, respectively and taking the core density of 1 g ml−1. In this case, the numbers of R12 dyes should be ∼420 and ∼650 for F5-TPB and F12-TPB, respectively. In the alternative approach using FCS, we measured the particle concentrations of 3.1 and 3.4 nM for F5-TPB and F12-TPB, respectively. Then, knowing that the total concentration of R12 in solution is 1 μM, we could estimate the number of R12 dyes per particle to be 340 and 320 for F5-TPB and F12-TPB counterions, respectively, which is in reasonable agreement with theoretical estimations based on the particle size. In the case of F5-TPB, the QY of dyes inside the NPs is close to that of rhodamine B in solution, so that the brightness corresponds well to the number of R12 per particle. In the case of F12-TPB, the QY of the dye in the NPs was nearly double, which explains the nearly twice as high brightness of the corresponding NPs. In comparison to commercial polystyrene NPs of similar color (FluoroSpheres® 535/575, FS-28, Table 2), our particles were 50–70 fold brighter while being of smaller size. In contrast, they were a bit less bright than QD585, likely as a result of the exceptionally high two-photon absorption cross-section of QDs,3 as compared to FluoroSpheres® and our NPs.| R12/F5-TPB | R12/F12-TPB | FS-28 | QD-585 | |
|---|---|---|---|---|
| a FCS and single particle measurements used two-photon and one-photon excitation, respectively. Number is the number of emissive species per excitation volume; τcorr is the correlation time; size is the hydrodynamic diameter; Bri/RhB is the brightness with respect to one molecule of rhodamine B; Conc. is the concentration of emissive species; dyes/NP is the estimated number of R12 dyes per particle. SP-bri is the single-particle brightness based on the photon count obtained from the wide field fluorescence microscopy images of NPs in a gel. The relative values with respect to QD-585 are given. | ||||
| Number | 0.88 ± 0.1 | 1.0 ± 0.2 | 2.5 ± 0.3 | 0.57 ± 0.05 |
| τ corr | 0.60 ± 0.05 | 0.82 ± 0.08 | 1.5 ± 0.1 | 0.98 ± 0.08 |
| Size, nm | 14 ± 2 | 19 ± 3 | 38 ± 1 | 22 ± 2 |
| Bri/TMR | 310 ± 40 | 500 ± 100 | 8 ± 2 | 780 ± 90 |
| Bri/RhB | 340 ± 40 | 540 ± 100 | 8 ± 2 | 850 ± 100 |
| Conc.,nM | 3.1 ± 0.4 | 3.4 ± 0.7 | 9.4 ± 0.4 | 1.8 ± 0.3 |
| Dyes/NP | 340 ± 50 | 320 ± 90 | — | — |
| SP-bri | 10 ± 1 | 40 ± 4 | 36 ± 5 | 1.0 ± 0.1 |
In the second approach, we diluted our R12/F5-TPB and R12/F12-TPB NPs in polyvinyl alcohol gels and imaged single particles using wide-field fluorescence microscopy, with one-photon excitation. The data were directly compared to commercial FluoroSpheres® 535/575 and QD-585. We found that our NPs appeared as bright dots with an about 4-fold higher average intensity for F12-TPB NPs as compared to F5-TPB NPs, which is in line with the higher QY and FCS brightness of the former. Moreover, F12-TPB NPs were as bright as FluoroSpheres® and ∼40-fold brighter than QD-585 (Table 2 and Fig. 7). According to FCS, the number of R12 dyes per F12-TPB NPs is 320, so that their total brightness is N × ε × QY = 320 × 125![[thin space (1/6-em)]](https://www.rsc.org/images/entities/char_2009.gif) 000 × 0.6 = 2.4 × 10⁷ M−1 cm−1. When excited at 532 nm, this value is slightly lower: 320 × 57000 × 0.6 = 1.1 × 10⁷ M−1 cm−1. On the other hand, FCS suggests that the brightness of R12/F12-TPB NPs corresponds to that of 540 rhodamine B molecules in solution. This should be valid for both two-photon and single photon excitation as our NPs are composed of the same rhodamine B fluorophore. Therefore, the estimated brightness of our NPs excited at 532 nm is N × ε(532) × QY = 540 × 57000 M−1 cm−1 × 0.31 = 9.5 × 10⁶ M−1 cm−1, which is very close to that estimated from the number of dye particles. In contrast, the brightness of QD-585 at 532 nm (one-photon) excitation is ε × QY = 310000 M−1 cm−1 × 0.67 = 2.1 × 10⁵ M−1 cm−1 and thus, >45-fold less bright than our counterion-assembled NPs. Thus, the experimental difference in brightness obtained by microscopy confirms the theoretical estimations. The other remarkable feature was that ∼50% of NPs built from F5-TPB showed rapid blinking that ended up with a dark state of the particles (Fig. 7E). Previously, we showed a similar phenomenon for PLGA NPs loaded with a similar dye (R18) with the same F5-TPB counterion and assigned it to fast excitation energy migration through the dyes.9 However, some heterogeneity in the particle behavior was observed, so that the averaged curve obtained from multiple particles of the image showed a smoother drop in the fluorescence, with nevertheless a loss of ∼50% of initial intensity within 2 seconds (Fig. 7F). By contrast, F12-TPB did not show blinking behavior, with only a few exceptions, as we could see from the relatively stable and only weakly fluctuating fluorescence (mainly due to slow particle diffusion within the gel) at the single particle level (Fig. 7E). Moreover, the averaged ensemble fluorescence of NPs showed a much slower decrease as a function of time (Fig. 7F), i.e. much higher photostability compared to F5-TPB NPs. This striking result shows that the level of fluorination and/or the larger size of the counterion can modulate the blinking and photostability of the whole particle.
000 × 0.6 = 2.4 × 10⁷ M−1 cm−1. When excited at 532 nm, this value is slightly lower: 320 × 57000 × 0.6 = 1.1 × 10⁷ M−1 cm−1. On the other hand, FCS suggests that the brightness of R12/F12-TPB NPs corresponds to that of 540 rhodamine B molecules in solution. This should be valid for both two-photon and single photon excitation as our NPs are composed of the same rhodamine B fluorophore. Therefore, the estimated brightness of our NPs excited at 532 nm is N × ε(532) × QY = 540 × 57000 M−1 cm−1 × 0.31 = 9.5 × 10⁶ M−1 cm−1, which is very close to that estimated from the number of dye particles. In contrast, the brightness of QD-585 at 532 nm (one-photon) excitation is ε × QY = 310000 M−1 cm−1 × 0.67 = 2.1 × 10⁵ M−1 cm−1 and thus, >45-fold less bright than our counterion-assembled NPs. Thus, the experimental difference in brightness obtained by microscopy confirms the theoretical estimations. The other remarkable feature was that ∼50% of NPs built from F5-TPB showed rapid blinking that ended up with a dark state of the particles (Fig. 7E). Previously, we showed a similar phenomenon for PLGA NPs loaded with a similar dye (R18) with the same F5-TPB counterion and assigned it to fast excitation energy migration through the dyes.9 However, some heterogeneity in the particle behavior was observed, so that the averaged curve obtained from multiple particles of the image showed a smoother drop in the fluorescence, with nevertheless a loss of ∼50% of initial intensity within 2 seconds (Fig. 7F). By contrast, F12-TPB did not show blinking behavior, with only a few exceptions, as we could see from the relatively stable and only weakly fluctuating fluorescence (mainly due to slow particle diffusion within the gel) at the single particle level (Fig. 7E). Moreover, the averaged ensemble fluorescence of NPs showed a much slower decrease as a function of time (Fig. 7F), i.e. much higher photostability compared to F5-TPB NPs. This striking result shows that the level of fluorination and/or the larger size of the counterion can modulate the blinking and photostability of the whole particle.
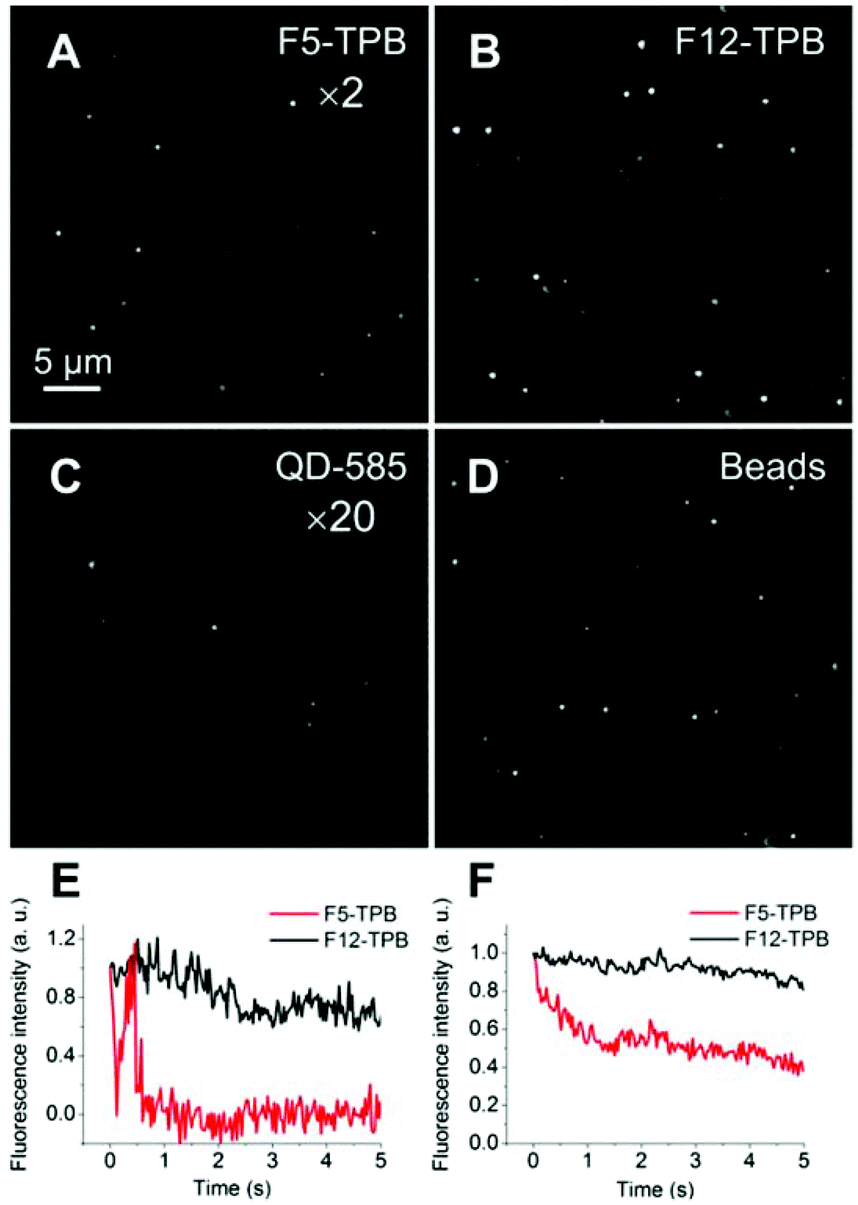 | ||
| Fig. 7 Wide-field fluorescence microscopy images of counterion-assembled NPs, polystyrene beads and QDs in polyvinyl alcohol gel. Images of NPs assembled from R12 with F5-TPB (A) and F12-TPB (B), compared to QD-585 (C) and polystyrene beads, FluoroSpheres® 535/575 (D). For better visibility, the signal in panels (A) and (C) was amplified 2 and 20-fold, respectively. (E) Representative single-particle emission transients showing turn-off of the F5-TPB NPs and only weak fluctuations for F12-TPB. (F) Dependence of the average fluorescence intensity of NPs with time. The emission of NPs was observed under continuous illumination at 532 nm, with a power of 1 W cm−2. | ||
Application for light harvesting
As our counterion-assembled NPs contain a large number of fluorescent dyes, which are strongly coupled by energy transfer, we hypothesized that they could be very efficient energy donors, similar to light-harvesting complexes.59–62 To check this idea, we encapsulated an energy acceptor Cy-derivative (C2-Cy5) inside our most interesting salts of R12 with F5-TPB and F12-TPB. As the cyanine dye is also cationic, we expected that it can efficiently co-precipitate forming blended NPs with R12 (Fig. 8). Increasing the C2-Cy5 concentration produced a sequential increase in the acceptor emission, accompanied by a decrease in the donor fluorescence (Fig. 8 and S6†). For F12-TPB, >50% FRET efficiency was already observed at a donor/acceptor ratio of 1000/1, which is outstanding (Fig. 8B). In the case of F5-TPB, somewhat higher acceptor concentrations were needed to reach >50% FRET. In both cases at a 200/1 donor/acceptor ratio, where statistically each NP should contain at least one C2-Cy5 acceptor, the FRET efficiency was 60 and 80% for F5-TPB and F12-TPB, respectively. To quantify the antenna effect, we recorded the excitation spectra of the donor and acceptor by detecting the emission of the acceptor (Fig. S6 and S7†). The antenna effect (AE) was then expressed as the ratio of the maximal excitation intensity of the donor to that of the acceptor.63 For F12-TPB the value of the antenna effect reached 200 at the donor/acceptor ratio of 1000/1, though for F5-TPB the effect was 2-fold smaller. The theoretical value of the antenna effect could be calculated as AE = (nDεDE)/(nAεA), where nD and nD are the numbers of donors and acceptors, respectively, per particle, εD and εA are the extinction coefficients of donors and acceptors, respectively, and E is the FRET efficiency. For F12-TPB NPs at a donor acceptor ratio of 1000/1, we assume that the NPs containing ∼320 R12 donors (from FCS) would contain only one C2-Cy5 acceptor. Then the formula above gives AE ≈ 91, which is somewhat lower than that experimentally observed. It is possible that the real number of R12 dyes per F12-TPB particle is higher as for instance suggested from geometrical estimation (∼650), which could explain the observed high AE values. In any case, our results indicate that nearly all the energy of the donors of one NP was efficiently transferred to a single C2-Cy5-acceptor. Importantly, the QY values of C2-Cy5 inside the dye NPs for donor/acceptor ratios of 1/1000–1/200 was around 30 and 50% for F5-TPB and F12-TPB counterions, respectively, and thus, similar or even higher than that in methanol (Fig. S9†). These data show that these NPs can readily encapsulate other cationic dyes at small quantities, ensuring their efficient fluorescence, especially for the most fluorinated F12-TPB counterion.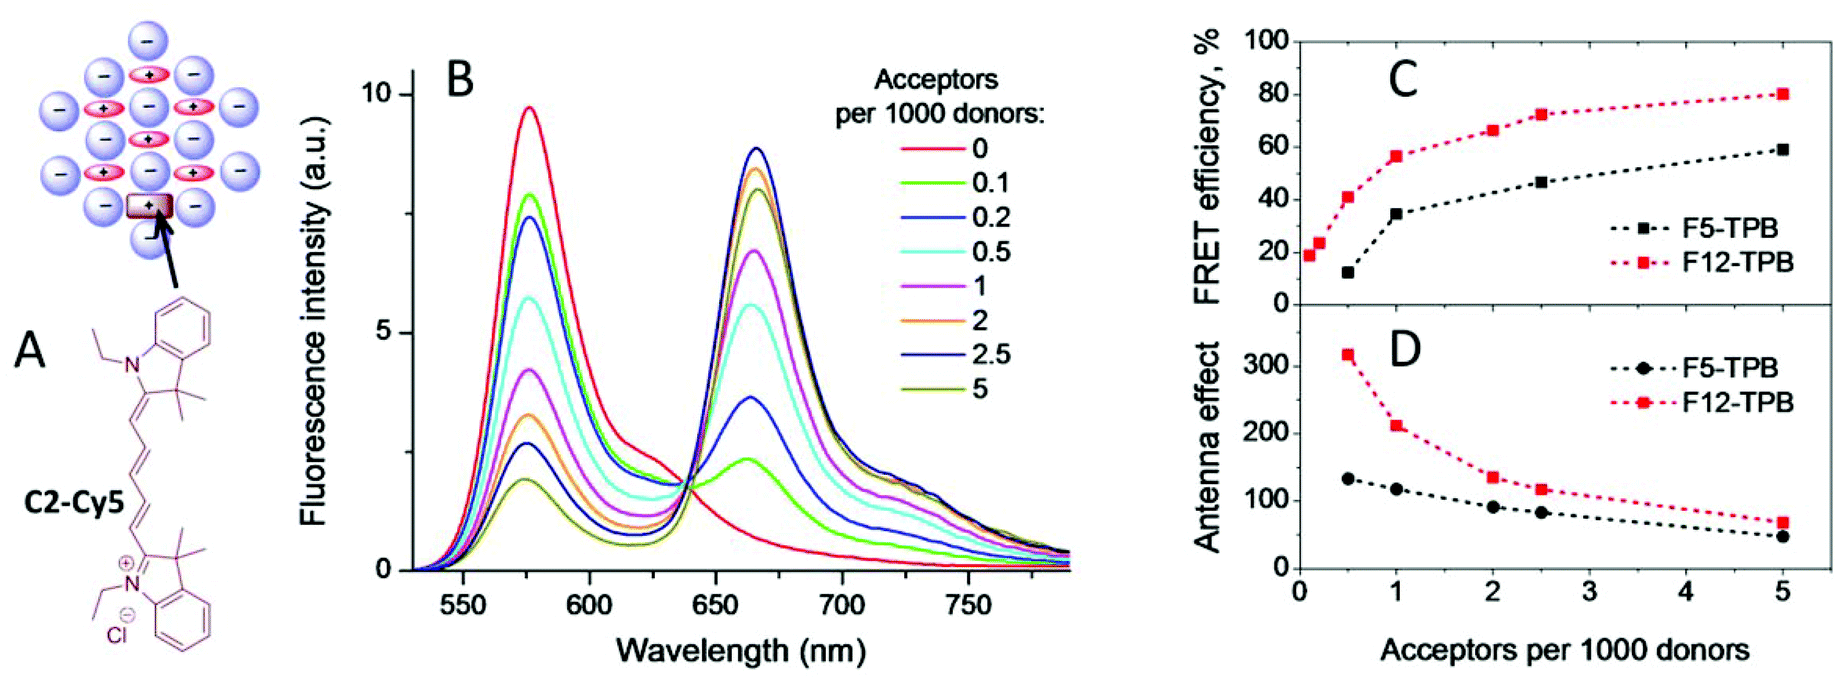 | ||
| Fig. 8 FRET from R12-based counterion-assembled NPs to C2-Cy5 acceptor. (A) Chemical structure of the C2-Cy5 acceptor and its encapsulation into counterion-assembled NPs. (B) Fluorescence spectra of R12 NPs with F12-TPB counterion containing different amounts of C2-Cy5 acceptor dye. Excitation wavelength was 520 nm. (C) FRET efficiency calculated from the donor fluorescence for NPs with F5-TPB and F12-TPB counterions at different acceptor concentrations. (D) Antenna effect calculated from the excitation spectra (ratio of donor intensity maximum to the acceptor intensity maximum emission was detected at 680 nm) for NPs with two different counterions. | ||
Application for cellular imaging
Finally, we explored whether the obtained NPs can be applied to cellular imaging. In particular, we were interested in the ability of the particles to enter cells and to retain their integrity. To this end, we incubated representative NPs (R12 salt with F5-TPB and F12-TPB counterions) with HeLa cells and imaged the cells using confocal fluorescence microscopy. Both types of NPs could enter the cells, but their behavior was surprisingly different. We found that after 1 h of incubation, NPs based on F5-TPB showed intracellular fluorescence in the form of dots and diffuse fluorescence (Fig. 9A and F). After 6 h of incubation, only a diffuse yet structured fluorescence pattern was observed (Fig. 9B and G). To verify whether this pattern originates from the released R12 dyes, we incubated HeLa cells for 1 h with a water soluble R12 iodide. In this case, a very similar fluorescence pattern was observed, which corresponds probably to intracellular organelles (Fig. 9C and H). Furthermore, co-staining with Mito-Tracker Green® showed a perfect colocalization with R12 iodide (Fig. S10†), indicating that the cationic dye accumulated in the mitochondria.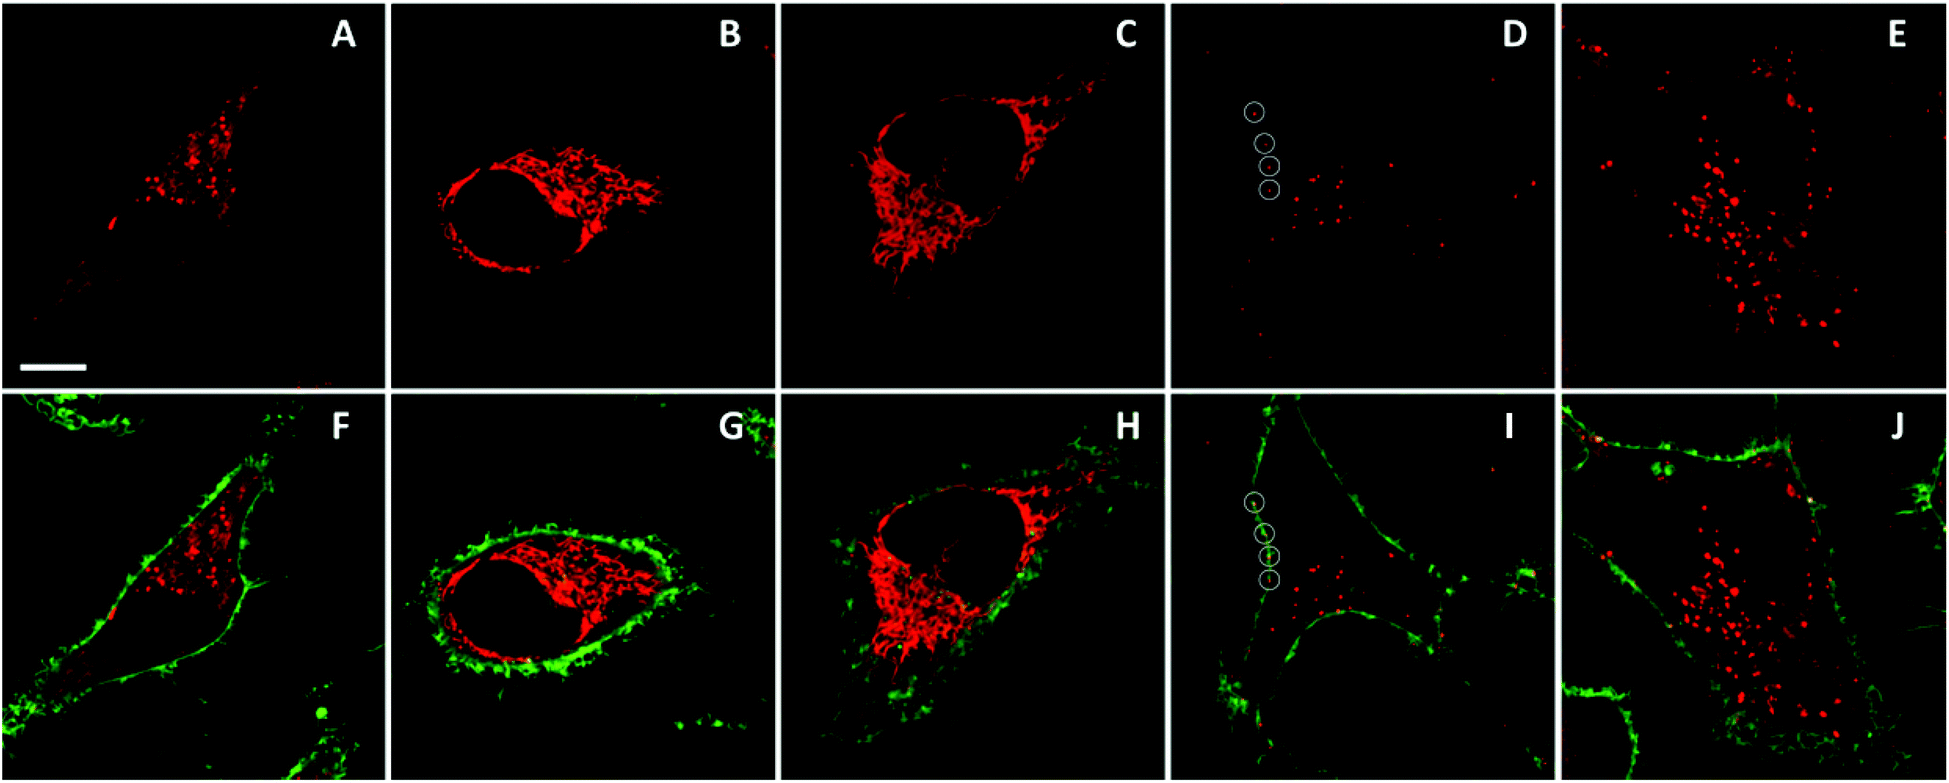 | ||
| Fig. 9 Fluorescence imaging of counterion-assembled NPs in HeLa cells. NPs prepared from R12 salts with F5-TPB (A, B, F, G) or F12-TPB (D, E, I, J) were incubated for 1 h (A, F, D, I) and 6 h (B, G, E, J) at 37 °C. Control R12 iodide dye was incubated with cells for 1h (C, H). Circles in panels (D) and (I) highlight NPs localized at the plasma membrane. Upper panels (in red) present images of NPs using an excitation at 561 nm and a detection range of 567–700 nm, while lower panels present images of both NPs (red) and the plasma membrane marker WGA-AlexaFluor®488 (green). The latter was observed using an excitation at 488 nm and a detection range of 503–550 nm. To enable the comparison of the intensities in the red channel, the imaging conditions were the same in all cases except for panel (B), where the scale was extended 3-fold (due to much higher signal). When added to the cells, the NPs were diluted to a final R12 concentration of 50 nM. Scale bar is 10 μm. | ||
Thus, our data showed that NPs based on F5-TPB could enter the cells on a time scale of hours and then disassemble, releasing the R12 dyes. In sharp contrast, after 1 h of incubation, NPs based on F12-TPB showed exclusively dotted fluorescence patterns (Fig. 9D and J) both inside the cells and at the level of the plasma membranes. After 6 h of incubation, the intracellular fluorescence markedly increased, mainly in the form of dots, indicating an accumulation of NPs inside the cells (Fig. 9E and J). However, some diffuse intracellular fluorescence also appeared, suggesting a partial release of R12 dyes from NPs. Nevertheless, it is clear that NPs built from F12-TPB counterions are far more stable in cells than those built from F5-TPB. The higher stability seems to correlate with the higher fluorination of the F12-TPB counterion, which should make NPs more “inert” with respect to biological media.
Discussion
Previous studies by the groups of Warner and Yao suggested the ion-association method for the preparation of NPs from cationic dyes and hydrophobic counterions.30,31 Here, for the first time, effects of the fluorination of the bulky hydrophobic counterion and the hydrophobicity of the cationic dye were studied in order to find the brightest possible nanomaterials. Though we observed that longer alkyl chains (i.e. higher hydrophobicity) decreased the dye H-aggregation and improved fluorescence quantum yields, this effect was relatively weak. On the other hand, a clear-cut improvement of the NPs’ fluorescence properties was observed on increase in the counterion fluorination. While the non-fluorinated bulky counterion (TPB) produced strongly quenched NPs, the most fluorinated counterion (F12-TPB) improved the QY values ∼100-fold up to 60%. QY values grew sequentially with the fluorination level and this was accompanied by a gradual decrease in the H-aggregation of the dyes. Remarkably, fluorination also influenced the width of the emission band, so that for the most fluorinated counterion the emission band was even sharper than for rhodamine B in solution. We also showed that the NPs assembled from the most fluorinated F12-TPB present the highest brightness and photostability at the single particle level. Fluorinated counterions such as F1-TPB,31,32,36 bis(trifluoromethanesulfonyl)imide and bis(pentafluoroethanesulfonyl)imide33 were used previously to prepare fluorescent NPs, however, the role of fluorine in these ions to control NPs’ fluorescence was not clarified. Few reports showed the role of fluorinated environment for improving the fluorescence properties of dyes. One report showed that perfluorinated solvents could decrease the dye photobleaching and vibrational quenching.49 Another one showed the improvement of dye brightness in fluorinated emulsions,50 and dye-assembled nanomaterials.51 Here, we found that a gradual increase in the fluorination of the counterion improves a bunch of fluorescence characteristics of the ionic dye: it minimizes H-aggregation, increases fluorescence quantum yield, sharpens the emission bands, and improves single particle brightness and photostability.An important finding of the present work is the excellent single particle performance of counterion-assembled NPs. So far, only bulk solution properties of this type of NPs have been reported,31,33–35 and these cannot be directly extrapolated to the particle performance under the microscope. In this respect, we have clearly shown that our counterion-assembled NPs based on fluorinated counterions are much brighter than QDs under single photon excitation. Thus, we showed here that the organic particles of 19 nm hydrodynamic radius (R12/F12-TPB) are ∼40-fold brighter than inorganic semiconductor particles of similar size (∼20 nm). However, if the fluorescent cores are compared, the brightness per volume is comparable, as the size of the QD core (3–8 nm) is much smaller than its hydrodynamic size that includes all the necessary shells.64,65 Indeed, the size of the QD 585 core is ∼5 nm, so that its volume is 14- and 39-fold smaller than that of F5-TPB (12 nm) and F12-TPB (17 nm) NPs, respectively, in line with the difference in brightness with our organic NPs. In this respect, the key advantage of the counterion-assembled NPs is their capacity to be solubilized in water with a minimal size of the shell. In the present case, the shell of our NPs is just a monolayer of counterions (thickness ∼1 nm), while QDs require, in addition to the thin ZnO shell, a 5–10 nm thick organic shell to retain the colloidal stability and highly emissive properties of their core in water.3,66
On the other hand, single particle measurements revealed some key differences between F5-TPB and F12-TPB, which were not detectable from bulk experiments. We found that NPs built from F5-TPB showed on/off switching (blinking). This phenomenon was previously described for PLGA NPs encapsulating R18 with the same counterion, and this phenomenon was assigned to the exceptional communication of the dyes due to fast exciton diffusion.9 A similar blinking phenomenon was also reported for dendrites,67 conjugated polymers68 and J-aggregates,69 which also present remarkable exciton diffusion behavior. Therefore we speculate that in the present case, light induces the formation of dark species of rhodamine B that can quench the whole ensemble of ∼300 dyes. The fast energy migration for NPs based on F5-TPB was confirmed by the exceptionally low values of anisotropy, similar to those previously reported for PLGA NPs.9 Remarkably, NPs based on the most fluorinated counterion F12-TPB showed almost no blinking behavior. Two reasons could be behind this dramatic difference between F5-TPB and F12-TPB. As we observe some increase in the anisotropy for F12-TPB, one could expect that the inter-fluorophore communication is slower with this counterion, which may thus make the blinking inefficient. However, this scenario is unlikely because F12-TPB NPs are even more efficient energy donors than F5-TPB NPs in our FRET experiments. Therefore, a more probable reason is that the higher fluorination and larger size of F12-TPB change the mode of R12 dye assembly favoring larger distances between the dyes within 1–2 nm range, which may prevent formation of the dark species.
Here, we found that our counterion-assembled NPs are exceptional FRET donors to single acceptors, with an antenna effect reaching 200, which is a rare observation. In other multi-chromophore systems, such as dye-doped silica NPs70,71 and DNA nanostructures,63,72 the efficient FRET was reported for significantly smaller number of donor dyes. The efficient FRET in counterion-assembled NPs was reported independently by the groups of Warner73 and Yao,74 though the phenomenon was not explained. As the particle size in the case of F12-TPB (19 nm according to FCS) is larger than the double Förster radius of the rhodamine B–C2-Cy5 pair (2 × R0 ∼10 nm), the observed exceptional FRET efficiency and the antenna effect can be explained by ultrafast energy migration between the energy donors, until it is transferred to the acceptor. This is supported by our anisotropy data, as well as by the observation of on/off switching for F5-TPB NPs. Energy migration is considered as an important mechanism that ensures a high energy transfer efficiency from multiple donors to a single acceptor in light-harvesting systems59–62 as well as in conjugated polymers19 and some dye-doped nanostructures.71 The present work suggests that this energy migration process can be behind the observed remarkably high FRET efficiency and antenna effect in counterion-assembled NPs.
The final aspect is the compatibility of the present NPs with the cellular environment. As these NPs are formed by self-assembly through non-covalent interactions, they may disassemble in the cells because of high dilution (20-fold with respect to the original formulation) and the interactions with the cellular components. F5-TPB NPs are indeed not sufficiently stable after entering the cells, as can be seen from the diffuse fluorescence inside the cells similar to that obtained with the free dye. Comparison with the free dye R12 iodide suggested that these particles, after entering the cells, likely disassemble, so that the released rhodamine dyes can accumulate in the mitochondria. This tropism of R12 for mitochondria is consistent with earlier reports showing that hydrophobic derivatives of rhodamines readily localize in the mitochondria, driven by the electric potential.75,76 Moreover, a recent report showed similar mitochondrial staining without dotted fluorescence for cells incubated with counterion-assembled NPs of rhodamine 6G,77 which confirms that these NPs have a tendency to disassemble inside the cells. Therefore, it is clear that R12/F5-TPB salt in pure form cannot be used for cellular imaging but requires protection, for instance using a polymer, as we showed recently.9 In contrast, NPs based on the most fluorinated counterion F12-TPB showed much higher stability than F5-TPB NPs, allowing observation of NPs inside cells on the time scale of hours. This shows that a high level of fluorination can prevent NPs form disassembly at high dilution in a complex biological environment. To the best of our knowledge, for the first time counterion-assembled NPs stable in a cellular context were prepared and the role of fluorination in the particle stability is described. This unique stabilization effect could be explained by the fact that perfluorinated compounds present orthogonal properties to both aqueous and hydrophobic environments.37–39 Thus, fluorination probably decreases the affinity of the counterion to the hydrophobic sites in the cells and inhibits the interaction of the rhodamine dye with cellular compartments.
Experimental section
Sodium tetraphenylborate (≥99.5%), sodium tetrakis(4-fluorophenyl)borate dihydrate (≥97.0%), lithium tetrakis(pentafluorophenyl)borate ethyl etherate, sodium tetrakis[3,5-bis(trifluoromethyl)phenyl]borate, acetonitrile, tetrakis[3,5-bis(1,1,1,3,3,3-hexafluoro-2-methoxy-2-propyl)phenyl]borate (≥99.5%) were purchased from Sigma-Aldrich and used as received. Milli-Q water (Millipore) was used in all experiments. All starting materials for synthesis were purchased from Alfa Aesar and Sigma Aldrich or TCI Europe and used as received unless stated otherwise. NMR spectra were recorded on a Bruker Avance III 400 MHz spectrometer. Mass spectra were obtained using an Agilent Q-TOF 6520 mass spectrometer. Synthesis of alkyl-rhodamine B dyes is described in the ESI.†Preparation of fluorescent NPs
The rhodamine B derivative was dissolved at 1 mM in DMSO. The concentration was measured by photometry using the extinction coefficient for all rhodamine B derivatives 125000 M−1 cm−1 in methanol.78 To prepare 1 μM of nanoparticle solution, 2 μL of 1 mM rhodamine B derivative stock solution was added quickly under stirring (shaking) using a micropipette to 2 mL of Milli-Q® water (Millipore). Then to the obtained solution a 10-fold excess of the corresponding borate solution (20 μL of 1 mM stock solution) was added quickly under stirring using a micropipette.
For the DLS measurements of nanoparticle suspension 5 μM dye concentration was used to obtain sufficient signal. To this end, 10 μL of 1 mM rhodamine B derivative stock solution was added quickly under stirring using a micropipette to a 1.9 mL of Milli-Q® water (Millipore). Then to the obtained solution 10-fold excess of the corresponding borate solution (100 μL of 1 mM stock solution) was added quickly under stirring using a micropipette. Zeta potential measurements were performed using 20 μM dye concentration.
For the DLS and AFM measurements, to remove possible aggregates the obtained solution of prepared nanoparticles was additionally filtered through a 0.1 μm PVDF NS “Ultrafree®-CL” centrifugal filter unit (Merck Millipore).
Optical spectroscopy
Absorption and emission spectra were recorded on a Cary 400 Scan UV-visible spectrophotometer (Varian) and a FluoroMax-4 spectrofluorometer (Horiba Jobin Yvon) equipped with a thermostated cell compartment, respectively. For standard recordings of fluorescence spectra, the excitation wavelength was set to 520 nm. The fluorescence spectra were corrected for detector response and lamp fluctuations. Fluorescence quantum yields were calculated using rhodamine B in water (QY = 31%)53 with an absorbance of 0.1 at 520 nm as a reference. Hydrodynamic diameter and zeta-potential measurements were performed on a Zetasizer Nano series DTS 1060 (Malvern Instruments S.A.) with a laser source at 633 nm.Other software
The calculations were performed using Hyperchem 8.0. The starting geometry of borate ions was subsequently optimized using a Polak–Ribière algorithm (conjugate gradient) under vacuum with a RMS gradient of 0.1 kcal (A mol)−1. The resulting structures of counter-ions were relatively similar to each other and showed common features such as a symmetric arrangement.AFM measurements
AFM measurements were performed using a Solver-Pro-M (NT-MDT) instrument. The measurements were performed in the liquid phase. Cantilevers were NSG03 (NT-MDT) with a tip curvature radius of 10 nm. The NPs were prepared as described before. To deposit NPs on the mica surface, 100 μL of 10–100 mM calcium chloride solution (depending on the counterion) was first incubated for 30 min. Then, the solution was removed with a filter paper and 100 μL of an undiluted suspension of NPs was deposited on the mica surface. After 30 min, the solution was removed using a filter paper and then replaced with 100 μL of 10–100 mM solution of calcium chloride. The obtained sample was imaged in the liquid phase, using the tapping mode (∼37 kHz).Fluorescence correlation spectroscopy (FCS) and data analysis
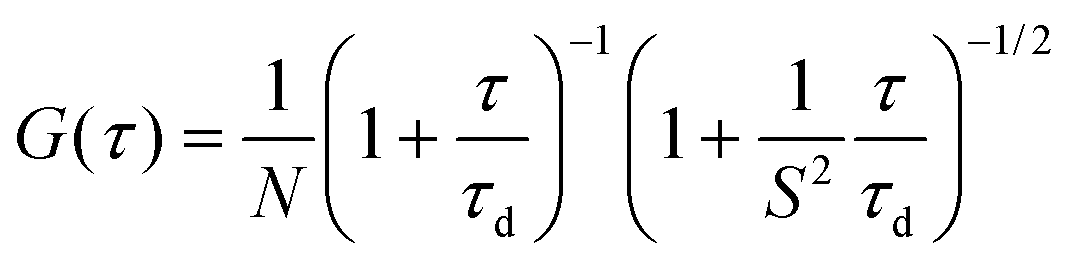
FCS measurements were performed on a two-photon platform including an Olympus IX70 inverted microscope, as described previously.58 Two-photon excitation at 830 nm (1–5 mW laser output power) was provided using an InSight DeepSee laser (Spectra Physics). The measurements were carried out in an eight-well Lab-Tek II coverglass system, using a 300 μL volume per well. The focal spot was set about 20 μm above the coverslip. The normalized autocorrelation function, G(τ) was calculated online by using an ALV-5000E correlator (ALV, Germany) from the fluorescence fluctuations, δF(t), by G(τ) = <δF(t)δF(t + τ)>/<F(t)>2 where <F(t)> is the mean fluorescence signal, and τ is the lag time. Assuming that lipid nano-droplets diffuse freely in a Gaussian excitation volume, the correlation function, G(τ), calculated from the fluorescence fluctuations was fitted according to Thompson:79where τd is the diffusion time, N is the mean number of fluorescent species within the two-photon excitation volume, and S is the ratio between the axial and lateral radii of the excitation volume. The excitation volume is about 0.34 fL and S is about 3 to 4. Typical data recording time was 5 min, using freshly prepared PLGA NPs without further dilution. The measurements were done with respect to a reference 5(6)-carboxytetramethylrhodamine (TMR, from Sigma-Aldrich) in water. The hydrodynamic diameter, d, of NPs was calculated as: dNPs = τd(NPs)/τd(TMR) × dTMR, where dTMR is a hydrodynamic diameter of TMR (1.0 nm). The concentration of NPs was calculated from the number of species by: CNPs = NNPs/NTMR × CTMR, using a TMR concentration of 50 nM.
Single-particle imaging
Counterion-assembled NPs were immobilized in polyvinyl alcohol (Aldrich) gel. 3 g of poly(vinyl alcohol) (Mw 89000–98000, 99+%) in 10 mL of degassed Milli-Q® water (Millipore) was stirred at 90–100 °C for two hours to obtain a homogeneous 30 wt% PVA gel. Then 300 μL of the PVA gel were added into a cell of the Lab-Tek® plate and immediately after 50 μL of 1 μM particle solution were injected into the PVA gel and mixed using the tip of the micropipette. Then the Lab-Tek® plate was kept for 5 h in a desiccator under vacuum. Quantum dots (QDot-585 streptavidin conjugate, Life Technologies) and FluoroSpheres® 535/575 (diameter 0.028 μm, carboxylate modified, Invitrogen) at ∼6 pM concentration were immobilized and imaged in the same way. Single particle measurements were performed in the TIRF (Total Internal Reflection Fluorescence) mode on a home-made wide-field setup based on an Olympus IX-71 microscope with an oil immersion objective (NA = 1.49, 100×). A DPPS (Cobolt) continuous wave (CW) laser emitting at 532 nm was used for excitation. The laser intensity was set to 1 W cm−2 using a polarizer and a half-wave plate (532 nm). The fluorescence signal was recorded with an EMCCD (ImagEM Hamamatsu). The presented images were an average of the first 30 frames recorded with an acquisition time of 30.67 ms per frame.
Cellular studies
HeLa cells (ATCC® CCL-2) were grown in Dulbecco's modified Eagle's medium (DMEM, Gibco-Invitrogen), supplemented with 10% fetal bovine serum (FBS, Lonza) and 1% antibiotic solution (penicillin–streptomycin, Gibco-Invitrogen) at 37 °C under a humidified atmosphere containing 5% CO2. Cells were seeded onto a chambered coverglass (IBiDi) at a density of 5 × 10⁴ cells per well 24 h before the microscopy measurement. For imaging, the culture medium was removed and the attached cells were washed with Opti-MEM (Gibco-Invitrogen). Then, a freshly prepared solution of NPs (at 20-fold dilution of the original formulation, corresponding to ∼50 nM dye) in Opti-MEM was added to the cells and incubated for different time periods. Cell membrane staining with wheat germ agglutinin-Alexa488 was done for 10 min at rt before the measurements. Fluorescence images were taken on a Leica TSC SPE confocal microscope. The microscope settings were: a 561 nm laser source with a 567–700 nm detection range for imaging counterion-assembled rhodamine NPs and 488 nm excitation with a 503–550 nm emission range for imaging the plasma membrane marker WGA-AlexaFluor®488 (green) or Mito-Tracker® green (Life Technologies).Conclusion
In the present work, we prepared nanoparticles through aggregation of alkylated lipophilic rhodamine B derivatives with fluorinated tetraphenylborate counterions. It was found that fluorination degree of the counterion produced a profound effect on the fluorescence properties of NPs. Thus, for the most fluorinated counterion, we obtained rhodamine NPs with a quantum yield reaching 40–60% and their emission band-width was ∼20% narrower than rhodamine B in organic solvents. Absorption spectra suggested that the fluorinated counterions prevent H-aggregation of rhodamines in the solid state, thus favoring enhanced emission. According to fluorescence correlation spectroscopy these NPs emit like 300–500 rhodamines together, so that their brightness should be around 2.4 × 10⁷ M−1 cm−1 (extinction coefficient × quantum yield). This high brightness was confirmed by single molecule microscopy, where NPs with the most fluorinated counterion (48 fluorines) presented ∼40-fold higher brightness than quantum dots (QD585 at 532 nm excitation). Remarkably, we also found that counterion with the highest fluorination favored higher photostability and suppressed blinking of the NPs. We hypothesize that the size of the counterion and its fluorination level should finely tune the spacing between dyes within 1–2 nm range that produce these drastic variations in the fluorescence properties. This short distance ensured fast exciton diffusion, revealed by fluorescence anisotropy, and efficient FRET to single cyanine-5 acceptors with a light-harvesting antenna effect reaching 200. Finally, our cellular studies showed that NPs with the most fluorinated counterion are rather stable after entry into living cells, while NPs built from the less fluorinated counterion disassembled after 1 h and their released dye accumulated in the mitochondria. Thus, the counterion fluorination is crucial for correct ordering of dyes in the solid state without aggregation-caused quenching. It enables the preparation of NPs with high fluorescence brightness and photostability, narrow-band emission, fast energy transfer and high intracellular stability. We believe that these findings will facilitate the route to next generation of nanomaterials for light harvesting and bioimaging applications.Acknowledgements
I.S. acknowledges support from French Embassy. This work was supported by Université de Strasbourg (IdEX 2015, W15RAT68) and ERC Consolidator grant BrightSens 648528. We thank Pascal Didier and Frederic Przybilla for help with wide-field microscopy setup.References
- H.-S. Peng and D. T. Chiu, Chem. Soc. Rev., 2015, 44, 4699–4722 RSC.
- M. Chen and M. Yin, Prog. Polym. Sci., 2014, 39, 365–395 CrossRef CAS PubMed.
- D. R. Larson, W. R. Zipfel, R. M. Williams, S. W. Clark, M. P. Bruchez, F. W. Wise and W. W. Webb, Science, 2003, 300, 1434–1436 CrossRef CAS PubMed.
- W. W. Yu, L. H. Qu, W. Z. Guo and X. G. Peng, Chem. Mater., 2003, 15, 2854–2860 CrossRef CAS.
- L. D. Lavis and R. T. Raines, ACS Chem. Biol., 2008, 3, 142–155 CrossRef CAS PubMed.
- C. Wu and D. T. Chiu, Angew. Chem., Int. Ed., 2013, 52, 3086–3109 CrossRef CAS PubMed.
- C. Wu, B. Bull, C. Szymanski, K. Christensen and J. McNeill, ACS Nano, 2008, 2, 2415–2423 CrossRef CAS PubMed.
- A. Wagh, S. Y. Qian and B. Law, Bioconjugate Chem., 2012, 23, 981–992 CrossRef CAS PubMed.
- A. Reisch, P. Didier, L. Richert, S. Oncul, Y. Arntz, Y. Mely and A. S. Klymchenko, Nat. Commun., 2014, 5, 4089 CAS.
- K. Li and B. Liu, Chem. Soc. Rev., 2014, 43, 6570–6597 RSC.
- J. Schill, A. P. H. J. Schenning and L. Brunsveld, Macromol. Rapid Commun., 2015, 36, 1306–1321 CrossRef CAS PubMed.
- X.-d. Wang, R. J. Meier and O. S. Wolfbeis, Adv. Funct. Mater., 2012, 22, 4202–4207 CrossRef CAS PubMed.
- K. Trofymchuk, A. Reisch, I. Shulov, Y. Mely and A. S. Klymchenko, Nanoscale, 2014, 6, 12934–12942 RSC.
- G. Sun, M. Y. Berezin, J. Fan, H. Lee, J. Ma, K. Zhang, K. L. Wooley and S. Achilefu, Nanoscale, 2010, 2, 548–558 RSC.
- H. Yao, Springer Ser. Fluoresc., 2010, 9, 285–304 CAS.
- K. Li, Z. S. Zhu, P. Q. Cai, R. R. Liu, N. Tomczak, D. Ding, J. Liu, W. Qin, Z. J. Zhao, Y. Hu, X. D. Chen, B. Z. Tang and B. Liu, Chem. Mater., 2013, 25, 4181–4187 CrossRef CAS.
- S. Fery-Forgues, Nanoscale, 2013, 5, 8428–8442 RSC.
- J. Pecher and S. Mecking, Chem. Rev., 2010, 110, 6260–6279 CrossRef CAS PubMed.
- S. W. Thomas Iii, G. D. Joly and T. M. Swager, Chem. Rev., 2007, 107, 1339–1386 CrossRef PubMed.
- M. Kasha, H. R. Rawls and M. A. El-Bayoumi, Pure Appl. Chem., 1965, 11, 371–392 CrossRef CAS.
- F. Würthner, T. E. Kaiser and C. R. Saha-Moller, Angew. Chem., Int. Ed., 2011, 50, 3376–3410 CrossRef PubMed.
- G. Battistelli, A. Cantelli, G. Guidetti, J. Manzi and M. Montalti, Wiley Interdiscip. Rev.: Nanomed. Nanobiotechnol., 2015 DOI:10.1002/wnan.1351.
- Y. Hong, J. W. Y. Lam and B. Z. Tang, Chem. Soc. Rev., 2011, 40, 5361–5388 RSC.
- Y. Hong, J. W. Y. Lam and B. Z. Tang, Chem. Commun., 2009, 4332–4353 RSC.
- W. Qin, K. Li, G. Feng, M. Li, Z. Yang, B. Liu and B. Z. Tang, Adv. Funct. Mater., 2014, 24, 635–643 CrossRef CAS PubMed.
- T. T. Vu, S. Badre, C. Dumas-Verdes, J. J. Vachon, C. Julien, P. Audebert, E. Y. Senotrusova, E. Y. Schmidt, B. A. Trofimov, R. B. Pansu, G. Clavier and R. Meallet-Renault, J. Phys. Chem. C, 2009, 113, 11844–11855 CAS.
- K. Petkau, A. Kaeser, I. Fischer, L. Brunsveld and A. P. H. J. Schenning, J. Am. Chem. Soc., 2011, 133, 17063–17071 CrossRef CAS PubMed.
- E. Genin, Z. Gao, J. A. Varela, J. Daniel, T. Bsaibess, I. Gosse, L. Groc, L. Cognet and M. Blanchard-Desce, Adv. Mater., 2014, 26, 2258–2261 CrossRef CAS PubMed.
- I. Krossing and I. Raabe, Angew. Chem., Int. Ed., 2004, 43, 2066–2090 CrossRef CAS PubMed.
- D. K. Bwambok, B. El-Zahab, S. K. Challa, M. Li, L. Chandler, G. A. Baker and I. M. Warner, ACS Nano, 2009, 3, 3854–3860 CrossRef CAS PubMed.
- H. Yao and K. Ashiba, RSC Adv., 2011, 1, 834–838 RSC.
- T. Enseki and H. Yao, Chem. Lett., 2012, 41, 1119–1121 CrossRef CAS.
- A. N. Jordan, S. Das, N. Siraj, S. L. de Rooy, M. Li, B. El-Zahab, L. Chandler, G. A. Baker and I. M. Warner, Nanoscale, 2012, 4, 5031–5038 RSC.
- S. L. de Rooy, S. Das, M. Li, B. El-Zahab, A. Jordan, R. Lodes, A. Weber, L. Chandler, G. A. Baker and I. M. Warner, J. Phys. Chem. C, 2012, 116, 8251–8260 CAS.
- Z.-m. Ou, H. Yao and K. Kimura, Bull. Chem. Soc. Jpn., 2007, 80, 295–302 CrossRef CAS.
- H. Yao, M. Yamashita and K. Kimura, Langmuir, 2009, 25, 1131–1137 CrossRef CAS PubMed.
- J. A. Gladysz, D. P. Curran and I. T. Horváth, Handbook of Fluorous Chemistry, Wiley-VHC, Weinheim, 2004 Search PubMed.
- I. T. Horváth, Acc. Chem. Res., 1998, 31, 641–650 CrossRef.
- M. Cametti, B. Crousse, P. Metrangolo, R. Milani and G. Resnati, Chem. Soc. Rev., 2012, 41, 31–42 RSC.
- M. L. Tang and Z. Bao, Chem. Mater., 2011, 23, 446–455 CrossRef CAS.
- J. M. Vincent, Chem. Commun., 2012, 48, 11382–11391 RSC.
- R. Schmidt, M. M. Ling, J. H. Oh, M. Winkler, M. Könemann, Z. Bao and F. Würthner, Adv. Mater., 2007, 19, 3692–3695 CrossRef CAS PubMed.
- J. W. Ward, R. Li, A. Obaid, M. M. Payne, D.-M. Smilgies, J. E. Anthony, A. Amassian and O. D. Jurchescu, Adv. Funct. Mater., 2014, 24, 5052–5058 CrossRef CAS PubMed.
- C. I. Castro and J. C. Briceno, Artif. Organs, 2010, 34, 622–634 Search PubMed.
- J. M. Janjic and E. T. Ahrens, Wiley Interdiscip. Rev.: Nanomed. Nanobiotechnol., 2009, 1, 492–501 CrossRef CAS PubMed.
- E. T. Ahrens, R. Flores, H. Xu and P. A. Morel, Nat. Biotechnol., 2005, 23, 983–987 CrossRef CAS PubMed.
- H. Bronstein, J. M. Frost, A. Hadipour, Y. Kim, C. B. Nielsen, R. S. Ashraf, B. P. Rand, S. Watkins and I. McCulloch, Chem. Mater., 2013, 25, 277–285 CrossRef CAS.
- J. W. Jo, S. Bae, F. Liu, T. P. Russell and W. H. Jo, Adv. Funct. Mater., 2015, 25, 120–125 CrossRef CAS PubMed.
- H. Sun, A. Putta, J. P. Kloster and U. K. Tottempudi, Chem. Commun., 2012, 48, 12085–12087 RSC.
- E. M. Sletten and T. M. Swager, J. Am. Chem. Soc., 2014, 136, 13574–13577 CrossRef CAS PubMed.
- S. Shin, S. H. Gihm, C. R. Park, S. Kim and S. Y. Park, Chem. Mater., 2013, 25, 3288–3295 CrossRef CAS.
- M. S. T. Goncalves, Chem. Rev., 2009, 109, 190–212 CrossRef CAS PubMed.
- D. Magde, G. E. Rojas and P. G. Seybold, Photochem. Photobiol., 1999, 70, 737–744 CrossRef CAS PubMed.
- K. A. Colby, J. J. Burdett, R. F. Frisbee, L. Zhu, R. J. Dillon and C. J. Bardeen, J. Phys. Chem. A, 2010, 114, 3471–3482 CrossRef CAS PubMed.
- E. K. L. Yeow, K. P. Ghiggino, J. N. H. Reek, M. J. Crossley, A. W. Bosnian, A. P. H. J. Scheming and E. W. Meijer, J. Phys. Chem. B, 2000, 104, 2596–2606 CrossRef CAS.
- M. N. Berberan-Santos, P. Choppinet, A. Fedorov, L. Jullien and B. Valeur, J. Am. Chem. Soc., 1999, 121, 2526–2533 CrossRef CAS.
- K. Koynov and H. J. Butt, Curr. Opin. Colloid Interface Sci., 2012, 17, 377–387 CrossRef CAS PubMed.
- A. S. Klymchenko, E. Roger, N. Anton, H. Anton, I. Shulov, J. Vermot, Y. Mely and T. F. Vandamme, RSC Adv., 2012, 2, 11876–11886 RSC.
- H.-Q. Peng, J.-F. Xu, Y.-Z. Chen, L.-Z. Wu, C.-H. Tung and Q.-Z. Yang, Chem. Commun., 2014, 50, 1334–1337 RSC.
- H.-Q. Peng, Y.-Z. Chen, Y. Zhao, Q.-Z. Yang, L.-Z. Wu, C.-H. Tung, L.-P. Zhang and Q.-X. Tong, Angew. Chem., Int. Ed., 2012, 51, 2088–2092 CrossRef CAS PubMed.
- K. V. Rao, K. K. R. Datta, M. Eswaramoorthy and S. J. George, Chem. – Eur. J., 2012, 18, 2184–2194 CrossRef CAS PubMed.
- A. Adronov and J. M. J. Frechet, Chem. Commun., 2000, 1701–1710 RSC.
- J. G. Woller, J. K. Hannestad and B. Albinsson, J. Am. Chem. Soc., 2013, 135, 2759–2768 CrossRef CAS PubMed.
- B. O. Dabbousi, J. Rodriguez-Viejo, F. V. Mikulec, J. R. Heine, H. Mattoussi, R. Ober, K. F. Jensen and M. G. Bawendi, J. Phys. Chem. B, 1997, 101, 9463–9475 CrossRef CAS.
- A. P. Alivisatos, Science, 1996, 271, 933–937 CAS.
- X. Michalet, F. F. Pinaud, L. A. Bentolila, J. M. Tsay, S. Doose, J. J. Li, G. Sundaresan, A. M. Wu, S. S. Gambhir and S. Weiss, Science, 2005, 307, 538–544 CrossRef CAS PubMed.
- J. Hofkens, M. Maus, T. Gensch, T. Vosch, M. Cotlet, F. Kohn, A. Herrmann, K. Mullen and F. De Schryver, J. Am. Chem. Soc., 2000, 122, 9278–9288 CrossRef CAS.
- D. A. Vanden Bout, W. T. Yip, D. Hu, D. K. Fu, T. M. Swager and P. F. Barbara, Science, 1997, 277, 1074–1077 CrossRef CAS.
- H. Lin, R. Camacho, Y. Tian, T. E. Kaiser, F. Würthner and I. G. Scheblykin, Nano Lett., 2010, 10, 620–626 CrossRef CAS PubMed.
- E. Rampazzo, S. Bonacchi, R. Juris, M. Montalti, D. Genovese, N. Zaccheroni, L. Prodi, D. C. Rambaldi, A. Zattoni and P. Reschiglian, J. Phys. Chem. B, 2010, 114, 14605–14613 CrossRef CAS PubMed.
- D. Genovese, E. Rampazzo, S. Bonacchi, M. Montalti, N. Zaccheroni and L. Prodi, Nanoscale, 2014, 6, 3022–3036 RSC.
- H. Özhalıcı-Ünal and B. A. Armitage, ACS Nano, 2009, 3, 425–433 CrossRef PubMed.
- A. N. Jordan, N. Siraj, S. Das and I. M. Warner, RSC Adv., 2014, 4, 28471–28480 RSC.
- H. Yao and K. Ashiba, ChemPhysChem, 2012, 13, 2703–2710 CrossRef CAS PubMed.
- D. L. Farkas, M. Wei, P. Febbroriello, J. H. Carson and L. M. Loew, Biophys. J., 1989, 56, 1053–1069 CrossRef CAS.
- L. F. Mottram, S. Forbes, B. D. Ackley and B. R. Peterson, Beilstein J. Org. Chem., 2012, 8, 2156–2165 CrossRef CAS PubMed.
- P. K. S. Magut, S. Das, V. E. Fernand, J. Losso, K. McDonough, B. M. Naylor, S. Aggarwal and I. M. Warner, J. Am. Chem. Soc., 2013, 135, 15873–15879 CrossRef CAS PubMed.
- R. P. Haugland, Handbook of fluorescent probes and research chemicals, Molecular Probes Inc., Eugene, OR, 9th edn, 1996 Search PubMed.
- N. L. Thompson, in Topics in Fluorescence Spectroscopy Techniques, ed. J. R. Lakowicz, Plenum Press, New York, 1991, vol. 1, p. 337 Search PubMed.
Footnote |
| † Electronic supplementary information (ESI) available: Additional data on synthesis of rhodamine B derivatives, AFM and excitation spectra of NPs. See DOI: 10.1039/c5nr04955e |
| This journal is © The Royal Society of Chemistry 2015 |