
 Open Access Article
 This Open Access Article is licensed under a
 Creative Commons Attribution 3.0 Unported Licence
POZylation: a new approach to enhance nanoparticle diffusion through mucosal barriers†
Edward D. H.
Mansfield
a,
Katy
Sillence
b,
Patrick
Hole
b,
Adrian C.
Williams
a and
Vitaliy V.
Khutoryanskiy
*a
aSchool of Pharmacy, University of Reading, PO Box 224, Whiteknights, Reading, Berkshire RG6 6AD, UK. E-mail: v.khutoryanskiy@reading.ac.uk
bMalvern Instruments Limited, London Road, Amesbury, Wiltshire SP4 7RT, UK
First published on 17th July 2015
Abstract
The increasing use of nanoparticles in the pharmaceutical industry is generating concomitant interest in developing nanomaterials that can rapidly penetrate into, and permeate through, biological membranes to facilitate drug delivery and improve the bioavailability of active pharmaceutical ingredients. Here, we demonstrate that the permeation of thiolated silica nanoparticles through porcine gastric mucosa can be significantly enhanced by their functionalization with either 5 kDa poly(2-ethyl-2-oxazoline) or poly(ethylene glycol). Nanoparticle diffusion was assessed using two independent techniques; Nanoparticle Tracking Analysis, and fluorescence microscopy. Our results show that poly(2-ethyl-2-oxazoline) and poly(ethylene glycol) have comparable abilities to enhance diffusion of silica nanoparticles in mucin dispersions and through the gastric mucosa. These findings provide a new strategy in the design of nanomedicines, by surface modification or nanoparticle core construction, for enhanced transmucosal drug delivery.
1. Introduction
The field of nanomedicine has expanded rapidly over the past decade, with over 3500 publications in 2014 alone. Indeed some nano-scale formulations are currently marketed, including Abraxane,1 and Doxil,2 with many others, such as C-Dots,3 undergoing clinical trials. Nanomedicines are advantageous as they typically penetrate deeper into tissue and membranes than larger micro- or macro-sized particles, allowing them to readily distribute throughout the body, leading to a greater efficiency of drug delivery.4–6 However, in order to achieve this, the particles must first cross the body's defensive barriers, for example the mucosal membranes.Mucus is a biological gel that coats tissue surfaces generally exposed to the external environment such as the airways, GI tract, eyes and reproductive tract. It forms a defensive barrier that captures or blocks foreign bodies and pathogenic bacteria from reaching the underlying cells and causing damage or disease. Mucus is predominantly comprised of water (around 95%), glycoproteins (2–5%), lipids, and salts. The glycosylated proteins are from the MUC family, and are more commonly known as mucins. However, their functionality varies depending on bodily location,7–9 and on the disease state of the system, leading to differences in rheological properties.10 In some routes of drug administration, such as oral, nasal, pulmonary or vaginal, mucus acts as a barrier and therefore drugs and/or drug vehicles need to be specifically designed to penetrate this layer before they are removed via mucus clearance.11 Enhancing mucosal penetration and permeation is therefore essential to avoid capture and excretion from the mucosal barrier, and to fully exploit the benefits of nanoparticle-based drug delivery.
Recently, Hanes et al.12 reported that the diffusion of 200 nm polystyrene nanoparticles through mucus gels could be facilitated by PEGylation. Subsequent reports describe the mucopenetrative properties of other nanomaterials coated with poly(vinyl alcohol).13,14
Previously, we have shown that PEGylation of thiolated silica nanoparticles decreased their mucoadhesion onto intact corneae,15 and facilitated their penetration into de-epithelialized corneae.16 PEGylation of silica nanoparticles reduces the adhesive interactions with collagen fibers in the stroma, due to the “stealth” properties of poly(ethylene glycol) (PEG), and so enhances penetration.
Here, we report for the first time the use of poly(2-ethyl-2-oxazoline) (POZ) to facilitate the diffusion of the nanoparticles in porcine gastric mucin dispersions, and into ex vivo porcine gastric mucosa. POZ has recently attracted a great deal of attention as a non-ionic polymer that exhibits many useful physicochemical properties, biocompatibility and “stealth” behaviour similar to those of PEG.17–23 However, to the best of our knowledge, there have been no previous reports exploring POZylation to facilitate the diffusion of nanomaterials through mucosal barriers.
In the current work, the surface of 50 nm thiolated silica nanoparticles was successfully functionalized with 5 kDa POZ and PEG using thiol–alkyne and thiol–maleimide click reactions, respectively. The diffusion of parent and functionalized nanoparticles in porcine gastric mucin dispersions was studied using Nanoparticle Tracking Analysis (NTA). Previously NTA has only been used to assess the diffusive properties of nanoparticles in solutions of synthetic polymers and neutral polysaccharides.24 Additionally, a fluorescent microscopy technique, combined with image analysis, was developed to study the penetration of parent and functionalized nanoparticles into ex vivo porcine gastric mucosa. The results show that both PEG and POZ enhance the diffusion of nanoparticles in both porcine gastric mucin dispersions and through ex vivo gastric mucosa. Considering the significant advantages of POZ in comparison to PEG (i.e. ease in synthesis,20 high degree of renal clearance, and lack of bioaccumulation17) POZylation is a highly promising strategy to enhance the penetration of nanomaterials through mucosal barriers.
2. Materials and methods
2.1 Materials
3-Mercaptopropyltrimethoxysilane (MPTS), maleimide terminated poly(ethylene glycol) 5 kDa (PDI ≤ 1.1), alkyne terminated poly(2-ethyl-2-oxazoline) 5 kDa (PDI ≤ 1.2), tri-ethyl amine (TEA), and porcine gastric mucin type II were purchased from Sigma-Aldrich (Gillingham, UK). BODIPY C5 TMR maleimide was purchased from Invitrogen (UK). Dimethyl sulfoxide (DMSO) and fluorescein-O-methacrylate was purchased from Fisher Scientific (UK). All water used in this study was ultrapure from a Purelab UHQ water filter (18 Ω). All other reagents were of analytical grade or higher, purchased from Sigma-Aldrich, unless otherwise stated.2.2 Core nanoparticle synthesis
Thiolated silica nanoparticles were synthesised according to a previously described protocol.15,24 Briefly, 0.75 mL MPTS was mixed with 20 mL DMSO, and 0.5 mL NaOH (0.5 mol L−1). The mixture was bubbled through with air to facilitate partial oxidation of thiol groups and formation of disulphide bonds. The reaction was left for 24 hours at room temperature under continuous stirring. After the reaction was complete, nanoparticle suspensions were dialysed against 4 L deionised water for 48 hours using cellulose dialysis membrane (molecular weight cut off 12–14 kDa, Medicell International Ltd, UK). The water was changed every 2 hours.2.3. Determination of free thiol groups on nanoparticle surfaces
Ellman's assay was used to quantify the amount of reactive thiol groups present on nanoparticle surfaces. The procedure utilised was that of Bravo-Osuna25 with minor modifications. Prior to the assay, 1 mL of nanoparticle suspension was freeze-dried using a Heto PowerDry LL3000 freeze drier, and the weight recorded before and after in order to determine concentration of particles (mg mL−1). Then, 3 mg of dry particles were re-suspended in 10 mL phosphate buffer (pH 8, 0.5 mol L−1), and allowed to incubate for 1 hour. 10 aliquots (0.5 mL) were individually placed in Eppendorf vials and reacted with 0.5 mL 5,5′-dithiobis-(2-nitrobenzoic acid) (0.3 mg mL−1) for 2 hours in the dark. 200 μL aliquots were then pipetted into a 96 well plate (three repeats for each Eppendorf vial), and the absorbance measured at 420 nm using a BioTek Epoch plate reader. L-Cysteine–HCl solutions were used as standards in the concentration range of 3.125 μM to 12.69 μM, and reacted under the same conditions as for the nanoparticles.2.4 Fluorescent labelling of nanoparticles
Two different fluorescent probes were used in this study. For NTA analysis, nanoparticles were labelled with BODIPY TMR C5 maleimide (excitation 544 nm, emission 570 nm) (Life Technologies Ltd, Paisley, UK), and for stomach mucosa penetration studies, fluorescein-O-methacrylate (excitation 490 nm, emission 520 nm) was used.Based on the results of the Ellman's assay, nanoparticles were labelled with fluorophore, so that only 5% of the free thiol groups had reacted, leaving 95% free for polymer functionalisation. This loading was selected from an optimisation study wherein a series of increasingly fluorescent nanoparticles were produced, their fluorescence spectra determined and compared to that of a 1% w/v mucus suspension; 5% labelling was sufficient to ensure that the particles were detectable beyond the background fluorescence of mucin (Fig. 1s†). Therefore, 380 μL BODIPY (1.8 mM) was reacted with each 5 mL suspension of nanoparticles (19 ± 3 mg mL−1). The fluorophore and nanoparticles were reacted for 24 hours in the dark, and then purified by dialysis (again in the dark), as described in 2.2.
For fluorescein labelling, fluorescein-O-methacrylate was initially dissolved in a 50![[thin space (1/6-em)]](https://www.rsc.org/images/entities/char_2009.gif) :50% v/v ethanol–deionised water solution, to a final fluorescein concentration of 1.8 mM. Additionally, a 5 mL nanoparticle suspension (19 ± 3 mg mL−1) was diluted with 5 mL DMSO. Following this, 2 mL of fluorescein-O-methacrylate solution was added (so the final concentration of fluorescein-O-methacrylate in the reaction mixture was 0.066 mM), along with 200 μL TEA (0.033 mM final concentration). The reaction was left to stir in a flask for 24 hours in the dark. Particles were purified by dialysis once the reaction was complete, as described in 2.2.
:50% v/v ethanol–deionised water solution, to a final fluorescein concentration of 1.8 mM. Additionally, a 5 mL nanoparticle suspension (19 ± 3 mg mL−1) was diluted with 5 mL DMSO. Following this, 2 mL of fluorescein-O-methacrylate solution was added (so the final concentration of fluorescein-O-methacrylate in the reaction mixture was 0.066 mM), along with 200 μL TEA (0.033 mM final concentration). The reaction was left to stir in a flask for 24 hours in the dark. Particles were purified by dialysis once the reaction was complete, as described in 2.2.
2.5 PEGylation and POZylation of nanoparticles
Two different polymers were used to functionalise the silica nanoparticles; 5 kDa PEG and 5 kDa POZ. Maleimide terminated PEG (100 mg) was added to a 5 mL suspension of fluorescently labelled nanoparticles (19 ± 3 mg mL−1), and left to react under constant stirring for 24 hours in the dark. Samples were purified by dialysis as in 2.2. Similarly, alkyne terminated POZ (100 mg) was added to a 5 mL suspension of fluorescent nanoparticles (19 ± 3 mg mL−1), which had been diluted with 5 mL DMSO prior to the reaction. Following this, 200 μL TEA was added, and the reaction left for 24 hours under constant stirring in the dark. TEA was previously reported to facilitate thiol–yne click reactions.26 Again, the samples were purified by dialysis.2.6 Nanoparticle characterisation
The sizes of all nanoparticle samples (parent thiolated silica, PEGylated silica and POZylated silica) were characterised using dynamic light scattering (DLS) and nanoparticle tracking analysis (NTA). Additionally, surface functionality was confirmed using Fourier transform infrared spectroscopy (FTIR) and FT-Raman spectroscopy.DLS measurements used a Zetasizer Nano-ZS (Malvern, UK). Samples were diluted 1:100 into ultrapure water to appropriate concentrations in low volume plastic cuvettes (Fisher Scientific). A refractive index of 1.49 and absorbance of 0.01 was used for all measurements. Individual measurements were carried out for 10 seconds per run, with 12 runs per reading, repeated in triplicate. This was repeated for 3 separate samples at 25 °C. ξ-Potential values were also measured, using DTS-1061 folded capillary tube cuvettes (Malvern, UK). Samples were prepared to the same concentration as used in sizing experiments. Samples were measured using 20 sub-runs per reading, repeating 3 times for each sample. Each sample was measured three times and the results were processed using the Smoluchowski model (Fκa = 1.50).
NTA measurements used a LM10 system with LM14 laser module and top plate, and green 532 nm laser (Malvern, UK). NTA requires very low concentrations of nanoparticles in suspension, as each nanoparticle is individually tracked. Therefore, samples were diluted 1:1000000 from the stock solution. Samples were then placed in a 1 mL syringe and loaded into the system. The syringe was placed into an NTA syringe pump set to move at a flow rate of 30 AU. Videos were recorded for 60 seconds, and 5 videos were made per individual sample, and 3 samples were measured in total. Analysis was carried out using NTA v3.0. All NTA sizing experiments were at room temperature (25 °C) under the constant syringe pump flow, to obtain data representative of all particles in the sample.
Freeze-dried samples were used for all spectroscopic analyses. FTIR spectra were recorded using a Spectrum 100 FTIR spectrophotometer (Perkin-Elmer, UK). Samples were measured for an average of 14 scans, between 4000 and 650 cm−1, at a resolution of 4 cm−1.
FT-Raman spectra were recorded on a Nicolet NXR 9650 Raman spectrophotometer (Thermo Scientific, UK) from an average of 1000 scans, between 4000 and 10 cm−1, at a resolution of 4 cm−1.
Thermogravimetric analysis (TGA) was carried out using a Q500 (TA Instruments, UK) with nitrogen as an inlet gas. The analyses were carried out for unfunctionalised thiolated silica, PEGylated, and POZylated nanoparticles. The instrument was zeroed against an empty platinum TGA pan (TA Instruments, UK). Samples were placed into an aluminium DSC pan, before being placed into the platinum TGA pan, and loaded into the instrument. The initial temperature was set to 35 °C, and allowed to equilibrate for 5 minutes. Thermal decomposition of samples was studied between 35 and 500 °C, at 5 °C min−1 heating rate.
2.7 Characterisation of mucin suspensions
All mucin suspensions used in this study for both diffusion and rheological experiments were prepared by suspending 500 mg porcine gastric mucin in 50 mL deionised water, resulting in a 1% w/v suspension. Samples were left to stir overnight at room temperature. Three independent stock solutions were made for triplicate experiments.Rheological analysis used an AR 2000ex rheometer (TA Instruments, UK) with a 40 mm parallel plate. Initially, samples were measured to determine the linear visco-elastic region at 25 °C, with the solvent trap in place. A fixed frequency of 1 Hz was applied, and the amplitude strain measured between 0.01 and 50%. Based on these results, an amplitude of 1% was selected for all remaining experiments. Following this, a frequency sweep was performed, scanning between 0.1 and 10 Hz, at a set amplitude of 1% (again at 25 °C with the solvent trap). The final optimal parameters employed were; an amplitude of 1% and frequency of 0.5 Hz. These were applied for all remaining rheological experiments.
After the above parameters were defined, a temperature ramp study was carried out in order to determine the viscosity over a range of temperatures, to ensure that the sample remains in the viscoelastic region. Here, the instrument was set to increase by 1 °C min−1, between 20 and 40 °C. The viscosity was then plotted as a function of time, and the line equation used to determine the viscosity of the mucin dispersion at 25 and 37 °C (Fig. 2s†). Each stock solution was measured 3 times, for each parameter (amplitude, frequency, and temperature), resulting in a total of 9 readings.
2.8 Assessing the diffusion of nanoparticles in porcine gastric mucin dispersions using NTA
All diffusion measurements were carried out using the NanoSight LM10, with LM14 top-plate and syringe pump. Fluorescent nanoparticles were diluted down by a factor of 10000 in deionised water. 10 μL of this dilution was then added to a 990 μL suspension of 1% w/v gastric mucus, forming a final dilution of 1:1000000.
Samples were injected into the NanoSight system and the flow-rate was set at 70 AU in order to minimise fluorescent bleaching of the nanoparticles during analysis. All videos were recorded through a long pass filter, with a wavelength cut-on of 550 nm (Thorlabs, UK). 6 × 60 second videos were recorded at 25 and 37 °C. Each independent stock dispersion of mucin was analysed three times with each nanoparticle type, resulting in a total of 9 × 6, 60 second videos for each temperature, with a viscosity of 25 cP at 25 °C and 28 cP at 37 °C (as determined from rheological analyses).
2.9 Ex vivo analysis of nanoparticle diffusion through porcine gastric mucosa
Porcine stomach was obtained from a local abattoir (P.C.Turner Abattoirs, Farnborough, UK), and dissected to remove any connective tissue and muscle, leaving only the mucosa, submucosa, and stomach lining intact. 4 × 1 cm2 sections were cut and placed on a glass plate, with the mucosal layer facing upward. 100 μL of fluorescein labelled nanoparticles were pipetted onto the sections. Deionised water was also administered as a blank control. Samples were left to incubate over 4 time periods; 0, 15, 30, and 45 minutes at room temperature. Following each time point, each section was placed mucus side up into a small (3.5 × 5.5 cm) weighing boat (Fisher), half filled with OCT, a cryoprotective embedding medium. They were then placed on dry ice, before being completely embedded in OCT to preserve the particle-loaded mucus membrane. Once all sections were embedded, samples were left on dry ice for 3–4 hours, before being transferred to a −80 °C freezer until processing.For sectioning, samples were removed from the −80 °C freezer and placed on dry ice. Each sample was mounted onto a standard solid object holder, 22 mm in diameter using OCT, and placed on dry ice for 30 min until completely frozen. 30 μm sections were cryosectioned transversely using a standard 189 × 27 × 10 mm blade at 22°, placed onto glass slides (VWR, UK) and left to dry in air for 30 minutes before being stored in a slide box. All sections were cut from interior to exterior (i.e. upwards through the mucosal layer) in order to avoid carriage of particles into the biological tissue during the cutting process. All sections were cut using a Bright 5040 cryostat in a Bright Model PTF freezing chamber at −20 °C (Bright Instrument Co. Ltd, UK).
Sections were placed under a Leica MZ10F stereomicroscope (Leica Microsystems, UK) and images taken using an exposure time of 0.8 ms. All images were taken through an ET-GFP filter (Leica Microsystems, UK), enabling the particles to be detectible on the tissue, due to their fluorescent labelling. Three images were taken for each section.
ImageJ software (National Institute of Health, USA, v1.43) was used to quantify penetration of the nanoparticles. For each image (three for each particle type at each time point); the background was subtracted, and a line drawn across the mucus barrier, measuring 1.5 mm in length, and the “plot profile” measured. This was repeated 5 times at random locations along the mucus barrier for each image, providing a total of 15 (3 × 5) profiles for each sample. Each individual profile was then assessed for the degree of penetration. This was done by measuring the width of the predominant peak using Excel 2010. After each profile had been analysed, the mean values were calculated. The value obtained for the blank tissue at the appropriate time point was then subtracted from the other values at the same time point in order to determine penetration. This method is shown graphically in Fig. 3s.†
2.9 Statistics
In all cases, experiments were repeated 3 times (unless otherwise stated), and the data presented as mean ± standard deviation. Two-way ANOVA statistical analyses were performed on GraphPad Prism v5.0 using Tukey's post hoc test, where p > 0.05 was considered to be statistically insignificant.3. Results and discussion
3.1 Nanoparticle synthesis and characterisation
In this study PEG and POZ were used to modify nanoparticle surfaces. PEG has previously been reported to facilitate penetration of nanoparticles into mucosal membranes,27–29 and hence provided a useful comparator to the POZ-based enhancement in this study.Parent thiolated silica nanoparticles were highly monodisperse (PDI < 0.15) and carried an abundance of surface thiol groups, allowing facile surface functionalisation and fluorescent labelling via click reactions. Thiolated nanoparticles were reacted with 5 kDa maleimide terminated PEG forming a PEGylated shell as previously reported by our group.15,24 POZylated nanoparticles were prepared using a novel approach, by reacting thiolated nanoparticles with 5 kDa alkyne terminated POZ via thiol–yne click-chemistry.
The hydrodynamic sizes of all nanoparticles synthesised in this study were characterised using DLS and NTA. Fig. 1 shows the particle size distributions recorded using DLS. NTA data are shown in Fig. 4s.†Table 1 summarises the physicochemical characteristics of all nanoparticles, including particle size analysis from both DLS and NTA.
 | ||
| Fig. 1 Dynamic light scattering size distributions of thiolated (blue), PEGylated (red) and POZylated (green) silica nanoparticles. | ||
| Sample | Z-Averagea (nm) | PDIa | ξ-Potentiala (mV) | Modal particle sizeb (nm) | Diffusion coefficient in waterb (×104 nm2 s−1) | Concentration (mg mL−1) | Free thiol content (μM g−1) |
|---|---|---|---|---|---|---|---|
| a Determined using DLS. b Determined using NTA. | |||||||
| Thiolated silica | 48 ± 1 | 0.137 ± 0.050 | 54 ± 2 | 47 ± 3 | 857 ± 78 | 19 ± 3 | 229 ± 13 |
| PEGylated silica | 70 ± 1 | 0.175 ± 0.070 | 24 ± 1 | 63 ± 2 | 687 ± 41 | 13 ± 1 | 93 ± 13 |
| POZylated silica | 56 ± 2 | 0.130 ± 0.010 | 37 ± 1 | 57 ± 2 | 744 ± 82 | 7 ± 1 | 20 ± 11 |
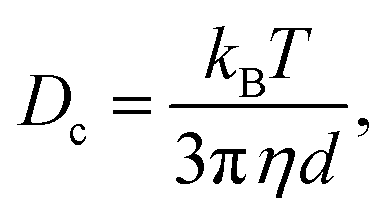
Both DLS and NTA are techniques used primarily to determine the size of nanoparticles but differ in how they determine particle sizes. DLS uses scattered light to calculate particle movement under Brownian motion, and employs an autocorrelation function to determine a diffusion coefficient, based on the refractive index of the sample, through use of the Stokes-Einstein equation (eqn (1)). Particle sizes can thus be calculated and averaged based on scattering intensity to generate a z-average particle size,
 | (1) |
In contrast, NTA measures the movement of individual particles over a period of time, and plots their x and y coordinates as pixels, where each pixel represents a specific size. Based on the number of pixels a particle crosses and the speed at which they cross, a diffusion coefficient can be calculated, dependent on the viscosity of the system. This diffusion coefficient is then used in the Stokes-Einstein equation (as above) to generate a particle size.31 By using this tracking technique, it is also possible to determine the movement and diffusion coefficients of fluorescent nanoparticle suspensions in solutions of polymers or proteins. Recently we demonstrated the value of NTA to study the diffusive properties of nanoparticles in solutions of different polymers.24
NTA presents particle count (particles per mL) as a function of size. Based on the concentration values, a particle size distribution is calculated, showing the population of particles at a given size. The difference in concentration evident from the size distribution from NTA analysis can be explained by the difference in dry-weight of the nanoparticles, as demonstrated in Table 1. This discrepancy is likely due to the fact that the functionalised particles are less prone to aggregation, and therefore the actual number of particles per mL of suspension is lower.
Size data from both DLS and NTA for thiolated, PEGylated and POZylated silica are in very good agreement and are consistent with expectations; decorating the thiolated nanoparticles with a polymer coating increases their particle sizes.
The physicochemical characteristics of thiolated nanoparticles reported here are in good agreement with our previous study.24 The particle size and diffusion coefficient for thiolated silica nanoparticles in water are not significantly different for the data reported by Mun et al. (p > 0.05).24 The size of the particles functionalised with 5 kDa PEG is also similar to the reported value.
Comparison between the particles synthesised here, and those reported by Mun et al.,24 shows that the concentration of free thiol groups for unfunctionalised silica nanoparticles in this study, and those reported by Mun et al.24 (249 ± 30 μmol g−1), are in good agreement, as is the free thiol content for 5 kDa PEG (78 ± 5 μmol g−1). This demonstrates that the synthesis is highly reproducible, and produces a monodisperse suspension of nanoparticles, which can be very effectively and easily modified using click chemistry.
Further characterisation of nanoparticles was conducted using FTIR and FT-Raman spectroscopy (Fig. 2 for FTIR). The FTIR spectrum of thiolated nanoparticles shows the presence of strong vibrational modes at 2934 cm−1 (asymmetric CH2 stretching), 1108 cm−1 (Si–O–Si asymmetric stretching), 1030 cm−1 (Si–O–Si bending vibration) and 636 cm−1 (Si–S stretching) and weaker bands at 1404 cm−1 and 1244 cm−1. Additionally, the Raman spectrum of these particles shows the presence of strong modes at 2905 cm−1 (asymmetric CH2 stretching), 2562 cm−1 (SH stretching), and 1420 cm−1 (CH2 bending), and weaker bands at 1312 cm−1, 1230 cm−1, 1055 cm−1 (Si–O–Si stretching), 807 cm−1, and 631 cm−1.
 | ||
| Fig. 2 FTIR spectra for thiolated (blue), PEGylated (red), and POZylated (green) silica nanoparticles. | ||
The FTIR spectrum of the PEGylated sample shows peaks at 2878 cm−1 (CH2 stretching), 1710 cm−1 (C![[double bond, length as m-dash]](https://www.rsc.org/images/entities/char_e001.gif) O groups in maleimide), 1460 cm−1, 1344 cm−1, 1242 cm−1, 1092 cm−1 (C–O–C and Si–O–Si stretching vibrations), 840 cm−1 and 692 cm−1. The appearance of the band at 1710 cm−1 in this spectrum clearly shows successful conjugation of PEG maleimide to the surface of the thiolated silica nanoparticles.
O groups in maleimide), 1460 cm−1, 1344 cm−1, 1242 cm−1, 1092 cm−1 (C–O–C and Si–O–Si stretching vibrations), 840 cm−1 and 692 cm−1. The appearance of the band at 1710 cm−1 in this spectrum clearly shows successful conjugation of PEG maleimide to the surface of the thiolated silica nanoparticles.
POZylated nanoparticles show the presence of the following peaks in their FTIR spectra: 2940 cm−1 (asymmetric CH2 stretching), 1636 cm−1 (CO stretching of POZ), 1422 cm−1 (asymmetric vibrations of CH3 groups in POZ), 1110 cm−1 and 1140 cm−1 (typical for Si–O–Si asymmetric stretching and bending, respectively). The Raman spectra of POZylated particles have the following main peaks: 2914 cm−1 (asymmetric CH2 stretching), 2559 cm−1 (stretching of unreacted SH groups of silica nanoparticles), 1649 cm−1 (CO stretching of POZ), 1448 cm−1 (asymmetric vibrations of CH3 groups in POZ), and 1032 cm−1 (Si–O–Si groups in silica nanoparticles). Thus, both spectroscopic techniques clearly confirm the presence of PEG and POZ on the surface of the PEGylated and POZylated nanoparticles, respectively.
TGA was used in this work to determine the amount of polymer bound to the nanoparticle surface. TGA thermograms showing thermal decomposition of each particle type can be found in Fig. 5s, ESI†). By using the thiolated silica as a reference sample (i.e. by subtracting the relative weight loss in this sample from the functionalised particles weight change), it was found that PEGylated nanoparticles had 69% of PEG bound, and POZylated nanoparticles had 46% of POZ. Based on this, it is clear that less POZ has bound to the nanoparticle surface compared to PEG, most likely due to steric hindrance. As the 2-ethyl-2-oxazoline repeating unit is significantly spatially larger than ethylene glycol, a smaller quantity of POZ will reach the particle surface and be able to bind compared to PEG. This smaller quantity of bound POZ on the nanoparticle surface could lead to the smaller particle size (Table 1). Another reason for the size difference between PEGylated and POZylated nanoparticles is the number of repeating units found in these polymers (50 for POZ, and 113 for PEG). As ethylene glycol (Mr = 44) is a smaller molecule than 2-ethyl-2-oxazoline (Mr = 99), the chain length will be longer, thus leading to a larger particle size.
3.2 Nanoparticle diffusion through mucus and stomach tissue
NTA has previously been reported as a powerful tool to study the diffusion of nanoparticles in aqueous solutions of polymers.24 The use of NTA to study diffusion of nanoparticles in mucin dispersions is more challenging because of intrinsic fluorescence from this biopolymer. To avoid this interference, the nanoparticles were labelled with BODIPY, whose fluorescent properties allow differentiation from those of mucin. By fluorescently labelling the nanoparticles it is possible to track their movement without interference from any non-fluorescent species present in the mixture.Here, the diffusion of nanoparticles in the mucin dispersions was studied both at ambient (25 °C), and physiological temperatures (37 °C). Fig. 3 shows the diffusion coefficient distributions for thiolated, PEGylated and POZylated silica nanoparticles in mucin dispersions at 37 °C. Diffusion coefficient distributions recorded at room temperature (25 °C) can be seen in ESI (Fig. 6s†). The diffusion coefficients recorded for both the functionalised and unfunctionalised nanoparticles in mucin dispersions were significantly lower (p < 0.05) than their diffusion in deionised water (Table 1). This is due to the increased viscosity of the mucin suspension compared to water. The functionalisation of nanoparticles with PEG and POZ enhances their diffusion in mucin dispersions at both temperatures, as the diffusion coefficient distributions of both PEGylated and POZylated nanoparticles show a clear shift to higher values compared to that of thiolated nanoparticles.
 | ||
| Fig. 3 Distribution of diffusion coefficients for thiolated (blue), PEGylated (red) and POZylated (green) silica nanoparticles in 1% w/v gastric mucus at 37 °C. Data represents the mean distributions, where n = 9. | ||
Fig. 4a shows the mean values for diffusion coefficients recorded for thiolated, PEGylated and POZylated nanoparticles at 25 and 37 °C. No significant difference is observed in diffusion coefficients for a given nanoparticle in mucin measured at 25 or 37 °C (p > 0.1). However, the diffusion coefficient for PEGylated and POZylated silica nanoparticles is significantly different from that of unfunctionalised thiolated nanoparticles at both temperatures (p < 0.001).
 | ||
| Fig. 4 Experimentally determined diffusion coefficients (a), and calculated diffusion coefficients (b) of functionalised and unfunctionalised silica nanoparticles through 1% w/v gastric mucus. Data show the mean ± standard deviation, where n = 9. | ||
Alongside this, the Stokes-Einstein equation was used to calculate the theoretical diffusion coefficients (Fig. 4b) based on the particles z-average and standard deviation from DLS (Table 1). The diffusion coefficients for both parent and functionalised nanoparticles measured using NTA are greater than those calculated using the Stokes-Einstein equation. Deviations between experimentally measured and calculated diffusion coefficients exist when the hydrodynamic radius (Rh) of the particles is smaller than (or comparable to) the radius of gyration (Rg) of any polymers present in a liquid medium (solution or melt).30 If the Rg for the polymer is higher than the Rh of the particles, then the nanoparticles can ideally move in between the mesh fibres of the polymer. This means that particles smaller than the Rg will be exposed to a different microenvironment than particles larger than the Rg, and will therefore appear to diffuse quicker than predicted. However, if the Rh is higher than the Rg, then the particles will move around the mesh fibres of the polymer, and so the diffusion coefficient will match that predicted by the Stokes-Einstein equation.32
In our case, the mucin protein in the dispersions is highly polydisperse, with particle sizes exceeding 1 μm,33,34i.e. clearly much greater than the nanoparticle size used in this study; therefore the substantial deviation between our measured diffusion coefficients and the predicted values is not surprising.
In order to correlate the nanoparticle diffusion coefficients in a mucin dispersion to their penetration into a mucosal tissue, fluorescently-labelled thiolated, PEGylated and POZylated nanoparticles were applied to freshly excised porcine stomach mucosa. The particles were left in contact with the tissue for 0, 15, 30 and 45 minutes and were then frozen and sectioned. Images were then collected using a stereomicroscope and ImageJ used to quantify the penetration by thiolated, PEGylated and POZylated silica (Fig. 7s†), normalised to a sample with no particles. The results are shown in Fig. 5.
 | ||
| Fig. 5 Permeation of thiolated, PEGylated, and POZylated silica nanoparticles through porcine gastric mucosa. The values represent the means of 3 repeats ± standard deviation. All values were subtracted from values obtained for the blanks. *Represents p < 0.05, **represents p < 0.01 and ***represents p < 0.005. | ||
The thiolated nanoparticles show very little penetration into the gastric mucosa, even following 45 minutes of treatment, whereas PEGylated and POZylated particles have greater penetration into, and permeation through, the biological tissue.
The enhanced penetration of PEGylated and POZylated nanoparticles into the gastric mucosa, compared to their thiolated counterpart, are in excellent agreement with the data on their diffusivity in mucin dispersions. The better diffusivity of PEGylated and POZylated nanoparticles compared to parent thiolated particles is related by the “stealth” character of both polymers that prevents their interaction with the components of mucus gel.
Mun et al.24 reported on the diffusion of particles decorated with PEG of two different molecular weights (750 Da vs. 5000 Da) through a variety of different polymer solutions. This study found that particles with smaller molecular weight PEG diffused quicker than particles with larger PEG chains. This could explain why in the current study POZylated particles diffuse more readily than PEGylated particles.
In this study, despite both polymers being of the same molecular weight, the size of POZylated nanoparticles is smaller compared to PEGylated nanoparticles, which explains a slower diffusion in the latter. This correlates with the data on the predicted diffusion coefficients (Fig. 4): the smaller POZylated particles have a larger diffusion coefficient compared to the PEGylated particles.
It has previously been established that thiolated silica nanoparticles have mucoadhesive properties and adhere to bovine cornea due to the formation of disulphide bridges with corneal mucins.15 Here, these particles show the lowest rate of diffusion in porcine gastric mucin dispersions and also no significant penetration into gastric mucosa, again probably related to their ability to adhere to mucins via disulphide bond formation. It should be noted that the mucin used for the NTA studies was pre-processed, and may lack some physiological characteristics of fresh mucus (e.g. a reduced amount of cysteine residues). Additionally, as there are two different mechanisms of diffusion being used in this study, namely diffusion through a mucin dispersion, and diffusion into a mucus gel, this discrepancy could be due to the lack of nanoparticle diffusion into a gel, whereas they still readily move around (under Brownian motion) in a gel. This could explain the diffusion coefficient expressed by the thiolated silica in the NTA study, but no permeation observed in the microscopic study.
When thiolated particles were PEGylated or POZylated they acquired “stealth” properties as the thiol groups were masked, leading to a reduction in their zeta potential. This modification resulted in significantly enhanced their diffusivity in mucin dispersions and concomitant increased penetration into gastric mucosa (Fig. 6).
 | ||
| Fig. 6 Schematic illustration of the penetration of thiolated (a), PEGylated (b) and POZylated (c) nanoparticles into stomach mucosa. | ||
Here we have demonstrated that the diffusive properties of mucoadhesive nanoparticles can be enhanced by functionalising their surface with either PEG or POZ. PEGylation has previously been demonstrated to enhance the diffusivity of particles in a mucus gel,12,27–29 however, our study is the first to report the potential of poly(2-ethyl-2-oxazoline) to facilitate penetration enhancement to a similar degree as that of poly(ethylene glycol). POZ has several advantages over PEG, most noticeably the facile polymerisation and modification. POZ can be readily synthesised via a living cationic polymerisation method allowing for control of the molecular weight of the polymer. Additionally, it can be easily modified around a pendant group attached to the amide, allowing for further functionalisation, including the potential to bind a drug forming a pro-drug.35,36 In contrast, PEG polymerisation typically involves complex synthetic routes and the use of toxic reactants.20 Additionally, it has been shown that in rats, POZ is much more readily excreted via the renal route, does not bioaccumulate and is biodegradable under certain conditions, whereas PEG can bioaccumulate and form vacuoles in some organs.17,37
4. Conclusions
We have demonstrated that the diffusive properties of mucoadhesive nanoparticles can be enhanced by functionalising their surface with either poly(ethylene glycol) or poly(2-ethyl-2-oxazoline). PEGylation is known to enhance the permeation of nanoparticles through a mucus barrier, but we show for the first time that poly(2-ethyl-2-oxazoline) is also able to facilitate penetration enhancement similar to that of poly(ethylene glycol). Considering the important benefits that POZ has over PEG, these results offer advantages in the design and application of nanomedicines. We have also developed a novel microscopic approach to probe the penetration of nanoparticles into ex vivo gastric mucosa and established a very good correlation between the diffusivity of nanoparticles in mucin dispersions, studied using nanoparticle tracking analysis and their penetration into and permeation through biological tissue.Acknowledgements
The authors are grateful to Malvern Instruments and the University of Reading for funding this project. Chemical Analysis Facility (University of Reading) is acknowledged for providing access to FTIR and FT-Raman spectroscopy and P.C.Turner Abattoirs (Farnborough, UK) for supplying the stomach tissues used in this work.Notes and references
- Approved Drugs – Paclitaxel (Abraxane). Center for Drug Evaluation and Research. Retrieved from http://www.fda.gov/Drugs/InformationOnDrugs/ApprovedDrugs/ucm323668.htm.
- Y. Barenholz, J. Controlled Release, 2012, 160, 117 CrossRef CAS PubMed.
- J. Choi, A. A. Burns, R. M. Williams, Z. Zhou, A. Flesken-Nikitin, W. R. Zipfel, U. Wiesner and A. Y. Nikitin, J. Biomed. Opt., 2007, 12, 064007 Search PubMed.
- M. Arruebo, R. Fernández-Pacheco, M. R. Ibarra and J. Santamaría, Nano Today, 2007, 2, 22 CrossRef.
- N. Venkatesan, J. Yoshimitsu, Y. Ito, N. Shibata and K. Takada, Biomaterials, 2005, 26, 7154 CrossRef CAS PubMed.
- L. T. C. Tran, S. Lesieur and V. Faivre, Expert Opin. Drug Deliv., 2014, 11, 1061 CrossRef CAS PubMed.
- D. J. Thornton and J. K. Sheehan, Proc. Am. Thorac. Soc., 2004, 1, 54 CrossRef CAS PubMed.
- J. Blanchette, N. Kavimandan and N. A. Peppas, Biomed. Pharmacother., 2004, 58, 142 CrossRef CAS PubMed.
- V. V. Khutoryanskiy, Macromol. Biosci., 2011, 11, 748 CrossRef CAS PubMed.
- M. A. McGuckin, S. K. Lindén, P. Sutton and T. H. Florin, Nat. Rev. Microbiol., 2011, 9, 265 CrossRef CAS PubMed.
- R. A. Cone, Adv. Drug Delivery Rev., 2009, 61, 75 CrossRef CAS PubMed.
- S. K. Lai, D. E. O'Hanlon, S. Harrold, S. T. Man, Y. Y. Wang, R. Cone and J. Hanes, Proc. Natl. Acad. Sci. U. S. A., 2007, 104, 1482 CrossRef CAS PubMed.
- M. Yang, S. K. Lai, T. Yu, Y. Y. Wang, C. Happe, W. Zhong, M. Zhang, A. Anonuevo, C. Fridley, A. Hung, J. Fu and J. Hanes, J. Controlled Release, 2014, 192, 202 CrossRef CAS PubMed.
- L. M. Ensign, R. Cone and J. Hanes, Adv. Drug Delivery Rev., 2012, 64, 557 CrossRef CAS PubMed.
- G. S. Irmukhametova, G. A. Mun and V. V. Khutoryanskiy, Langmuir, 2011, 27, 9551 CrossRef CAS PubMed.
- E. A. Mun, P. W. J. Morrison, A. C. Williams and V. V. Khutoryanskiy, Mol Pharm., 2014, 11, 3556 CrossRef CAS PubMed.
- F. C. Gaertner, R. Luxenhofer, B. Blechert, R. Jordan and M. Essler, J. Controlled Release, 2007, 119, 291 CrossRef CAS PubMed.
- A. Mero, G. Pasut, L. Dalla Via, M. W. M. Fijten, U. S. Schubert, R. Hoogenboom and F. M. Veronese, J. Controlled Release, 2008, 125, 87 CrossRef CAS PubMed.
- T. Verbrugghen, L. Wyffels, B. Monnery, R. Hoogenboom and S. Staelens, Nucl. Med. Biol., 2014, 41, 645 CrossRef PubMed.
- T. X. Viegas, M. D. Bentley, J. M. Harris, Z. Fang, K. Yoon, B. Dizman, R. Weimer, A. Mero, G. Pasut and F. M. Veronese, Bioconjugate Chem., 2011, 22, 976 CrossRef CAS PubMed.
- E. M. Pelegri-O'Day, E. W. Lin and H. D. Maynard, J. Am. Chem. Soc., 2014, 136, 14323 CrossRef PubMed.
- R. Konradi, C. Acikgoz and M. Textor, Macromol. Rapid Commun., 2012, 33, 1663 CrossRef CAS PubMed.
- O. Sedlacek, B. D. Monnery, S. K. Fillipov, R. Hoogenboom and M. Hruby, Macromol. Rapid Commun., 2012, 33, 1648 CrossRef CAS PubMed.
- E. A. Mun, C. Hannell, S. E. Rogers, P. Hole, A. C. Williams and V. V. Khutoryanskiy, Langmuir, 2014, 30, 308 CrossRef CAS PubMed.
- I. Bravo-Osuna, D. Teutonico, S. Arpicco, C. Vauthier and G. Ponchel, Int. J. Pharm., 2007, 340, 173 CrossRef CAS PubMed.
- M. N. Ganivada, P. Kumar and R. Shunmugam, RSC Adv., 2015, 5, 50001 RSC.
- S. K. Lai, Y. Y. Wang and J. Hanes, Adv. Drug Deliv. Rev., 2009, 61, 158 CrossRef CAS PubMed.
- J. S. Suk, S. K. Lai, N. J. Boylan, M. R. Dawson, M. P. Boyle and J. Hanes, Nanomedicine, 2011, 6, 365 CrossRef CAS PubMed.
- Q. Xu, N. J. Boylan, S. Cai, B. Miao, H. Patel and J. Hanes, J. Controlled Release, 2013, 170, 279 CrossRef CAS PubMed.
- J. A. Gallego-Urrea, J. Tuoriniemi and M. Hassellöv, Trends Anal. Chem., 2011, 30, 473 CrossRef CAS PubMed.
- A. Tuteja, M. E. Mackay, S. Narayanan, S. Asokan and M. S. Wong, Nano Lett., 2007, 7, 1276 CrossRef CAS PubMed.
- J. Liu, D. Cao and L. Zhang, J. Phys. Chem. C, 2008, 112, 6653 CAS.
- I. A. Sogias, A. C. Williams and V. V. Khutoryanskiy, Biomacromolecules, 2008, 9, 1837 CrossRef CAS PubMed.
- N. A. Fefelova, Z. S. Nurkeeva, G. A. Mun and V. V. Khutoryanskiy, Int. J. Pharm., 2007, 339, 25 CrossRef CAS PubMed.
- H. Wei and C. Yu, Biomater. Sci., 2015, 3, 1050–1060 RSC.
- K. Lava, B. Verbraeken and R. Hoogenboom, Eur. Polym. J., 2015, 65, 98 CrossRef CAS PubMed.
- J. Ulbricht, R. Jordan and R. Luxenhofer, Biomaterials, 2014, 35, 4848 CrossRef CAS PubMed.
Footnote |
| † Electronic supplementary information (ESI) available. See DOI: 10.1039/c5nr03178h |
| This journal is © The Royal Society of Chemistry 2015 |