 Open Access Article
Creative Commons Attribution 3.0 Unported Licence
Nanoparticle shape anisotropy and photoluminescence properties: Europium containing ZnO as a Model Case†
Melanie
Gerigk
a,
Philipp
Ehrenreich
a,
Markus R.
Wagner
b,
Ilona
Wimmer
a,
Juan Sebastian
Reparaz
b,
Clivia M.
Sotomayor Torres
bc,
Lukas
Schmidt-Mende
a and
Sebastian
Polarz
*a
aUniversity of Konstanz, Universitaetsstr. 10, 78464 Konstanz, Germany. E-mail: Sebastian.polarz@uni-konstanz.de
bICN2, Catalan Institute of Nanoscience and Nanotechnology, Campus UAB, 08193 Bellaterra, Barcelona, Spain
cCatalan Institution for Research and Advanced Studies ICREA, 08010 Barcelona, Spain
First published on 22nd September 2015
Abstract
The precise control over electronic and optical properties of semiconductor (SC) materials is pivotal for a number of important applications like in optoelectronics, photocatalysis or in medicine. It is well known that the incorporation of heteroelements (doping as a classical case) is a powerful method for adjusting and enhancing the functionality of semiconductors. Independent from that, there already has been a tremendous progress regarding the synthesis of differently sized and shaped SC nanoparticles, and quantum-size effects are well documented experimentally and theoretically. Whereas size and shape control of nanoparticles work fairly well for the pure compounds, the presence of a heteroelement is problematic because the impurities interfere strongly with bottom up approaches applied for the synthesis of such particles, and effects are even stronger, when the heteroelement is aimed to be incorporated into the target lattice for chemical doping. Therefore, realizing coincident shape control of nanoparticle colloids and their doping still pose major difficulties. Due to a special mechanism of the emulsion based synthesis method presented here, involving a gelation of emulsion droplets prior to crystallization of shape-anisotropic ZnO nanoparticles, heteroelements can be effectively entrapped inside the lattice. Different nanocrystal shapes such as nanorods, -prisms, -plates, and -spheres can be obtained, determined by the use of certain emulsification agents. The degree of morphologic alterations depends on the type of incorporated heteroelement Mn+, concentration, and it seems that some shapes are more tolerant against doping than others. Focus was then set on the incorporation of Eu3+ inside the ZnO particles, and it was shown that nanocrystal shape and aspect ratios could be adjusted while maintaining a fixed dopant level. Special PL properties could be observed implying energy transfer from ZnO excited near its band-gap (3.3 eV) to the Eu3+ states mediated by defect luminescence of the nanoparticles. Indications for an influence of shape on photoluminescence (PL) properties were found. Finally, rod-like Eu@ZnO colloids were used as tracers to investigate their uptake into biological samples like HeLa cells. The PL was sufficient for identifying green and red emission under visible light excitation.
Introduction
The direct character of the band structure of certain binary semiconductor compounds is a prerequisite for the occurrence of photoluminescence (PL),1 and these PL properties are vital for some of the advanced applications of semiconductor materials. Presumably the case with the most impact is given by light emitting diodes (LEDs).2,3 In the meantime LEDs have entirely revolutionized lighting technology, and I. Akasaki, H. Amano and S. Nakamura have received the 2014 Nobel Price in physics for their work on the development of blue LEDs containing iso-valence substituted gallium nitrides.4,5 Secondly, because the frequency of the emitted light is a direct consequence of the extension of the band-gap, and the band-gap can be adjusted via particle size due to the quantum size effect, there has been an enormous progress in utilizing PL of colloidal semiconductor nanoparticles (SCNPs), so-called quantum dots, for instance in bio-related applications.6–9 Consequently, there has been substantial activity for two decades regarding the synthesis of SCNPs with various size.10–13Among the various direct semiconductors (e.g. GaN, CdSe, MoS2etc.), zinc oxide (ZnO; Wurtzite structure) has received significant attention. ZnO is unique because it offers a multitude of functional properties and applications together with high availability, low price and the absence of toxicity.14–16 It belongs to the class of wide-gap semiconductors with a direct band gap of 3.37 eV.17 Its semiconducting properties combined with a large exciton binding energy allow for applications in the field of electronics and optoelectronics18 for instance as varistors,19 light-emitting devices,20 thin-film transistors21 or gas sensors.22–24
Interestingly, besides size, there is also an influence of shape on optical properties and in particular PL properties.25–29 Because of the good accessibility of the rod-like morphology,30–32 some interesting studies were published on 1-D II/VI semiconductor nanoparticles. It could be shown, that the band edge emission is related to surface defects,33,34 and that the occurrence of these defects may depend on shape.35 It could also be demonstrated that the persistence of light generated charge carriers becomes prolonged for particles with Wurtzite crystal structure due to the polarity of the particles.36,37 For the synthesis of anisotropically shaped ZnO particles several methods are known, for instance sol–gel,38 modified microemulsion routes,39 and other surfactant assisted methods.40 A nice example was published by McLaren et al. in 2009 about ZnO nanoparticles with rod and plate-like shape.41 The authors noted that plate-like particles displayed an over five times higher activity concerning the photocatalytic decomposition of methylene blue. This was explained by the higher fraction of the polar [001] surface, which is supposedly more active in photocatalysis than the non-polar surfaces. The effect of different faces in ZnO was also observed for different nanoparticles synthesized by forced hydrolysis presented by Hosni et al. in 2014.42 Size and shape influence the materials electronic structure and charge carrier transport rates, which are important for ZnO based dye-sensitized solar cells.42 Regarding photoluminescence and ZnO particle shape, Bacsa et al. have described in 2009 tetrapods, which showed a more intense band-gap UV luminescence compared to spherical particles.43
Doping, respectively the presence of intentionally introduced hetero-elements is desired, because it can significantly extend the functionality of semiconductor nanostructures due to altered electronic, optical or catalytic properties.44–46 Electronic and optical properties of ZnO can be controlled by specific anion or cation substitution in the sub-lattice, hereafter abbreviated as E@ZnO.47–54 Special emphasis should be given here to ZnO nanomaterials doped with rare earth metal ions.55–58 Those materials are promising candidates for potential applications in optical communication,59 field emission displays (FEDs). Tb@ZnO and Yb@ZnO have also been used as phosphors for LEDs.60,61 Eu@ZnO nanorods vertically grown on solid substrates e.g. by electrodeposition could be prepared and the successful incorporation of Eu3+ could be proven by optical measurements.62,63 Nevertheless, the incorporation of large rare earth ions in the ZnO lattice remains challenging because of the large discrepancy between ionic size and charge compared to Zn2+.56,64,65 This might be one reason, why there are only few Eu@ZnO colloidal particles systematically varying in shape or size.66 Such particles would be of high interest as tracers for investigation of nanoparticle uptake into biological matter, e.g. cells.66 Particles with high visibility in fluorescence microscopy are needed, but it is essentially important to ensure low toxicity. Appropriate ZnO particles, could have some obvious advantages over other fluorescent nanoparticles involving toxic elements like Cd2+ and Se2−, which are currently applied as biolabels very frequently.67,68
There was obviously significant progress during the last years concerning the synthesis of SCNPs with different morphologies and some progress in intentional doping of SCNPs.69–73 For instance, spherical tin-doped indium oxide (ITO) nanoparticles were presented by Milliron et al. in 2011,74 and more importantly Gd3+ could be incorporated into NaYF4 nanorods by Wang et al. in 2010.75 One can find some nice studies in the literature, reporting particles differing in shape as a result of the presence of impurity atoms or doping.76 Interesting results were presented by Yang et al., who have investigated the change of morphology caused by the presence of Mg2+ during homogeneous growth of ZnO.77 In 2013 Martucci et al. described Ga-doped ZnO coatings.78 The Ga also had a substantial influence on the shape of the single nanocrystals. The latter papers indicate that shape control is much more difficult to achieve, when it comes to the intentional incorporation of impurities. In this sense, shape control is defined in such a way, that the morphology (size and shape) of a particle can be selected, no matter of what type or degree of doping. The reason for the mentioned difficulties is, that impurities can strongly interfere with the bottom-up methodologies developed for the synthesis of such particles. Compared to particle size distribution, shape is even more prone to the presence of impurities. Therefore, it is an important task to study the preparation and properties of hetero-element containing SCNPs while retaining morphology (size and shape).
Here we apply a special emulsion-based method for the preparation of doped ZnO nanoparticle colloids. This method is already established for the preparation of ZnO nanorods.79,80 Regarding the preparation of doped shape-anisotropic ZnO particles one can expect several advantages over alternative methods like hydrothermal routes, or in high-boiling point solvents at even higher temperatures (resembling hot-injection).81 There is much better control concerning the incorporation of heteroelements, and more importantly it is performed at relatively low temperature. Low temperatures are beneficial, because then thermal energy is by far not high enough to overcome activation barriers for diffusion in the solid-state and this prevents self-purification effects, which have often been observed for other systems.82
We will at first describe the extent of morphological effects induced by the incorporation of different metal cations into the lattice of ZnO nanorods. Then, already concentrating on Eu@ZnO, we will demonstrate that nanocrystal shape can be varied and controlled simultaneous to doping. Finally, shape-dependent optical properties, in particular photoluminescence, is investigated for the Eu@ZnO materials in detail, and the materials are applied as biolabels.
Results and discussion
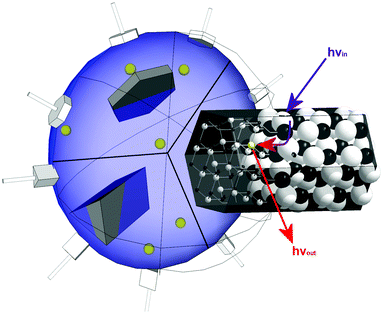
Because these metal cations should be incorporated into the lattice of the particles E@ZnO, we deploy a method, which has been developed by us in 2011.79,80 ZnO is generated in a water-in-oil emulsion via a sol–gel route using a special organometallic precursor system. The mentioned molecular compounds have a heterocubane structure [MeZnOR]4 (with R = alkyl), and precursor properties have been investigated extensively.24,83–88 ZnO formation in the emulsion based method proceeds via solidification of the emulsion droplets as amorphous particles, followed by morphogenesis induced by crystallization.79,80 The described method can easily be applied towards the synthesis of ZnO nanorods (see also ESI-1†). Because of the gelation of the emulsion droplets as a transition state, ions dissolved in the aqueous phase become entrapped inside the particles and are this way incorporated in the ZnO lattice (see Scheme 1).Metal cation incorporation into ZnO nanorods prepared using the emulsion-based method
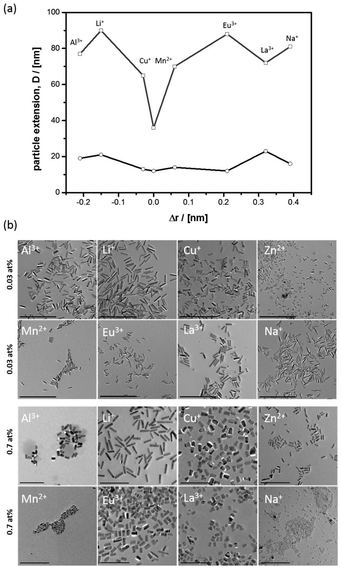
The first important question to answer is, what the morphological effect of cations is, while the crystalline nanorods are forming. Thus, a series of metal cations with an ionic radius smaller (Li+, Al3+),80,89 close to (Cu+, Mn2+)90 or larger (Eu3+, La3+, Na+)62,91 compared to Zn2+ (r = 0.74 Å) were selected and was applied at two different concentrations (χmetal = 0.03% and 0.7%). Furthermore, an experiment was performed with additional Zn2+ dissolved in the emulsion droplets. The anion (Cl−) was kept constant for excluding anion effects on ZnO nanoparticle morphology. The resulting nanoparticle dispersions were investigated by PXRD and TEM; see also ESI-2.† It can be seen that both factors, the difference in ionic radius compared to Zn2+ (Δr) and the concentration, influence particle shape (Fig. 1a).When the mentioned heteroelements are applied at low concentration (χM = 0.03%), one sees that the nanorod shape is obtained in all cases (Fig. 1b). Nonetheless, there are effects. The nanorods become shorter the smaller Δr is. The effects on Dab are much less pronounced. Obviously, ions with similar radius compared to Zn2+ can more effectively bind to the oxygen-terminated polar surface, which then inhibits growth in c-direction. However, these ions similar to Zn2+ (Cu+, Mn2+) can at the same time also interact with the other surfaces (e.g. [100] etc.), and as a result also the Dab extension reduces slightly (see also ESI-3†). The nanorods become very thin. Interestingly, this effect is most pronounced for Zn2+ itself, which by far leads to the shortest and thinnest nanorods in the series (Dc = 36 nm, Dab = 12 nm). We assume that the special effect of Zn2+ cannot be explained by surface interaction alone, but its presence will also affect the supersaturation degree of zinc oxide in the water droplets. Higher supersaturation leads to more critical nuclei, and this results in a larger number of particles remaining small (see ESI-2†).
At higher concentration of the ionic additives (χM = 0.7%) there is still a preference for the rod-like morphology (Fig. 1b), but the rods have become shorter and there is no obvious correlation to Δr anymore. In particular the effect of Na+ is astonishing, because despites a big difference to Zn2+ a majority of extremely small particles are seen, which obviously could not have undergone any extended growth period. One can conclude that the type of cation dissolved in the water droplets of the emulsion and the concentration are important. There are some ions, which are morphologically extremely tolerant like Li+, and other which have strong effect on morphology like Zn2+. The morphological tolerance against Eu3+ is somewhere in the middle, not too strong but also not negligible.
Morphology control for Eu@ZnO materials
Due to our interest in photoluminescence properties altered by nanoparticle shape, focus of the paper is now given to europium containing zinc oxide (Eu@ZnO). Differently shaped Eu@ZnO (χEu = 0.7%) nanoparticles are shown in Fig. 2 and were investigated by transmission electron microscopy (TEM) and additional methods (see ESI-4†). Rods, prisms, plates and spheres one can generate by changing parameters like temperature, ZnO precursor concentration and, most importantly, the emulsification agent. Hexagonal cross-sectioned particles are obtained, when lauric acid was used as the emulsification agent, which indicates that the crystallographic a,b-direction are the main direction of crystal growth (see Fig. 2c). The shape assignment is supported by powder X-ray diffraction (PXRD) shown in the ESI-4iii.† The PXRD pattern shows a higher intensity of signals with pure a and b component (e.g. (100), (110)) and low intensity for signals with c component (e.g. (002), (101)), which means that the particle extension is restricted in c-direction.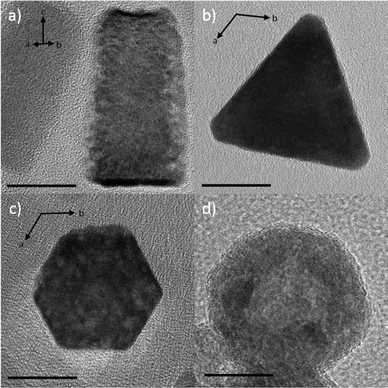 | ||
| Fig. 2 Eu@ZnO particles differing in particle morphology. (a) nanorods, (b) trigonal nanoparticles, (c) nanoplates, (d) spherical particles with hollow character. Scale bars = 20 nm. | ||
The formation of plates can be explained by effective stabilization of the polar faces in ZnO [002]. The carboxylic group of lauric acid can bind to the zinc terminated faces and the oxygen-terminated face is stabilized via protonation. The situation changes, when a polyglyceryl-3-polyricinoleate (≅ P3P) is used as the emulsification agent. Due to the neutral character of the compound there is less tendency to interact with the polar faces. Thus, c becomes the main growth direction. Depending on temperature (see Table 1), respectively depending on reaction kinetics, the interaction of P3P with ZnO differs.
| Morphology | Emulsification agent | Precursor concentration | Temperature |
|---|---|---|---|
| Hexagonal rods | P3P | 0.179 mol L−1 | 55 °C |
| Trigonal rods (prisms) | P3P | 0.239 mol L−1 | 40 °C |
| Plates | Lauric acid | 0.239 mol L−1 | 40 °C |
| Hollow nanospheres | Brij 58 + maltitol | 0.119 mol L−1 | 40 °C |
At lower temperature (40 °C) there is a selective interaction with the [100] lattice plane and its symmetry equivalents ([010], [−110]) leading to a trigonal cross-section of the particles (Fig. 1b). A temperature difference of ΔT = +15 K (see Table 1) is sufficient for overriding this specificity. The particles are still elongated in c-direction (Fig. 2a), but the cross-section changes from trigonal to hexagonal. A mixture of the non-ionic surfactant Brij-58 and the carbohydrate maltitol seem to interact with all possible faces of ZnO, which suppresses growth in all directions. The PXRD pattern (ESI-4ii and ESI-4iii†) shows only low-intensity and very broad signals, which indicate a low crystallinity and very small crystallite sizes (<4 nm). Thus, the formation of a distinct nanoparticle shape is hindered. ZnO formation is restricted to the surface of the emulsion droplet, where the precursor and water react with each other, and as a result one obtains spherical and hollow particles with a shell consisting of numerous small crystallites (Fig. 2d). Closer inspection of the PXRD pattern of this material shown in ESI-4iii† indicated that the walls of those particles are composed of thin Eu@ZnO plates grown mainly in a,b direction, which would fit to the observation that all PXRD signals with c-component have very low intensity.
The particles generated in the absence of Eu3+ look almost identical to pure Eu@ZnO particles prepared under otherwise identical conditions (see ESI-4i†). This shows that, at least at low concentration (c = 0.7 at%), Eu3+ is morphologically inactive. In Fig. 3, the persistence of the rod-like shape depending on Eu3+ concentration was investigated in detail. The sample containing pure ZnO (χEu = 0%) is shown as a reference in ESI-1.† One can see that the pure ZnO nanorods are Dc ≈ 80 nm long with a thickness of Dab ≈ 20 nm, which leads to an aspect ratio of 2.5. As expected there are almost no changes in morphology for a very low content of Eu3+ (χEu = 0.03%; Fig. 3a).
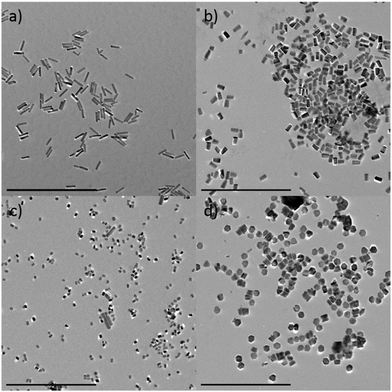 | ||
| Fig. 3 Europium doped ZnO with different doping concentration. χEu = 0.03% (a), χEu = 0.7% (b), χEu = 1.0% (c), χEu = 2% (d). Scale bars = 500 nm. | ||
At χEu = 0.7% the nanorods have become shorter (Dc ≈ 40 nm), whereas the thickness has remained almost the same. The findings are supported by PXRD data shown in ESI-5.† The results indicate that Eu3+ can interact with the polar surfaces of ZnO, which reduces the growth rate in crystallographic c-direction. Consequently, for even higher concentrations (χEu = 1%; 2%) one can switch to the plate-like morphology (Fig. 3c and d; ESI-5ii†). At χEu = 2% the sample consists almost exclusively of plate-like particles with hexagonal cross-section and a fairly narrow size distribution.
At the end of our morphological studies we want to investigate to what extend it is possible to adjust the aspect ratio of the nanorods at constant Eu3+ concentration (χEu = 0.7%). Longer particles can be obtained by increasing the growth-rate while avoiding new particle nucleation. This can be done by carefully adjusting the precursor concentration. At very low precursor concentration the length of the particles is only Dc ≈ 20 nm (Fig. 4c). Because their width has still remained constant Dab ≈ 20 nm, with an aspect ratio of 1, the particles can be interpreted as quasi-spherical. One can precisely adjust the aspect ratio Rc/ab of the Eu@ZnO nanorods in the range 1–2 (see Fig. 4; see also ESI-6†). We could not achieve higher aspect ratios, because a higher precursor concentration leads to additional nucleation, and this results in an extremely polydisperse size distribution.
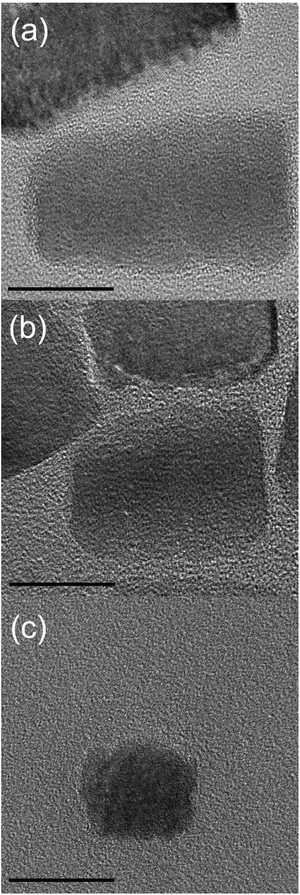 | ||
| Fig. 4 Aspect-ratio adjustment of Eu@ZnO nanorods. TEM micrographs of particles with Dc = 40 nm (a), Dc = 30 nm (b), Dc = 20 nm (c). Scale bars = 20 nm. | ||
Refined analysis of Eu@ZnO nanorods
Following the successful demonstration of the shape-controlled synthesis of Eu@ZnO particles and in particular nanorods up to this point, it becomes important to investigate the structural and compositional properties of the materials in more detail prior to the subsequently conducted optical characterization. The presence of europium and the precise composition of the prepared materials has been determined by ICP-OES (inductively coupled plasma optical emission spectroscopy). The results are summarized in Table 2. It is seen that the amount of europium relates to the amount used during the emulsion-based process, however, slightly less has been incorporated into the materials in the final analysis.| χ Eu (synthesis) | χ Eu (experimental) |
|---|---|
| 0.7 | 0.59 |
| 1.0 | 0.94 |
| 1.5 | 1.15 |
High-resolution (HR) TEM images of Eu@ZnO nanorods in comparison to ZnO nanorods are shown in Fig. 5. One can see that the presence of Eu3+ has not affected the crystallinity of the particles in a negative way. Electron diffraction confirms that each nanorod has single-crystalline character and that the main growth direction is the crystallographic c-axis (see ESI-7†).
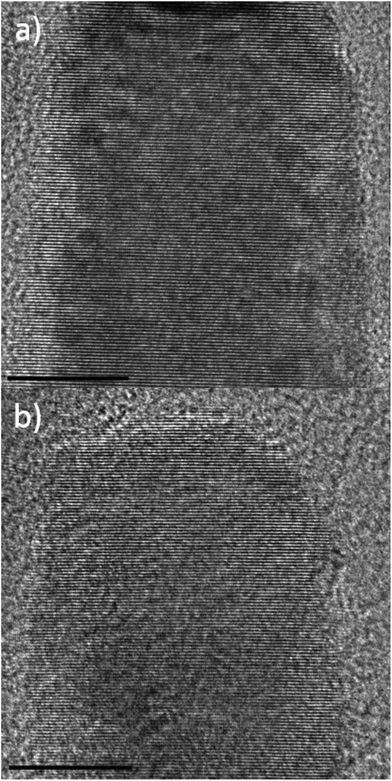 | ||
| Fig. 5 HRTEM images of Eu@ZnO nanorods (χEu = 0.7 at%) (a) and ZnO nanorod (b) as a reference. Scale bars = 10 nm. FFT patterns of ZnO and Eu@ZnO are given in ESI-7 and ESI-1c.† | ||
At this stage, it is important to reveal the microstructure of the materials emphasizing on the successful incorporation of Eu3+ into the ZnO lattice. X-ray photoelectron spectroscopy (XPS) data are shown in ESI-8i.† There is no XPS peak characteristic for Eu2O3 (Eu 4d5/2; E = 129.2 eV)66. One finds a peak at E = 140.5 eV corresponding to the Eu 4d3/2 state.92 This signal indicates the occurrence of one type of Eu3+ with a different Eu–O bonding distance and a different coordination geometry compared to Eu2O3. This result is desired, because the local environment around the cation is expected to be tetrahedral in ZnO, and not octahedral as in Eu2O3. Additional high-resolution XPS spectra were acquired in the Eu 3d region of Eu@ZnO. To our surprise not only a signal of Eu3+ but also of Eu2+ was found in the spectra (see ESI-8i†). The occurrence of Eu2+ is confusing, because the reduction of Eu(III) to Eu(II) is quite unfavorable and Eu(II) is rather oxidized to Eu(III) when water or oxygen are present like in our case.
However, it should be noted that Eu2+ can be seen in XPS spectroscopy as an artifact. For example, Vercaemst et al. observed mixed valence behavior of Eu containing compounds due to inter-configuration fluctuation.93,94 As ultimate proof that there is only Eu3+ (diamagnetic 4f6, 7F0 ground state) present in the sample and not any paramagnetic Eu2+ (4f7, 8S7/2), we recorded electron paramagnetic resonance (EPR) spectra (see ESI-8ii†) of Eu@ZnO and pure ZnO nanorods (as a reference). The spectra of both samples look identical and contain the typical signals from the omnipresent effective mass-like shallow donors and ZnO lattice-site vacancies with g-factors of 1.9594 and 2.0024, respectively.95 Both signals are typical for ZnO and were previously reported also for material prepared via sol–gel from organometallic precursors.96 Most importantly, the existence of Eu2+ can be ruled out since the characteristic signal at g = 4.195 is missing.63
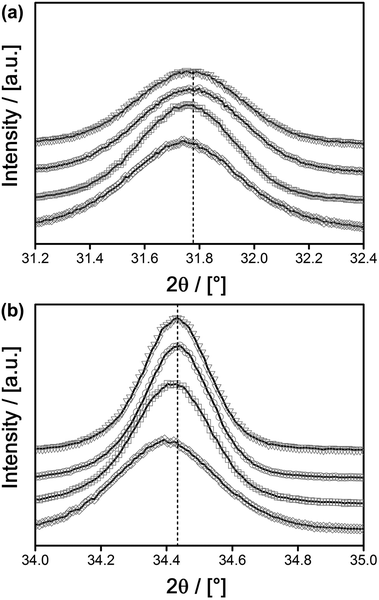
The conclusion that there are no separate phases other than the desired Eu@ZnO was also checked by PXRD (see ESI-5† and Fig. 6). All signals can be assigned to the ZnO Wurtzite phase. It should be noted that PXRD will only detect crystalline constituents. However, amorphous zones would inevitably be seen in TEM due to the much larger number of electrons in Eu compared to Zn and the resulting high imaging contrast in TEM. The missing crystallinity of those zones could be checked by electron diffraction. However, the various TEM data recorded in due course of our study have never indicated the occurrence of such Eu-rich amorphous zones. The successful incorporation of Eu3+ into the ZnO lattice is supported further by closer inspection of the PXRD data. Because Eu3+ is significantly larger than Zn2+, in the case of substitution, one expects a shift of the diffraction signals to smaller angles corresponding to an expansion of the lattice parameters. Of course in the case of χEu < 2% there will be only a small shift in agreement with Vegards rule.97 The shift to smaller angles, respectively the expansion of the lattice, is indeed found and correlates to the concentration of Eu3+ as deduced from ICP-OES (Table 2).
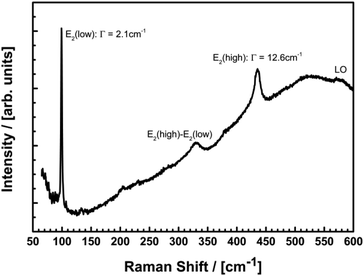
Further information about the microstructure is available from Raman spectroscopy. Fig. 7 shows the micro-Raman spectrum of a Eu@ZnO sample with 0.7 at% Eu3+ excited by the 514 nm line of an Argon-ion laser. The spectrum is dominated by the non-polar E2(low) and E2(high) modes of ZnO at 99.2 cm−1 and 435.4 cm−1, respectively.
Considering the reported pressure dependence of ZnO, one can easily quantify the strain in the samples.98–100 Particularly the frequency shift of the E2(high) is a sensitive tool for strain measurements with a large hydrostatic pressure coefficient of 5.04 cm−1/GPa and a relaxed position of 437.9 cm−1.100 The observed shift of this mode by 2.5 cm−1 in the Eu doped samples corresponds to a tensile stress of 0.5 GPa. This value is in very good agreement with the observed shift of the previously discussed diffraction data and can be explained by the expansion of the ZnO host lattice due to the large ionic radius of the Eu3+ ions. Despite the presence of considerable stress, the crystalline quality of the nanoparticles is not reduced in the Eu doped samples. This is clearly shown by the narrow line width of the E2(low) of 2.1 cm−1 which is comparable to high quality single crystalline ZnO substrates.98 The increased line width of the E2(high) of 12.6 cm−1 is not in contradiction to an excellent structural quality since the line width is expected to increase with tensile stress. This increase is caused by a sharp maximum in the two phonon density of states on the low frequency side of the E2(high) which leads to an anharmonic decay mechanism resulting in an asymmetric broadening of the line shape of this mode.101 The broadening of the Raman spectra for higher europium concentrations (see ESI-9†) indicates a decreasing crystallinity in the high doping regime.63
It can be concluded that there are several, experimental proofs that a significant portion of Eu3+ has been incorporated in the ZnO lattice. However, a partial presence of europium ions at the surface of the particles can neither be excluded nor be quantified. Line-scan EDX spectra taken from one individual nanoparticle were too noisy due to the low concentration below 1%.
Photoluminescence properties of ZnO@Eu nanoparticles with different particle shape
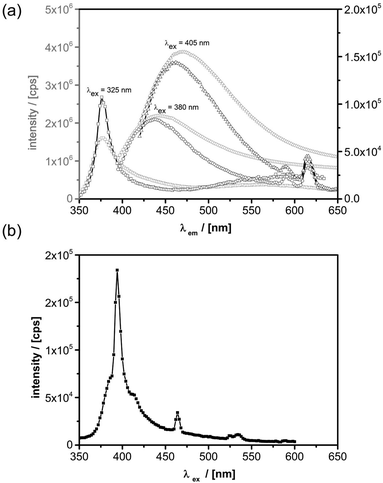
For the discussion of the photoluminescence (PL) properties of the prepared materials, we start with a comparison of the features of geometrically similar nanoparticles with and without Eu incorporation. PL spectra were recorded at room temperature as this is within the temperature range for the most relevant applications. Fig. 8a shows the PL spectra for pure ZnO nanorods and its Eu doped opponents that are recorded for different excitation wavelengths.It can be seen that the most efficient photoluminescence decay channel varies with excitation energy. For an excitation wavelength of 325 nm, larger than the band-gap of ZnO (3.3 eV), the band-edge emission at 376 nm dominates the spectrum apart from a weaker broad luminescence band centered at around 566 nm. The latter is ascribed to defect states lying in the band-gap of ZnO.62,102,103 In addition to the luminescence bands of undoped ZnO, the Eu doped ZnO nanorods reveal several luminescence features of Eu3+ that become visible in the doped material. Those originate from 4f intra-band transitions, namely the 5D0 → 7F1 transition at λ1 = 590 nm and the 5D0 → 7F2 transition at λ2 = 614 nm.62,104 If the sample is excited at 380 nm, i.e. resonantly with the ZnO band-edge, another broad and very intense photoluminescence feature becomes visible with its maximum intensity at around 450 nm. This signal gets even more intense, when the excitation wavelength is further decreased to λem = 405 nm (3.1 eV) and it is red-shifted to λem = 470 nm (2.63 eV). This observation is explained by Zeng et al. with transitions occurring from Zn interstitials and extended Zn interstitials to the valence band maximum of ZnO.102
For excitation energies equal or larger than the band-gap of ZnO it has been shown that a resonant energy transfer from ZnO to Eu3+ can occur.66,104 However, Eu3+ exhibits numerous resonant transitions over a broad range (from the deep infrared to the UV) such that a direct excitation is very likely, especially since the chosen wavelengths are very close to the 7F0 → 5L6 transition of Eu3+ ions.105,106 The possible excitation channels for the dominant λem = 614 nm luminescence line (5D0 → 7F2) of the Eu@ZnO nanorods are shown by the photoluminescence excitation spectrum in Fig. 8b. Beside resonant excitation of the 7F0 → 5D2 transition at 465 nm, there is a very pronounced contribution of a direct 7F0 → 5L6 excitation at 395 nm. This excitation channel is superimposed by a broad excitation band which resembles the ZnO PL spectra with a maximum around 385 nm and a tail expanding beyond 450 nm. Consequently, resonant excitation via ZnO near band edge states and shallow defect states is observed, however, direct excitation of Eu3+ ions via the 7F0 → 5L6 near the band gap of ZnO is found to be highly efficient. In addition, several other excitation channels exist in close proximity to this transition, as it has been shown by Dejneka et al.105,106
Temperature dependent PL spectra with an excitation wavelength of 407 nm are shown in ESI-10i.† The overall luminescence intensity increases with decreasing temperature which is caused by the suppression of non-radiative recombination channels giving rise to more efficient radiative recombinations.62,103,107,108 This reduction of non-radiative decay channels by e.g. suppression of electron – high-frequency phonon scattering might also result in a more efficient energy transfer to the Eu3+ ions as reflected by the intensity increase of the intra-band transitions. In addition, the 5D0 → 7F0 transition at 579 nm and the 5D0 → 7F3 transition at 650 nm become clearly visible in the low temperature spectra.
The electric-dipole transition 5D0 → 7F2 of Eu3+ is very sensitive to the local crystal symmetry and its transition probability is zero if the Eu3+ ions are embedded in a centro-symmetric environment.109 Consequently, the transition at 614 nm should be suppressed in a more homogenous bulk matrix where the ground state level of Eu3+ is higher or equal to the bottom of the CB and the energy transfer can be expected to work less efficiently.104 In contrast to that, the magnetic dipole transition 5D0 → 7F1 at 590 nm is insensitive to the crystal lattice. Therefore, the intensity ratio I(λ614 nm)/I(λ590 nm) of both peaks can be used to locally characterize the incorporation of the Eu ions in the ZnO lattice.110 The smaller the intensity ratio I(λ614 nm)/I(λ590 nm) is, the lower is the distortion of the symmetry around the Eu3+ ions in the ZnO lattice. The dependence of the PL spectra on Eu3+ concentration was investigated from this point of view and the corresponding spectra are shown in ESI-10ii.† Interestingly, the mentioned intensity ratio decreases from 5.6 to 4.8 to 3.5 with increasing europium concentration from 0.7 at% to 1 at% to 2 at%. This means, that an energy transfer can be expected to occur more efficiently in the weakly doped sample even though the overall luminescence of Eu3+ is stronger for higher concentrations due to the presence of more active europium sites. We are currently not able to quantify the efficiency of the energy transfer process, for which more sophisticated time resolved measurements would be required. While this is of minor importance for the here presented study, relevant works addressing this issue are already available in the literature.66,111,112 Instead, our current focus is on the effects of different particle shapes on the photoluminescence properties.
As it has been pointed out above, the dimensions of the distinct nano-geometries are very similar among each other. Thus, we are able to compare the relative photoluminescence contributions of Eu3+ to the ZnO characteristics. From Fig. 9 it can be seen that the general particle shape has a profound impact on optical properties within the range of the Eu3+ signals. For the hollow Eu@ZnO nanoparticles (Fig. 2d) the fluorescence intensity caused by Eu3+ even exceeds the intensity of the defect luminescence, followed by the nanoplates and the nanorods.
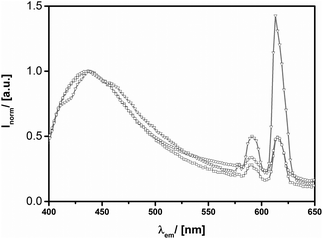 | ||
| Fig. 9 PL spectra (λexc = 380 nm) of Eu@ZnO particles (χ(Eu3+) = 0.7%) with different shapes. (a) Nanorods-(squares), nanoplate-(circles) and hollow sphere-(triangles) morphology. | ||
Obviously the geometry with the lowest surface to volume ratio, the nano-spheres, exhibits the strongest Eu3+ luminescence intensity. This can be seen as an indication that Eu3+ is not only incorporated at the ZnO surface, but especially in the bulk crystal lattice. As discussed above, the influence of the geometry can determine the photoluminescence behavior of ZnO significantly. However, we assume that any changes in the intrinsic photoluminescence properties of Eu3+ are not at all or just weakly affected by the geometry. Despite this reasoning, it is still possible that the incorporated Eu3+ concentration may vary due to the geometry or a change in efficiency of the energy transfer process. PXRD measurements did not indicate strong differences in crystallinity between the investigated geometries for the same dopant concentration. If the incorporation of Eu3+ would be essentially enhanced, one would expect a stronger lattice distortion. Therefore, we conclude that the relative Eu3+ concentration is comparable between the different geometries. Interestingly, also the variation of the aspect ratio has an effect on the optical properties, which is, however, much less pronounced compared to the change of the general morphology (see ESI-10iii†).
Up to this point we could show that the nanocrystal shape has an impact on the optical properties of Eu3+, and it seems that there is a mechanism relating particle shape to the described photoluminescence behavior. A potential explanation, which is consistent with our findings, could be that Eu3+ might occupy two different positions in the ZnO lattice: on tetrahedral sites substituting Zn2+ (EuZn˙) or on interstitial, octahedral sites (Eui˙). Because the octahedral sites are centro-symmetric, their allocation would lead to a decrease of the signal at 614 nm. However, with the analytical methods presented here, we cannot differentiate between these two potential Eu3+ centers. Because the wurtzite lattice is highly asymmetric, one can imagine that differences in the main growth-direction of a particle could lead to differences in the occupation probability of heteroatoms on the available lattice sites.
Application of ZnO@Eu nanorods as biomarkers
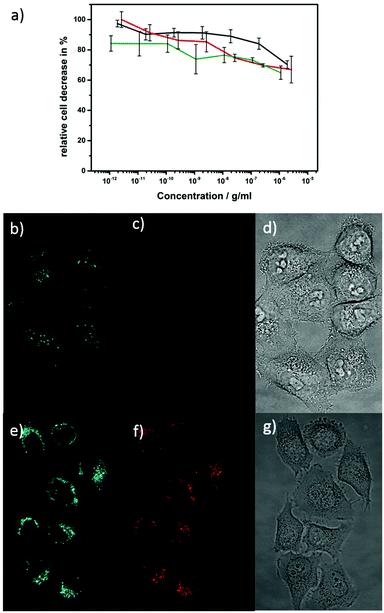
ZnO materials with strong photoluminescence properties are desirable candidates for labeling in biological experiments since these materials are non-toxic and biocompatible compared to toxic quantum dots. In opposition to that poor water stability, limited color convertibility and low intensity of doped ZnO materials make it an unrealized material for labeling experiments despite of its low-cost and high compatibility. In most cases synthesized nanoparticles are stable in organic solvents but not in water and tend to aggregate or even degrade when transferred into a solvent for use in biological applications.113 We developed a synthesis approach that instantly provides ZnO nanoparticles that are stable and dispersible in cell media (DMSO/water) in the μg range, when P3P as surfactant is present. The surfactant P3P is also crucial for controlling the particle shape, and prevents degradation of nanoparticles during cell uptake. Smith et al. and Wilson et al. have investigated the surfactant P3P in numerous studies in both rats and humans and it has shown no harmful effect.114–116 P3P is also a common emulsifier in cosmetic formulations.This non-toxic behavior of P3P in combination with europium doped ZnO nanorods is confirmed in a cell cytotoxicity test (Fig. 10a). The cytotoxicity was investigated by AlamarBlue assays due to its high sensitivity compared to conventional MTT (3-(4,5-dimethylthiazol-2-yl)-2,5-diphenhyltetrazolium bromide) assays. The non-fluorescent dark blue dye is reduced by living cells to a pink highly fluorescent resurufin (7-hydroxy-3H-phenoxazin-3-one). The ZnO and Eu@ZnO materials (χEu = 0.3, 0.7%) have no significant influence on the cells metabolic activity since the detected signal correlates to the active cells that can convert the reagent into a fluorescent indicator. Due to the low toxicity it was even not possible to determine a LD50 dose. Fluorescent imaging was performed on Eu@ZnO with χEu = 0.7 at% and a length of 40 nm (Fig. 10b–g)). In Fig. 10b and e fluorescent images are shown of HeLa cells excited under a single wavelength of 405 nm after one day of incubation. Emission for green and red is detectable for low concentrations. The Eu@ZnO material itself has a higher intensity compared to that of the green auto-fluorescence of HeLa cells.
Due to the P3P surfactant, the nanoparticles are stable in the feeding medium of the cells and were taken up by the cells.
After the nanoparticles were taken up in the cells they were still stable, otherwise no red detection signal in the cells would be detectable. As soon as the nanoparticles are ingested by the cells, the P3P does no longer protect nanoparticles from aggregation because aggregated Eu@ZnO can be seen on the fluorescence images. The transmission images of the HeLa cells are still in a good condition although they have been exposed to external stress. The luminescent qualities of the sample materials demonstrated that concentrations of 0.7 at% of europium in ZnO material are sufficient to give an adequate signals. Further investigations should aim on the dispensability of nanoparticles in the cells.
Conclusions
An emulsion-based method was used for the preparation of various heterobimetallic zinc oxide nanoparticles with different shape. An organometallic precursor dissolved in the organic phase reacts at the oil-water interface of the emulsion droplets resulting in the formation of ZnO particles. Metal cations dissolved in the aqueous phase become entrapped inside the solidifying matrix. Because the process is performed at low temperature (≈r.t.) these elements become incorporated inside the ZnO lattice (Scheme 1). Control over particle shape (nanorods, nanoprisms, nanoplates, hollow particles) could be achieved via different emulsification agents, which obviously control the main growth direction of ZnO (Scheme 1). The metal cations present exhibit morphologic effects as, the stronger the more their ionic radius differs from Zn2+ and the higher their concentration is.Eu3+ was selected as an example to show that the incorporation of a functional metal cation and simultaneous shape control is possible. The successful substitution of Zn2+ by Eu3+ in the lattice was proven by a combination of methods including XPS, HRTEM/EDX, PXRD and micro-Raman spectroscopy. In addition, the optical, photoluminescence properties of the materials were investigated in detail. Although excited in the UV one could observe rather strong emission of Eu3+ in the red spectral region. The latter together with the very low toxicity of the particles, allowed to study their uptake in biological cells.
Materials and methods
All starting compounds were purchased from Aldrich and Roth, and were purified and dried prior to use. All reactions were performed using Schlenk technique.The zinc oxide precursor was prepared according to synthesis procedures reported in literature.117
General preparation of ZnO and doped ZnO nanorods
The emulsion is prepared by water (1.5 ml), cyclohexane (35 ml) and the surfactant (P3P, 1 g) and applying ultrasound for 20 min. For the dopant containing ZnO nanorods, additionally the dopant was added to the aqueous phase. The zinc oxide precursor (1 g) is dissolved in dry cyclohexane (10 ml). At the designed temperature (55 °C), the [MeZnOiPr]4 is added drop-wise by a syringe pump to the emulsion. During the addition, ultrasonic is continued for 375 min. The final colloids were isolated by removing the solvent under reduced pressure.Cell cytotoxicity
HeLa cells were cultivated at 37 °C and 5% CO2 atmosphere in DMEM medium (Gibco) with 10% FCS (Biochrome AG) and 1% Pen/Strep (Gibco). 96-well plates were used for the cell assay. After 24 h cells were incubated with ZnO materials. Substances to be tested were prepared by serial dilution with medium given to a final concentration with a maximum DMSO content of 1%. The cells were incubated for 48 h with 100 μL each of the diluted series.10 μL AlamarBlue solution (BioSource Europe) diluted with 90 μL DMEM medium was added directly after removal of the solvent. Incubation time was 90 min. Fluorescence signal at 590 nm of resurufin was measured under an excitation of 530 nm with a Synergy HT Microplate Reader (BioTek). Cells viability was expressed in percent with respect to a control group containing only pure medium and 1% DMSO incubated under identical conditions.
Fluorescent properties of nanorods
HeLa cells were seeded in Ibidi plates for spectroscopic purpose with a concentration of 2 × 10⁴ cells per well in DMEM medium (10% FCS and 1% Pen/Strep) and incubated for 24 h at 37 °C and 5% CO2 atmosphere. After 24 h the medium was removed and the cells were incubated in the culture medium containing substances to be tested for another 24 h. The fluorescent images were taken without further purification at a confocal laser scanning microscope.Characterization methods
X-ray diffractions were performed on a Bruker AXS D8 Advance diffractometer using CuKα radiation. The UV/Vis measurements were conducted on a Varian Cary 100 scan UV/Vis spectrophotometer equipped with an Ulbricht reflecting sphere. HRTEM images were acquired on a JEOL, JEM 2200FS at an accelerating voltage of 200 kV. XPS measurements were performed on equipment with a dual anode Al/Mg Kα X-ray source from VG Microtech and a cyclindrical hemispherical analyser from Omicron (EA 125). The Mg Kα (photon energy 1253.6 eV) was used for measurements. The elemental analysis was conducted at an Agilent 720/725 ICP-OES. The concentration was determined by europium emission lines at 420.5 nm, 397.2 nm and 381.9 nm. For room-temperature PL measurements a Horiba Fluorolog-3 FL3-122 has been used which is equipped with a Xe 450 W excitation source. Both the excitation and emission light path consist of a double-grating monochromator in order to enhance resolution and sensitivity for an appropriate wavelength. The photoluminescence of the sample is detected by a Hamamatsu photomultiplier tube R928P.Micro-Raman measurements were performed using a Horiba Jobin Yvon T64000 setup with a nitrogen cooled CCD. The samples were excited by the 350 nm and 407 nm laser lines of a Krypton gas laser and the 488 and 514 nm lines of a Argon ion laser using a 10× microscope objective with an excitation power below 500 μW to avoid heating. For Raman measurements, a SNI Confocal Raman Spectrometer of the type Monovista CRS 750 HR/BX51EI has been used. The excitation wavelength was a 487.8 nm ± 0.04% laser.
Fluorescent images were collected at a Leica confocal laser scanning TCS SP5 microscope with an excitation wavelength of 405 nm at 30% UV light. Emission was detected in a range from 415–450 nm and 600–650 nm. The images were processed with ImageJ. The fluorescent signal of AlamarBlue reagent was readout with a Synergy HT from BioTek at an excitation wavelength of 530 nm and fluorescent signal was detected at 590 m. Obtained data was utilized with Gen5.
Acknowledgements
The Carl-Zeiss foundation is gratefully acknowledged for funding (REFINE project). M.R.W. acknowledges support from the postdoctoral Marie Curie Fellowship (IEF) HeatProNano (Grant No. 628197). ICN2 acknowledges support from the Spanish MICINN projects TAPHOR (Grant MAT2012-31392), nanoTHERM (Grant No. CSD2010-0044) and the Severo Ochoa Program (MINECO, Grant SEV-2013-0295). We thank Malin Bein for assistance with the cell experiments.Notes and references
- A. D. Yoffe, Adv. Phys., 2001, 50, 1–208 CrossRef CAS PubMed.
- H. Morkoc, S. Strite, G. B. Gao, M. E. Lin, B. Sverdlov and M. Burns, J. Appl. Phys, 1994, 76, 1363–1398 CrossRef CAS PubMed.
- Ü. Özgür, Y. I. Alivov, C. Liu, A. Teke, M. A. Reshchikov, S. Doğan, V. Avrutin, S.-J. Cho and H. Morkoç, J. Appl. Phys., 2005, 98 CrossRef PubMed , 041301.
- H. Amano, N. Sawaki, I. Akasaki and Y. Toyoda, Appl. Phys. Lett., 1986, 48, 353–355 CrossRef CAS PubMed.
- S. Nakamura, T. Mukai and M. Senoh, Appl. Phys. Lett., 1994, 64, 1687–1689 CrossRef CAS PubMed.
- A. P. Alivisatos, Science, 1996, 271, 933–937 CAS.
- M. Bruchez, M. Moronne, P. Gin, S. Weiss and A. P. Alivisatos, Science, 1998, 281, 2013–2016 CrossRef CAS.
- X. Michalet, F. F. Pinaud, L. A. Bentolila, J. M. Tsay, S. Doose, J. J. Li, G. Sundaresan, A. M. Wu, S. S. Gambhir and S. Weiss, Science, 2005, 307, 538–544 CrossRef CAS PubMed.
- I. L. Medintz, H. T. Uyeda, E. R. Goldman and H. Mattoussi, Nat. Mater., 2005, 4, 435–446 CrossRef CAS PubMed.
- J. Park, J. Joo, S. G. Kwon, Y. Jang and T. Hyeon, Angew. Chem., Int. Ed., 2007, 46, 4630–4660 CrossRef CAS PubMed.
- M. A. El-Sayed, Acc. Chem. Res., 2004, 37, 326–333 CrossRef CAS PubMed.
- C. Burda, X. B. Chen, R. Narayanan and M. A. El-Sayed, Chem. Rev., 2005, 105, 1025–1102 CrossRef CAS PubMed.
- S. Polarz, Adv. Funct. Mater., 2011, 21, 3214–3230 CrossRef CAS PubMed.
- Z. L. Wang, J. Phys.: Condens. Matter, 2004, 16, R829–R858 CrossRef CAS.
- Z. L. Wang, Mater. Today, 2004, 7, 26–33 CrossRef CAS.
- A. Janotti and C. G. Van de Walle, Rep. Prog. Phys., 2009, 72, 29 CrossRef.
- U. Ozgur, Y. I. Alivov, C. Liu, A. Teke, M. A. Reshchikov, S. Dogan, V. Avrutin, S. J. Cho and H. Morkoc, J. Appl. Phys., 2005, 98 Search PubMed.
- C. Klingshirn, Phys. Status Solidi B, 2007, 244, 3027–3073 CrossRef CAS PubMed.
- G. D. Mahan, L. M. Levinson and H. R. Philipp, J. Appl. Phys., 1979, 50, 2799–2812 CrossRef CAS PubMed.
- Y. S. Choi, J. W. Kang, D. K. Hwang and S. J. Park, IEEE Trans. Electron Devices, 2010, 57, 26–41 CrossRef CAS.
- R. L. Hoffman, B. J. Norris and J. F. Wager, Appl. Phys. Lett., 2003, 82, 733–735 CrossRef CAS PubMed.
- Q. Wan, Q. H. Li, Y. J. Chen, T. H. Wang, X. L. He, J. P. Li and C. L. Lin, Appl. Phys. Lett., 2004, 84, 3654–3656 CrossRef CAS PubMed.
- S. Polarz, A. Roy, M. Lehmann, M. Driess, F. E. Kruis, A. Hoffmann and P. Zimmer, Adv. Funct. Mater., 2007, 17, 1385–1391 CrossRef CAS PubMed.
- S. Dilger, C. Lizandara-Pueyo, M. Krumm and S. Polarz, Adv. Mater., 2012, 24, 543–548 CrossRef CAS PubMed.
- J. N. Shan, M. Uddi, R. Wei, N. Yao and Y. G. Ju, J. Phys. Chem. C, 2010, 114, 2452–2461 CAS.
- S. Kim, S. W. Hwang, M. K. Kim, D. Y. Shin, D. H. Shin, C. O. Kim, S. B. Yang, J. H. Park, E. Hwang, S. H. Choi, G. Ko, S. Sim, C. Sone, H. J. Choi, S. Bae and B. H. Hong, ACS Nano, 2012, 6, 8203–8208 CrossRef CAS PubMed.
- F. Zhang, J. Li, J. Shan, L. Xu and D. Y. Zhao, Chem. – Eur. J., 2009, 15, 11010–11019 CrossRef CAS PubMed.
- W. S. Chae, E. Choi, Y. K. Jung, J. S. Jung and J. K. Lee, Appl. Phys. Lett., 2014, 104, 3 CrossRef PubMed.
- X. Y. Wang, X. F. Ren, K. Kahen, M. A. Hahn, M. Rajeswaran, S. Maccagnano-Zacher, J. Silcox, G. E. Cragg, A. L. Efros and T. D. Krauss, Nature, 2009, 459, 686–689 CrossRef CAS PubMed.
- Y. Yin and A. P. Alivisatos, Nature, 2005, 437, 664–670 CrossRef CAS PubMed.
- X. G. Peng, L. Manna, W. D. Yang, J. Wickham, E. Scher, A. Kadavanich and A. P. Alivisatos, Nature, 2000, 404, 59–61 CrossRef CAS PubMed.
- Y. N. Xia, P. D. Yang, Y. G. Sun, Y. Y. Wu, B. Mayers, B. Gates, Y. D. Yin, F. Kim and Y. Q. Yan, Adv. Mater., 2003, 15, 353–389 CrossRef CAS PubMed.
- A. E. Saunders, A. Ghezelbash, P. Sood and B. A. Korgel, Langmuir, 2008, 24, 9043–9049 CrossRef CAS PubMed.
- L.-s. Li, J. Hu, W. Yang and A. P. Alivisatos, Nano Lett., 2001, 1, 349–351 CrossRef CAS.
- T. Andelman, Y. Gong, M. Polking, M. Yin, I. Kuskovsky, G. Neumark and S. O'Brien, J. Phys. Chem. B, 2005, 109, 14314–14318 CrossRef CAS PubMed.
- A. Layek, B. Manna and A. Chowdhury, Chem. Phys. Lett., 2012, 539–540, 133–138 CrossRef CAS PubMed.
- S. Dilger, M. Wessig, M. R. Wagner, J. S. Reparaz, C. M. S. Torres, Q. J. Liang, T. Dekorsy and S. Polarz, Cryst. Growth Des., 2014, 14, 4593–4601 CAS.
- J. Joo, S. G. Kwon, J. H. Yu and T. Hyeon, Adv. Mater., 2005, 17, 1873–1877 CrossRef CAS PubMed.
- L. Guo, Y. L. Ji, H. Xu, P. Simon and Z. Wu, J. Am. Chem. Soc., 2002, 124, 14864–14865 CrossRef CAS PubMed.
- J. Xie, P. Li, Y. Wang and Y. Wei, Phys. Status Solidi A, 2008, 205, 1560–1565 CrossRef CAS PubMed.
- A. McLaren, T. Valdes-Solis, G. Li and S. C. Tsang, J. Am. Chem. Soc., 2009, 131, 12540–12541 CrossRef CAS PubMed.
- M. Hosni, Y. Kusumawati, S. Farhat, N. Jouini and T. Pauporté, J. Phys. Chem. C, 2014, 118, 16791–16798 CAS.
- R. R. Bacsa, J. Dexpert-Ghys, M. Verelst, A. Falqui, B. Machado, W. S. Bacsa, P. Chen, S. M. Zakeeruddin, M. Graetzel and P. Serp, Adv. Funct. Mater., 2009, 19, 875–886 CrossRef CAS PubMed.
- V. Kumar, N. Singh, V. Kumar, L. P. Purohit, A. Kapoor, O. M. Ntwaeaborwa and H. C. Swart, J. Appl. Phys., 2013, 114, 134506 CrossRef PubMed.
- Y. Zhang, Y. Yang, J. Zhao, R. Tan, W. Wang, P. Cui and W. Song, J. Mater. Sci., 2011, 46, 774–780 CrossRef CAS.
- A. S. Pereira, M. Peres, M. J. Soares, E. Alves, A. Neves, T. Monteiro and T. Trindade, Nanotechnology, 2006, 17, 834 CrossRef CAS.
- H. von Wenckstern, H. Schmidt, M. Brandt, A. Lajn, R. Pickenhain, M. Lorenz, M. Grundmann, D. M. Hofmann, A. Polity, B. K. Meyer, H. Saal, M. Binnewies, A. Borger, K. D. Becker, V. A. Tikhomirov and K. Jug, Prog. Solid State Chem., 2009, 37, 153–172 CrossRef CAS PubMed.
- A. Sanchez-Juarez, A. Tiburcio-Silver and A. Ortiz, Sol. Energy Mater. Sol. Cells, 1998, 52, 301–311 CrossRef CAS.
- H. Y. Xu, Y. C. Liu, R. Mu, C. L. Shao, Y. M. Lu, D. Z. Shen and X. W. Fan, Appl. Phys. Lett., 2005, 86 Search PubMed.
- D. H. Zhang, T. L. Yang, J. Ma, Q. P. Wang, R. W. Gao and H. L. Ma, Appl. Surf. Sci., 2000, 158, 43–48 CrossRef CAS.
- J. Lee, D. Lee, D. Lim and K. Yang, Thin Solid Films, 2007, 515, 6094–6098 CrossRef CAS PubMed.
- T. Minami, Thin Solid Films, 2008, 516, 1314–1321 CrossRef CAS PubMed.
- D. Lehr, M. Luka, M. R. Wagner, M. Bulger, A. Hoffmann and S. Polarz, Chem. Mater., 2012, 24, 1771–1778 CrossRef CAS.
- J. Cho, Q. B. Lin, S. Yang, J. G. Simmons, Y. W. Cheng, E. Lin, J. Q. Yang, J. V. Foreman, H. O. Everitt, W. T. Yang, J. Kim and J. Liu, Nano Res., 2012, 5, 20–26 CrossRef CAS.
- T. Minami, T. Yamamoto and T. Miyata, Thin Solid Films, 2000, 366, 63–68 CrossRef CAS.
- X. Zeng, J. Yuan and L. Zhang, J. Phys. Chem. C, 2008, 112, 3503–3508 CAS.
- R. P. Davies, C. R. Abernathy, S. J. Pearton, D. P. Norton, M. P. Ivill and F. Ren, Chem. Eng. Commun., 2009, 196, 1030–1053 CrossRef CAS PubMed.
- S. Bachir, C. Sandouly, J. Kossanyi and J. C. Ronfard-Haret, J. Phys. Chem. Solids, 1996, 57, 1869–1879 CrossRef CAS.
- A. Manekkathodi, M.-Y. Lu, C. W. Wang and L.-J. Chen, Adv. Mater., 2010, 22, 4059–4063 CrossRef CAS PubMed.
- V. Kumar, S. Som, V. Kumar, V. Kumar, O. M. Ntwaeaborwa, E. Coetsee and H. C. Swart, Chem. Eng. J., 2014, 255, 541–552 CrossRef CAS PubMed.
- G. L. Kabongo, G. H. Mhlongo, B. M. Mothudi, K. T. Hillie, H. C. Swart and M. S. Dhlamini, Mater. Lett., 2014, 119, 71–74 CrossRef CAS PubMed.
- D. Wang, G. Xing, M. Gao, L. Yang, J. Yang and T. Wu, J. Phys. Chem. C, 2011, 115, 22729–22735 CAS.
- O. Lupan, T. Pauporté, B. Viana, P. Aschehoug, M. Ahmadi, B. R. Cuenya, Y. Rudzevich, Y. Lin and L. Chow, Appl. Surf. Sci., 2013, 282, 782–788 CrossRef CAS PubMed.
- Y. M. Yang, H. Lai, H. T. Xu, C. Y. Tao and H. Yang, J. Nanopart. Res., 2010, 12, 217–225 CrossRef CAS.
- R. Zamiri, A. F. Lemos, A. Reblo, H. A. Ahangar and J. M. F. Ferreira, Cer. Int., 2014, 40, 523–529 CrossRef CAS PubMed.
- Y.-P. Du, Y.-W. Zhang, L.-D. Sun and C.-H. Yan, J. Phys. Chem. C, 2008, 112, 12234–12241 CAS.
- F. Wang, W. B. Tan, Y. Zhang, X. P. Fan and M. Q. Wang, Nanotechnology, 2006, 17, R1–R13 CrossRef CAS.
- R. C. Somers, M. G. Bawendi and D. G. Nocera, Chem. Soc. Rev., 2007, 36, 579–591 RSC.
- P. K. Santra and P. V. Kamat, J. Am. Chem. Soc., 2012, 134, 2508–2511 CrossRef CAS PubMed.
- A. M. Smith and S. M. Nie, Acc. Chem. Res., 2010, 43, 190–200 CrossRef CAS PubMed.
- S. C. Erwin, L. J. Zu, M. I. Haftel, A. L. Efros, T. A. Kennedy and D. J. Norris, Nature, 2005, 436, 91–94 CrossRef CAS PubMed.
- D. V. Talapin and C. B. Murray, Science, 2005, 310, 86–89 CrossRef CAS PubMed.
- P. Simon and Y. Gogotsi, Nat. Mater., 2008, 7, 845–854 CrossRef CAS PubMed.
- G. Garcia, R. Buonsanti, E. L. Runnerstrom, R. J. Mendelsberg, A. Llordes, A. Anders, T. J. Richardson and D. J. Milliron, Nano Lett., 2011, 11, 4415–4420 CrossRef CAS PubMed.
- F. Wang, Y. Han, C. S. Lim, Y. H. Lu, J. Wang, J. Xu, H. Y. Chen, C. Zhang, M. H. Hong and X. G. Liu, Nature, 2010, 463, 1061–1065 CrossRef CAS PubMed.
- R. Viswanatha, D. M. Battaglia, M. E. Curtis, T. D. Mishima, M. B. Johnson and X. G. Peng, Nano Res., 2008, 1, 138–144 CrossRef CAS.
- Y. F. Yang, Y. Z. Jin, H. P. He, Q. L. Wang, Y. Tu, H. M. Lu and Z. Z. Ye, J. Am. Chem Soc, 2010, 132, 13381–13394 CrossRef CAS PubMed.
- E. Della Gaspera, M. Bersani, M. Cittadini, M. Guglielmi, D. Pagani, R. Noriega, S. Mehra, A. Salleo and A. Martucci, J. Am. Chem. Soc., 2013, 135, 3439–3448 CrossRef PubMed.
- C. Lizandara-Pueyo, S. Siroky, M. R. Wagner, A. Hoffmann, J. S. Reparaz, M. Lehmann and S. Polarz, Adv. Funct. Mater., 2011, 21, 295–304 CrossRef CAS PubMed.
- C. Lizandara-Pueyo, S. Dilger, M. R. Wagner, M. Gerigk, A. Hoffmann and S. Polarz, CrystEngComm, 2014, 16, 1525–1531 RSC.
- Y. F. Chen, M. Kim, G. Lian, M. B. Johnson and X. G. Peng, J. Am. Chem. Soc., 2005, 127, 13331–13337 CrossRef CAS PubMed.
- G. M. Dalpian and J. R. Chelikowsky, Phys. Rev. Lett., 2006, 96, 4 CrossRef.
- S. Polarz, J. Strunk, V. Ischenko, M. W. E. van den Berg, O. Hinrichsen, M. Muhler and M. Driess, Angew. Chem., Int. Ed., 2006, 45, 2965–2969 CrossRef CAS PubMed.
- S. Polarz, A. V. Orlov, F. Schuth and A. H. Lu, Chem. – Eur. J., 2007, 13, 592–597 CrossRef CAS PubMed.
- S. Polarz, A. Orlov, A. Hoffmann, M. R. Wagner, C. Rauch, R. Kirste, W. Gehlhoff, Y. Aksu, M. Driess, M. W. E. van den Berg and M. Lehmann, Chem. Mater., 2009, 21, 3889–3897 CrossRef CAS.
- M. Krumm, C. L. Pueyo and S. Polarz, Chem. Mater., 2010, 22, 5129–5136 CrossRef CAS.
- C. L. Pueyo, S. Siroky, S. Landsmann, M. W. E. van den Berg, M. R. Wagner, J. S. Reparaz, A. Hoffmann and S. Polarz, Chem. Mater., 2010, 22, 4263–4270 CrossRef.
- C. Lizandara-Pueyo, M. C. Morant-Minana, M. Wessig, M. Krumm, S. Mecking and S. Polarz, RSC Adv., 2012, 2, 5298–5306 RSC.
- R. Buonsanti, A. Llordes, S. Aloni, B. A. Helms and D. J. Milliron, Nano Lett., 2011, 11, 4706–4710 CrossRef CAS PubMed.
- B. Panigrahy, M. Aslam and D. Bahadur, J. Phys. Chem. C, 2010, 114, 11758–11763 CAS.
- L. Lu, R. Li, T. Peng, K. Fan and K. Dai, Renewable Energy, 2011, 36, 3386–3393 CrossRef CAS PubMed.
- P. Mohanty, B. Kim and J. Park, Mater. Sci. Eng., B, 2007, 138, 224–227 CrossRef CAS PubMed.
- R. Vercaemst, D. Poelman, L. Fiermans, R. L. Van Meirhaeghe, W. H. Laflère and F. Cardon, J. Electron Spectrosc. Relat. Phenom., 1995, 74, 45–56 CrossRef CAS.
- R. Vercaemst, D. Poelman, R. L. Van Meirhaeghe, L. Fiermans, W. H. Laflère and F. Cardon, J. Lumin., 1995, 63, 19–30 CrossRef CAS.
- C. F. Klingshirn, A. Waag, A. Hoffmann and J. Geurts, Zinc Oxide: From Fundamental Properties Towards Novel Applications, Springer, Berlin, Heidelberg, 2010 Search PubMed.
- V. Ischenko, S. Polarz, D. Grote, V. Stavarache, K. Fink and M. Driess, Adv. Funct. Mater., 2005, 15, 1945–1954 CrossRef CAS PubMed.
- A. R. Denton and N. W. Ashcroft, Phys. Rev. A, 1991, 43, 3161–3164 CrossRef CAS.
- J. S. Reparaz, L. R. Muniz, M. R. Wagner, A. R. Goñi, M. I. Alonso, A. Hoffmann and B. K. Meyer, Appl. Phys. Lett., 2010, 96, 231906 CrossRef PubMed.
- G. Callsen, J. S. Reparaz, M. R. Wagner, R. Kirste, C. Nenstiel, A. Hoffmann and M. R. Phillips, Appl. Phys. Lett., 2011, 98, 061906 CrossRef PubMed.
- M. R. Wagner, G. Callsen, J. S. Reparaz, R. Kirste, A. Hoffmann, A. V. Rodina, A. Schleife, F. Bechstedt and M. R. Phillips, Phys. Rev. B: Condens. Matter, 2013, 88, 235210 CrossRef.
- J. Serrano, F. J. Manjón, A. H. Romero, F. Widulle, R. Lauck and M. Cardona, Phys. Rev. Lett., 2003, 90, 055510 CrossRef CAS.
- H. Zeng, G. Duan, Y. Li, S. Yang, X. Xu and W. Cai, Adv. Funct. Mater., 2010, 20, 561–572 CrossRef CAS PubMed.
- A. Ishizumi and Y. Kanemitsu, Appl. Phys. Lett., 2005, 86, 253106 CrossRef PubMed.
- X. Zeng, J. Yuan, Z. Wang and L. Zhang, Adv. Mater., 2007, 19, 4510–4514 CrossRef CAS PubMed.
- A. Kumar and J. Kumar, J. Mater. Chem., 2011, 21, 3788–3795 RSC.
- M. Dejneka, E. Snitzer and R. E. Riman, J. Lumin., 1995, 65, 227–245 CrossRef CAS.
- A. van Dijken, E. A. Meulenkamp, D. Vanmaekelbergh and A. Meijerink, J. Phys. Chem. B, 2000, 104, 1715–1723 CrossRef CAS.
- H. B. Ye, J. F. Kong, W. Z. Shen, J. L. Zhao and X. M. Li, J. Phys. D, 2007, 40, 5588 CrossRef CAS.
- Z. Yongzhe, L. Yanping, W. Lihui, X. Erqing and C. Jiangtao, J. Phys. D: Appl. Phys., 2009, 42, 085106 CrossRef.
- Y. Liu, W. Luo, R. Li, G. Liu, M. R. Antonio and X. Chen, J. Phys. Chem. C, 2008, 112, 686–694 CAS.
- G. Gao, S. Reibstein, M. Peng and L. Wondraczek, J. Mater. Chem., 2011, 21, 3156–3161 RSC.
- W. Jia, K. Monge and F. Fernandez, Opt. Mater., 2003, 23, 27–32 CrossRef CAS.
- X. Tang, E. S. G. Choo, L. Li, J. Ding and J. Xue, Chem. Mater., 2010, 22, 3383–3388 CrossRef CAS.
- M. R. Smith, R. Wilson and P. A. Hepburn, Food Chem. Toxicol., 1998, 36, 747–754 CrossRef CAS.
- R. Wilson, B. J. van Schie and D. Howes, Food Chem. Toxicol., 1998, 36, 711–718 CrossRef CAS.
- R. Wilson and M. Smith, Food Chem. Toxicol., 1998, 36, 743–745 CrossRef CAS.
- C. Lizandara-Pueyo, M. W. E. van den Berg, A. De Toni, T. Goes and S. Polarz, J. Am. Chem. Soc., 2008, 130, 16601–16610 CrossRef CAS.
Footnote |
| † Electronic supplementary information (ESI) available: ESI-1: Pure ZnO nanorods prepared via the emulsion-based method. ESI-2: Additional analytical data for different M@ZnO particles grown for χM = 0.03% and χM = 0.7%. ESI-3: Proposed effect of cations on the growth of ZnO nanorods. ESI-4: Additional data for differently shaped particles. ESI-5: Additional analytical data for the different Eu@ZnO particles grown for different Eu3+ concentration. ESI-6: Eu@ZnO nanorods with different length. ESI-7: HRTEM analysis of Eu@ZnO. ESI-8: XPS and EPR spectroscopy performed on Eu@ZnO nanorods. ESI-9: Micro-Raman comparison between ZnO and Eu@ZnO nanorods. ESI-10: Additional PL data for Eu@ZnO. See DOI: 10.1039/c5nr02550h |
| This journal is © The Royal Society of Chemistry 2015 |

![[thin space (1/6-em)]](https://www.rsc.org/images/entities/char_2009.gif) :
: