 Open Access Article
Surface enhanced Raman scattering by graphene-nanosheet-gapped plasmonic nanoparticle arrays for multiplexed DNA detection†
Bo
Duan
a,
Jiajing
Zhou
a,
Zheng
Fang
a,
Chenxu
Wang
a,
Xiujuan
Wang
a,
Harold F.
Hemond
*b,
Mary B.
Chan-Park
*a and
Hongwei
Duan
*a
aSchool of Chemical and Biomedical Engineering, Nanyang Technological University, 70 Nanyang Drive, Singapore 637457. E-mail: mbechan@ntu.edu.sg; hduan@ntu.edu.sg
bDepartment of Civil and Environmental Engineering, Massachusetts Institute of Technology, 77 Massachusetts Avenue, Cambridge, MA 02139, USA. E-mail: hfhemond@mit.edu
First published on 15th June 2015
Abstract
We have developed a new type of surface enhanced Raman scattering (SERS) substrate with thiolated graphene oxide (tGO) nanosheets sandwiched between two layers of closely packed plasmonic nanoparticles. The trilayered substrate is built up through alternative loading of interfacially assembled plasmonic nanoparticle arrays and tGO nanosheets, followed by coating the nanoparticle surfaces with poly(ethylene glycol) (PEG). Here tGO plays multifunctional roles as a 2D scaffold to immobilized interfacially assembled plasmonic nanoparticles, a nanospacer to create SERS-active nanogaps between two layers of nanoparticle arrays, and a molecule harvester to enrich molecules of interest via π–π interaction. In particular, the molecule harvesting capability of the tGO nanospacer and the stealth properties of PEG coating on the plasmonic nanoparticles collectively lead to preferential positioning of selective targets such as aromatic molecules and single-stranded DNA at the SERS-active nanogap hotspots. We have demonstrated that an SERS assay based on the PEGylated trilayered substrate, in combination with magnetic separation, allows for sensitive, multiplexed “signal-off” detection of DNA sequences of bacterial pathogens.
1 Introduction
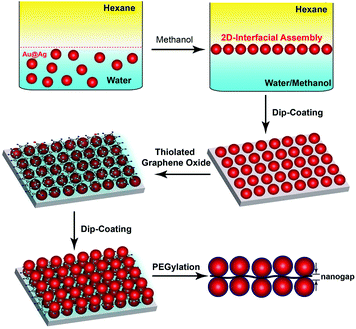
Surface enhanced Raman scattering (SERS), capable of detecting vibrational fingerprints of single molecules,1,2 has stimulated widespread interest from diverse backgrounds in which ultrasensitive measurements are of considerable value, ranging from medical diagnostics3–5 to food safety6,7 and environmental regulation.8,9 Raman signals of molecules in close proximity to plasmonic nanostructures are greatly amplified because of a confined electromagnetic field arising from the excitation of localized surface plasmon resonance (LSPR).10,11 In particular, tight junctions between strongly coupled plasmonic nanoparticles exhibiting locally enhanced fields are highly efficient SERS hotspots. Both top-down lithographic and bottom-up self-assembly methods are being actively explored for fabricating hotspot-rich SERS substrates that can produce sensitive, uniform and consistent signals across entire substrates.11–15 Ordered arrays of plasmonic nanoparticles can be readily obtained using lithographic patterning techniques. However, it remains challenging to produce large areas of nanoparticle arrays containing exceedingly small nanogaps below 5 nm, which are most efficient in SERS signal amplification.16,17 In this context, self-assembly of structure-tailored nanoparticles that allows for scalable production of closely packed nanoparticle ensembles has attracted increasing attention.14,18–23 Notably, although considerable success has been achieved in developing SERS substrates with abundant hotspots,24 most SERS substrates reported previously lack a mechanism to selectively position the analytes of interest in the SERS hotspots for maximum detection sensitivity.Here we report a self-assembly approach toward a new class of trilayered SERS substrates with single layer graphene nanosheets sandwiched between two-dimensional (2D) arrays of closely packed plasmonic nanoparticles. Single-atom-thick graphene nanosheets exhibit intriguing optical, electronic, and structural properties.25,26 Hybrid materials of structurally integrated graphene derivatives and metal nanoparticles are under intense research for collective optical27,28 and catalytic29 properties. In our design, graphene oxide (GO) nanosheets play multifunctional roles as a 2D scaffold to anchor plasmonic nanoparticles through a metal–sulfur bond, a nanometer-thick spacer to create SERS-active nanogaps between two layers of nanoparticle arrays, and a molecule harvester for targeted analytes by virtue of π–π interaction. As illustrated in Fig. 1, the trilayered construct is built up through alternative loading of interfacially assembled arrays of Au@Ag core–shell nanoparticles and thiolated graphene oxide (tGO) nanosheets, followed by coating the nanoparticles with poly(ethylene glycol) (PEG) to minimize adsorption of targeted analytes on their surfaces. The nanogap created between the two layers of nanoparticle arrays and molecule harvesting properties of the tGO nanospacer, in conjugation with the stealth PEG coating on plasmonic nanoparticles, collectively leads to precise positioning of selective analytes such as aromatic molecules30 and single-stranded DNA (ssDNA)31 at the nanogap hotspots for ultrasensitive SERS detection.
Self-assembly of nanoparticles at oil–water interfaces, thermodynamically driven by favorable interfacial energy, has emerged as a promising approach for fabricating large areas of closely attached functional nanocrystals of diverse chemical composition and structures, with interparticle distances tailorable by surface coatings and solvent systems.32–35 Recently, the resulting 2D arrays of functional nanocrystals at oil–water interfaces have found potential uses in SERS,18,20 electrochemical biosensors,36 and chemical catalysis.37 Nevertheless, in contrast to our trilayered substrate with a built-in target enrichment mechanism imparted by the tGO nanospacer, the existing SERS substrates based on a single layer of interfacially assembled plasmonic nanostructures, either freestanding at oil–water interfaces38,39 or anchored on solid substrates,40 rely primarily on random adsorption of molecules on the nanostructures rather than preferential accumulation in the hotspot region.
Ultrasensitive, multiplex detection of DNA sequences is of considerable interest for both fundamental molecular biology research and practical uses in a wide range of fields such as diagnostics, food safety, and forensics. Major efforts have been made to develop DNA SERS sensors based on DNA-functionalized plasmonic nanostructures.38–40 Previous research has demonstrated that exposed nucleobases of flexible ssDNA endow them with strong affinity to GO nanosheets due to π–π interaction.31,41,42 This affinity allows us to develop a “signal-off” DNA sensor using our trilayered SERS substrate. Two unique oligonucleotide strands containing part of the complementary sequence of the target DNA are linked to magnetic beads (MB) and a Raman dye and serve as capture and reporter DNA, respectively. In a sandwich assay (Fig. 2), MB-bound capture DNA first hybridizes with the target DNA to separate and concentrate it from the sample under test, and the overhanging region of the target DNA is then recognized by the Raman-encoded reporter DNA. In the absence of the targeted DNA, the reporter DNAs are not removed and all bind to the GO nanospacer, leading to the strongest SERS signal. However, when the targeted DNA is present to hybridize with the capture and reporter DNA, Raman tags on the reporter DNA are not able to locate inside the nanogap hotspots after hybridization, which turns off the SERS signal. In addition to the extraordinary signal amplification of SERS spectroscopy, the structure-defined spectral fingerprints of individual Raman tags and narrow bandwidth of Raman peaks, along with single-wavelength excitation of multiple tags, collectively provide unique opportunities for multiplexed detection. Here, using the DNA sequences of three food-borne pathogens as model targets, we have shown that our tGO-gapped plasmonic substrates enable highly efficient multiplexed DNA detection down to a concentration of 10 pM.
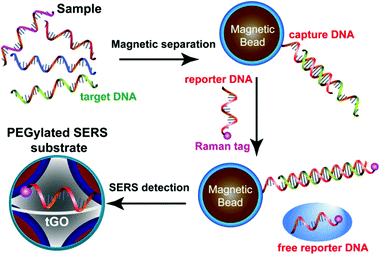 | ||
| Fig. 2 Schematic illustration of the SERS detection of DNA based on the trilayered GO-gapped plasmonic arrays of Au@Ag core–shell nanoparticles. | ||
2 Results and discussion
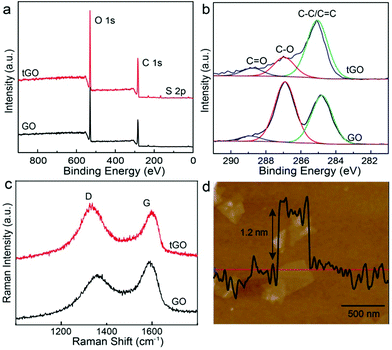
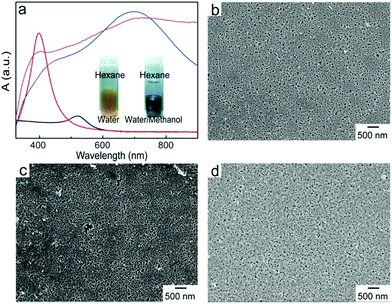
GO nanosheets prepared by the modified Hummers method carry a high density of oxygen-containing groups, primarily hydroxyl and epoxy groups in the basal plane and carboxylic acid groups at the edges, which have low affinity to metal surfaces. To function as a 2D anchoring scaffold for stable loading of metal nanostructures, new functionalities with stronger binding to metal surfaces are necessitated. Here, we have introduced thiol groups, which can form metal–sulfur bonds, by taking advantage of the ring-opening reaction of epoxy groups on the basal plane of GO and the primary amine group of cysteine.43,44 X-ray photoelectron spectroscopy (XPS) measurements (Fig. 3a) show that a new peak (167.0 eV) associated with S 2p level binding energy appears in the modified tGO, confirming the successful functionalization. In the deconvolved C 1s peaks of GO and tGO (Fig. 3b), the weaker peak (284.6 eV) of sp2-bonded carbon in GO becomes the dominant peak in tGO, in comparison with the epoxy/hydroxyl (286.9 eV) and carbonyl (288.5 eV) peaks, suggesting that cysteine in large excess also leads to partial reduction of GO. Recent reports have shown that reductive thiol-containing molecules such as glutathione can effectively reduce GO.45 In addition, Raman spectra (Fig. 3c) display an increased intensity ratio of the D and G bands after the reaction, which is consistent with the partial restoration of the sp2 carbon network in tGO. It should be mentioned that tGO maintains excellent colloidal stability in aqueous media and exists as individual nanosheets, which is essential for its use as a nanospacer in the trilayered SERS substrate. Atomic force microscopy (AFM) measurements (Fig. 3d) reveal that the nanosheets have a representative thickness of about 1.2 nm, which is consistent with the thickness of a single layer of chemically derived GO.We synthesized core–shell Au@Ag nanoparticles of 30 nm through controlled seeded growth of an Ag shell on citrate-stabilized Au nanoparticles of 15 nm in diameter. Addition of AgNO3 solution to Au nanoparticle dispersion containing L-ascorbic acid quickly led to a color change from red to bright yellow and LSPR of the nanoparticles shifted from 520 nm to 400 nm (Fig. 4a). Transmission electron microscopy (TEM) observation (Fig. S1†) reveals that a 7 nm Ag layer with lower contrast formed on the Au seeds, leading to core–shell Au@Ag nanoparticles of ∼30 nm in size. Previous reports have shown that the Ag shell dominates the optical properties of Au@Ag nanoparticles46 and Au@Ag nanoparticles exhibit Raman enhancement efficiencies comparable to those of pure Ag nanoparticles.47–49
The tendency of nanoparticles to accumulate at oil–water interfaces is closely related to the size of the nanoparticles, interfacial energy of the biphasic system, and contact angle of the nanoparticles at the interface, where a contact angle of 90° provides the largest free energy change.33 It has been reported that adding alcohol to a biphasic mixture of aqueous dispersion of charged particles and organic solvents reduces the charge density on the particles and consequently tunes their contact angle at the oil–water interface close to 90°, giving rise to 2D-assemblies of the particles at the interface.34,35 Here, methanol was added into the mixture of aqueous dispersion of Au@Ag nanoparticles and hexane to trigger their interfacial assembly. As shown in the inset of Fig. 4a, Au@Ag nanoparticles moved to the interface and formed a layer exhibiting metallic reflectance upon the addition of methanol followed by vigorous shaking to facilitate the migration of the nanoparticles. The LSPR peak of Au@Ag nanoparticles experienced a drastic red-shift from 400 nm to 700 nm, indicative of a strong interparticle plasmonic coupling. The interfacial assembly was transferred to a glass substrate, which was pretreated with (3-mercaptopropyl)trimethoxysilane. The pretreatment was to introduce thiol groups on the substrate for stable anchoring of the nanoparticles. Without it, the loaded nanoparticles were quickly washed off once they were in contact with the aqueous medium. A monolayer of closely packed nanoparticles was observed in the scanning electron microscopy (SEM) image (Fig. 4b). The coated substrate was further immersed in the tGO aqueous dispersion to introduce the tGO nanospacer on top of the nanoparticle monolayer (Fig. 4c). The presence of a homogeneous layer of tGO was confirmed by the consistent Raman signal of chemically derived GO across the entire substrate of a few centimeters in lateral size (Fig. S2†). In contrast, unmodified GO without the thiol groups cannot form stable loading on the nanoparticle array, evidenced by the absence of Raman signals from GO. Afterwards, the second layer of Au@Ag nanoparticles was added by dip-coating to form the sandwiched Au@Ag–tGO–Au@Ag trilayered construct, as shown in Fig. 4d. The binding of thiol functional groups onto the tGO basal plane with nanoparticle surfaces aligns the 2D anchoring scaffold parallel to the substrate, which in turn leads to the formation of nanogaps between the bottom and top nanoparticle monolayers. The close attachment of two layers of Au@Ag nanoparticles gives rise to further red shift and broadening of the LSPR peak. PEG chains (molecular weight = 750 Da) with one primary amine end group were coated onto the Au@Ag nanoparticles by ligand exchange. Notably, sandwiching tGO between the two layers of Au@Ag nanoparticle arrays to form the nanogap gave rise to an increase of the tGO Raman signal by a factor of 8 (Fig. S2†). SEM observations confirm that the PEGylated nanoparticle arrays did not undergo structural changes and remained stable for at least 3 months (Fig. S3a†). In contrast, without PEGylation, the nanoparticles apparently fuse together to form large clusters within 48 h after preparation (Fig. S3b†).
We next evaluated the SERS activity of the PEGylated Au@Ag–tGO–Au@Ag substrate using Rhodamine B (RhB) as a model Raman probe. Both the tGO-gapped architecture and PEGylation coating appear to make major contributions to the superior SERS activity of the substrate. RhB is a commonly used Raman dye molecule that adsorbs on citrate-stabilized Au@Ag nanoparticles primarily through electrostatic interactions. Our results demonstrate that the PEG coating grafted on colloidal Au@Ag nanoparticles can effectively suppress the non-specific adsorption of RhB molecules on the SERS-active sites of their surfaces (Fig. S4†). We reason that a dense layer of PEG chains either forms a physical barrier to block the access of RhB molecules to the nanoparticle surfaces or occupies the SERS-active sites.
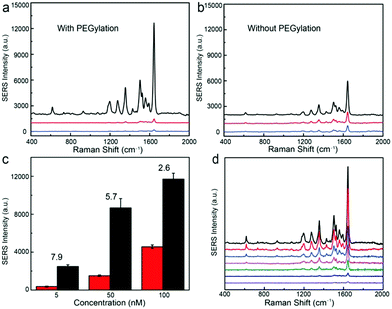
When the Au@Ag nanoparticle surfaces are PEGylated, the trilayered Au@Ag–tGO–Au@Ag structure exhibits a dramatic signal enhancement by a factor of 20 relative to that of the bilayered Au@Ag–tGO substrates for the RhB concentration of 100 nM, as shown in Fig. 5a. Graphene derivatives with a sp2 hybridized carbon network have been widely employed for loading aromatic molecules through π–π interactions. In a PEGylated trilayered substrate, this molecule harvesting property of tGO gives rise to preferential enrichment of RhB molecules in the SERS hotspot between the two layers of Au@Ag NP arrays, thereby resulting in considerably improved SERS activity with respect to that of the PEGylated Au@Ag–tGO bilayered substrate, in which tGO nanosheets are placed on top of Au@Ag NPs instead of in the nanogap SERS hotspots. We have found that PEGylation of the nanoparticle surfaces in the trilayered construct gives rise to a marked increase in the SERS signal (black lines in Fig. 5a and b) and the degree of increase becomes more prominent at low concentrations of analytes (Fig. 5c). In contrast, PEGylation of the nanoparticles in both the bilayered Au@Ag–tGO and monolayered Au@Ag substrates led to an obvious signal decrease. To avoid interference caused by nanoparticle fusion, freshly prepared non-PEGylated substrates were used in the SERS measurements for comparison. The closely packed Au@Ag NP array contains highly SERS-active interstitial spaces and less active superficial surfaces. As discussed above, PEGylation of Au@Ag NPs deactivates the nanoparticle surfaces for capturing RhB probes, and consequently leads to reduced SERS activity for PEGylated monolayered and bilayered substrates (Fig. 5a and b). For the trilayered substrate, however, the deactivation of Au@Ag nanoparticle surfaces by PEGylation minimizes the binding of RhB molecules to the less SERS-active superficial surfaces of nanoparticles, which would otherwise occur in a non-PEGylated substrate, giving rise to selective accumulation of RhB molecules on the tGO nanospacer where the SERS hotspots are located. The enhancement induced by PEGylation, defined as the factor of SERS intensity increase after PEGylation, became more pronounced at a low RhB concentration and increased from 2.6 at 100 nM to 7.9 at 5 nM (Fig. 5c), demonstrating the importance of selectively positioning molecules in the SERS hotspots for ultrasensitive detection. The trilayered PEGylated Au@Ag–tGO–Au@Ag substrate gives rise to sensitive detection of RhB (Fig. 5d) and a SERS enhancement factor of 2.7 × 10⁸ (see the ESI†). Although recent studies have demonstrated that graphene has SERS activity, leading to an enhancement factor of 2–17 through a chemical effect, the contribution of electromagnetic enhancement plays a dominant role in the PEGylated Au@Ag–tGO–Au@Ag substrate, considering the enhancement factor it exhibits.
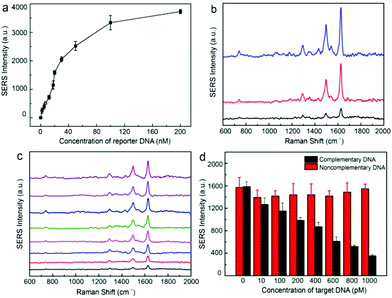
The PEGylated trilayered substrate was further utilized for the detection of gene sequences of bacterial pathogens such as E. coli O157:H7, Staphylococcus aureus, and Listeria monocytogenes, which are food-borne pathogens of significant public health risks. Sequence information on the DNA used in this work is summarized in Table S1.† Ultrasensitive detection of DNA sequences relies on the selective enrichment of reporter DNA in the nanogap hotspots. We have found that fluorescence quenching of TAMRA tags on ssDNA by Au@Ag nanoparticles decreased from 84% to 9% (Fig. S5†) after PEGylation, confirming that PEG grafts can effectively prevent adsorption of ssDNA onto nanoparticle surfaces.50 We further examined SERS detection of HEX-labeled reporter DNA using the PEGylated Au@Ag–tGO–Au@Ag substrate. Fig. 6a shows that the SERS signal of the HEX dye at 1626 cm−1 gradually increased in the DNA concentration range of 2–100 nM and eventually leveled off. A typical sandwich assay involves three steps: first, the target DNA of E. coli O157:H7 in 1 mL of sample solution is recognized by the MB-bound capture DNA and magnetically enriched; second, a predetermined amount (20 μL, 20 nM) of HEX-tagged reporter DNA is then introduced to hybridize with the overhanging region of the concentrated target DNA; finally, the sandwich structure formed on MB is magnetically separated and the remaining free reporter DNA is subjected to SERS measurement. Fig. 6b shows that the target DNA with an original concentration of 1.0 nM caused an 80% signal drop for reporter DNA of 20 nM. In contrast, scramble non-matching DNA gave rise to minimal signal changes of less than 10%, which could result from non-specific removal of the reporter DNA. This setup allowed for sensitive “signal-off” detection of DNA sequences down to 10 pM (Fig. 6c). Furthermore, the detection system also showed excellent specificity. As demonstrated in Fig. 6d, while the increase of target DNA concentration from 10 pM to 1.6 nM led to continuous signal drop, the SERS signal remained consistently unchanged in the presence of non-complementary DNA of the same concentration.
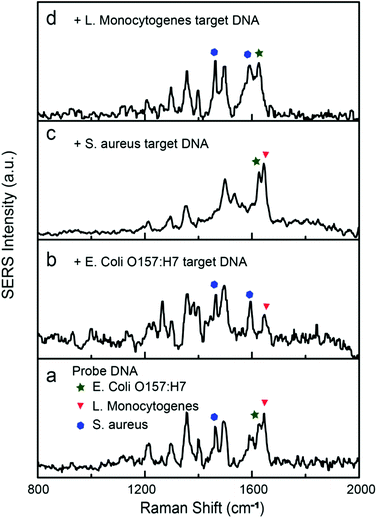
Simultaneous detection of multiple DNA sequences is of particular importance in rapid identification of pathogens. A large group of Raman dyes with distinct spectral profiles are readily available for tagging ssDNA, opening the possibility for multiplexed DNA detection. Here, HEX, Cy5, and TAMRA were used to encode the reporter DNAs for the detection of gene sequences of E. coli O157:H7, Staphylococcus aureus, and Listeria monocytogenes, respectively. The SERS spectra of Cy5 and TAMRA labeled reporter DNA are shown in Fig. S6 and S7.† The Raman peaks at 1626, 1465/1594, and 1645 cm−1 were selected as the characteristic peaks for HEX,52 Cy5,38 and TAMRA51 tags, respectively. Different concentrations of reporter DNAs (20 nM for HEX, 15 nM for TAMRA, and 50 nM for Cy5) were mixed to match their differences in Raman cross-section, leading to a spectrum containing combined Raman peaks of all three dyes (Fig. 7a). In representative measurements, addition of selected target DNA of 1.0 nM into the mixture specifically turned off the corresponding Raman peaks (Fig. 7b–d), demonstrating the multiplexed capability of our SERS sensor.
3 Experimental section
3.1 Materials
Graphite, hydrogen tetrachloroauric acid (HAuCl4·3H2O), silver nitrate, trisodium citrate, hexane, methanol, nitric acid, hydrochloric acid, sulphuric acid, hydrogen peroxide, (3-mercaptopropyl)trimethoxysilane (MPTMS), methoxypolyethylene glycol amine (PEG-NH2, MW = 750 Da) and L-cysteine were purchased from Sigma-Aldrich and used without purification. Rhodamine B was acquired from Sigma-Aldrich at >90% purity. ssDNAs were purchased from Shanghai Sangon Biotechnology Incorporation (Shanghai, China). Water used in this experiment was deionized water (DI water). Glassware used for all experiments were cleaned using aqua regia (HCl/HNO3 3![[thin space (1/6-em)]](https://www.rsc.org/images/entities/char_2009.gif) :
:![[thin space (1/6-em)]](https://www.rsc.org/images/entities/char_2009.gif) 1 (v/v)) and rinsed with copious amounts of DI water prior to use.
1 (v/v)) and rinsed with copious amounts of DI water prior to use.
3.2 Functionalization of graphene oxide (GO)
Graphene oxide (GO) was synthesized using the modified Hummers method53,54 by oxidation of graphite powder. Synthesized GO nanosheets were purified via multiple centrifugations and then re-dispersed in water to form a well-dispersed suspension. Further functionalization of GO nanosheets with L-cysteine was carried out following our previously reported method.443.3 Au@Ag nanoparticle preparation
Au@Ag nanoparticles with a diameter of 30 nm were synthesized by a seed-mediated method using 15 nm Au nanoparticles as seeds. 15 nm Au nanoparticles were prepared by direct reduction of HAuCl4 using sodium citrate as both a reducing agent and a capping agent. In a typical synthesis, HAuCl4 (60 mg) was dissolved in DI water (400 mL) and heated to boiling. Upon boiling, a solution of trisodium citrate tetrahydrate (200 mg, 4.5 mL) was quickly injected. Heating was maintained for another 30 minutes, and the resultant wine-red solution was cooled to room temperature. To synthesize 30 nm core–shell nanoparticles, 2 mL of as-prepared 15 nm Au seed nanoparticles was first diluted with 30 mL of DI water, then L-ascorbic acid (10 mg mL−1, 10 mL) was added, followed by the slow addition of silver nitrate (0.2 mg mL−1, 5 ml).3.4 Fabrication of Au@Ag–tGO–Au@Ag sandwich structured substrates
Glass substrates were first cleaned by sonication in ethanol and water for 10 minutes each. To make the surface hydrophilic, cleaned glass substrates were treated with piranha solution (3![[thin space (1/6-em)]](https://www.rsc.org/images/entities/char_2009.gif) :
:![[thin space (1/6-em)]](https://www.rsc.org/images/entities/char_2009.gif) 1 v/v H2SO4 (98%)/H2O2 (30%)) at 80 °C for 30 minutes. After rinsing with copious amounts of water and ethanol, the glass substrates were dried thoroughly and then immersed in 5 mM MPTMS solution for 30 minutes for silanization. Silane modified glass substrates were then rinsed thoroughly with chloroform and water to remove excess MPTMS. To prepare self-assembled Au@Ag NP film, hexane (0.5 mL) was added into the aqueous suspension of Au@Ag NPs (1 mL), followed by slow addition of methanol (0.1 mL). Au@Ag nanoparticles were spontaneously transferred to the water/hexane interface and self-assembled into a single layer film. This film formation process could be accelerated by shaking. Self-assembled Au@Ag nanoparticle film was then transferred onto silane-modified glass substrates and dried in ambient air. Subsequent immersion in tGO dispersion for 4 hours successfully yielded a tGO-coated substrate. Lastly, a second layer of Au@Ag nanoparticle film was prepared and transferred onto the glass substrate, resulting in a substrate with tGO nanosheets sandwiched between two monolayers of Au@Ag nanoparticle assemblies. PEGylation was performed by soaking the substrates in PEG-NH2 solution for 4 hours.
1 v/v H2SO4 (98%)/H2O2 (30%)) at 80 °C for 30 minutes. After rinsing with copious amounts of water and ethanol, the glass substrates were dried thoroughly and then immersed in 5 mM MPTMS solution for 30 minutes for silanization. Silane modified glass substrates were then rinsed thoroughly with chloroform and water to remove excess MPTMS. To prepare self-assembled Au@Ag NP film, hexane (0.5 mL) was added into the aqueous suspension of Au@Ag NPs (1 mL), followed by slow addition of methanol (0.1 mL). Au@Ag nanoparticles were spontaneously transferred to the water/hexane interface and self-assembled into a single layer film. This film formation process could be accelerated by shaking. Self-assembled Au@Ag nanoparticle film was then transferred onto silane-modified glass substrates and dried in ambient air. Subsequent immersion in tGO dispersion for 4 hours successfully yielded a tGO-coated substrate. Lastly, a second layer of Au@Ag nanoparticle film was prepared and transferred onto the glass substrate, resulting in a substrate with tGO nanosheets sandwiched between two monolayers of Au@Ag nanoparticle assemblies. PEGylation was performed by soaking the substrates in PEG-NH2 solution for 4 hours.
3.5 Synthesis of magnetic beads and DNA conjugation
Polydopamine (PDA) coated magnetic beads (MB@PDA) were prepared by in situ growth of polydopamine on magnetic beads in pH 8.5 tris buffer through self-polymerization of dopamine. Thiol-functionalized capture DNA was attached on MB@PDA colloid via the Michael addition reaction at a salt concentration of 80 mM for 8 h, followed by PEGylation with PEG-NH2 (MW = 2000 Da). MB–DNA conjugates were purified by an external magnetic field and then mixed with test solutions containing the target DNA. After incubation for 4 h at room temperature, the solid was separated by a magnetic field and redispersed in buffer (10 mM phosphate, pH = 7.4) solution containing 80 mM NaCl. MBs carrying the target DNA were then subjected to Raman-dye-tagged reporter DNA and incubated for another 4 h. The solid was again separated by a magnetic field and the solution containing the free reporter DNA that was left after hybridization was further introduced into the Au@Ag–tGO–Au@Ag substrate and incubated for 2 h before measurement.3.6 Characterization and measurements
UV-visible absorption spectra were recorded using a Shimadzu UV2501 spectrophotometer. Scanning electron microscopy (SEM) images were obtained using a field-emission scanning electron microscope (JSM-6700F). Raman spectra were acquired using a Renishaw Raman microscope. The 514 nm excitation line from an air-cooled Ar(+) laser was used for both normal Raman and SERS measurements. The laser beam has a spot size of 1 μm using a 50× objective. A single scan with an integration time of 10 s was performed for each spectrum acquisition. X-ray photoelectron spectroscopy (XPS) measurement was carried out on a Kratos-Axis spectrometer with monochromatic Al Kα (1486.7 eV) X-ray radiation (15 kV and 10 mA) and a hemispherical electron energy analyzer.4 Conclusions
In summary, we have developed a modular approach for fabricating efficient SERS substrates based on the use of chemically derived GO and interfacial assembly of plasmonic nanoparticles as building blocks. The multifunctional role of tGO as a 2D scaffold, a nanospacer and a molecule harvester makes it possible to selectively position the targeted analytes in the SERS hotspots. The modular nature of our strategy and recent advances in tailored wet-chemical synthesis of plasmonic nanocrystals collectively provide new opportunities for achieving fundamental insights into the architecture–SERS performance relationship. Furthermore, the ability of graphene derivatives to bind ssDNA, coupled with the powerful multiplexing of SERS spectroscopy, empowers this SERS substrate for ultrasensitive multiplexed genetic detection of pathogens.Acknowledgements
The authors thank Singapore Ministry of Education for financial support (Tier 1 project RGT19/13 and Tier 3 project MOE2013-T3-1-002). This research was also supported in part by the National Research Foundation Singapore through the Singapore MIT Alliance for Research and Technology's Center for Environmental Sensing and Modeling interdisciplinary research program.Notes and references
- S. M. Nie and S. R. Emory, Science, 1997, 1102–1106 CrossRef CAS PubMed.
- K. Kneipp, Y. Wang, H. Kneipp, L. T. Perelman, I. Itzkan, R. R. Dasari and M. S. Feld, Phys. Rev. Lett., 1997, 78, 1667–1670 CrossRef CAS.
- W. Xie and S. Schlucker, Phys. Chem. Chem. Phys., 2013, 15, 5329–5344 RSC.
- J. Song, J. Zhou and H. Duan, J. Am. Chem. Soc., 2012, 134, 13458–13469 CrossRef CAS.
- D. A. Stuart, J. M. Yuen, N. Shah, O. Lyandres, C. R. Yonzon, M. R. Glucksberg, J. T. Walsh and R. P. Van Duyne, Anal. Chem., 2006, 78, 7211–7215 CrossRef CAS.
- B. Peng, G. Li, D. Li, S. Dodson, Q. Zhang, J. Zhang, Y. H. Lee, H. V. Demir, X. Yi Ling and Q. Xiong, ACS Nano, 2013, 7, 5883–6000 CrossRef.
- M. Lin, Handbook of Vibrational Spectroscopy, John Wiley & Sons, Ltd, 2006 Search PubMed.
- I. López-Tocón, J. C. Otero, J. F. Arenas, J. V. Garcia-Ramos and S. Sanchez-Cortes, Anal. Chem., 2011, 83, 2518–2525 CrossRef.
- J. Yin, T. Wu, J. Song, Q. Zhang, S. Liu, R. Xu and H. Duan, Chem. Mater., 2011, 23, 4756–4764 CrossRef CAS.
- R. A. Alvarez-Puebla and L. M. Liz-Marzán, Small, 2010, 6, 604–610 CrossRef CAS.
- J. P. Camden, J. A. Dieringer, J. Zhao and R. P. Van Duyne, Acc. Chem. Res., 2008, 41, 1653–1661 CrossRef CAS.
- J. D. Caldwell, O. Glembocki, F. J. Bezares, N. D. Bassim, R. W. Rendell, M. Feygelson, M. Ukaegbu, R. Kasica, L. Shirey and C. Hosten, ACS Nano, 2011, 5, 4046–4055 CrossRef CAS PubMed.
- J. W. Liu, S. Y. Zhang, H. Qi, W. C. Wen and S. H. Yu, Small, 2012, 8, 2412–2420 CrossRef CAS.
- G. Lu, H. Li and H. Zhang, Small, 2012, 8, 1336–1340 CrossRef CAS.
- B. Yan, A. Thubagere, W. R. Premasiri, L. D. Ziegler, L. Dal Negro and B. r. M. Reinhard, ACS Nano, 2009, 3, 1190–1202 CrossRef CAS.
- E. C. Le Ru and P. G. Etchegoin, Principles of Surface-Enhanced Raman Spectroscopy, Elsevier, 2009 Search PubMed.
- Y. Zheng, T. Thai, P. Reineck, L. Qiu, Y. Guo and U. Bach, Adv. Funct. Mater., 2013, 23, 1519–1526 CrossRef CAS PubMed.
- M. P. Cecchini, V. A. Turek, J. Paget, A. A. Kornyshev and J. B. Edel, Nat. Mater., 2013, 12, 165–171 CrossRef CAS.
- M. P. Konrad, A. P. Doherty and S. E. J. Bell, Anal. Chem., 2013, 85, 6783–6789 CrossRef CAS.
- K. Kim, H. S. Han, I. Choi, C. Lee, S. G. Hong, S.-H. Suh, L. P. Lee and T. Kang, Nat. Commun., 2012, 4, 2182 Search PubMed.
- S. Y. Zhang, J. W. Liu, C. L. Zhang and S. H. Yu, Nanoscale, 2013, 5, 4223–4229 RSC.
- T. Wen and S. A. Majetich, ACS Nano, 2011, 5, 8868–8876 CrossRef CAS.
- A. Chen, A. E. DePrince, A. Demortière, A. Joshi-Imre, E. V. Shevchenko, S. K. Gray, U. Welp and V. K. Vlasko-Vlasov, Small, 2011, 7, 2365–2371 CrossRef CAS PubMed.
- D.-K. Lim, K.-S. Jeon, J.-H. Hwang, H. Kim, S. Kwon, Y. D. Suh and J.-M. Nam, Nat. Nanotechnol., 2011, 6, 452–460 CrossRef CAS.
- K. P. Loh, Q. L. Bao, G. Eda and M. Chhowalla, Nat. Chem., 2010, 2, 1015–1024 CrossRef CAS PubMed.
- L. Xie, X. Ling, Y. Fang, J. Zhang and Z. Liu, J. Am. Chem. Soc., 2009, 131, 9890–9891 CrossRef CAS PubMed.
- J. Huang, X. Gao, J. Jia, J.-K. Kim and Z. Li, Anal. Chem., 2014, 86, 3209–3215 CrossRef CAS PubMed.
- X. Liu, L. Cao, W. Song, K. Ai and L. Lu, ACS Appl. Mater. Interfaces, 2011, 3, 2944–2952 CAS.
- S. Zhang, Y. Shao, H.-g. Liao, J. Liu, I. A. Aksay, G. Yin and Y. Lin, Chem. Mater., 2011, 23, 1079–1081 CrossRef CAS.
- P. Wang, O. Liang, W. Zhang, T. Schroeder and Y.-H. Xie, Adv. Mater., 2013, 25, 4918–4924 CrossRef CAS PubMed.
- S. He, B. Song, D. Li, C. Zhu, W. Qi, Y. Wen, L. Wang, S. Song, H. Fang and C. A. Fan, Adv. Funct. Mater., 2010, 20, 453–459 CrossRef CAS PubMed.
- L. Cheng, A. P. Liu, S. Peng and H. W. Duan, ACS Nano, 2010, 4, 6098–6104 CrossRef CAS PubMed.
- H. Duan, D. Wang, D. G. Kurth and H. Möhwald, Angew. Chem., Int. Ed., 2004, 43, 5639–5642 CrossRef CAS.
- Y.-J. Li, W.-J. Huang and S.-G. Sun, Angew. Chem., Int. Ed., 2006, 45, 2537–2539 CrossRef CAS PubMed.
- F. Reincke, S. G. Hickey, W. K. Kegel and D. Vanmaekelbergh, Angew. Chem., Int. Ed., 2004, 43, 458–462 CrossRef CAS PubMed.
- F. Xiao, J. Song, H. Gao, X. Zan, R. Xu and H. Duan, ACS Nano, 2011, 6, 100–110 CrossRef PubMed.
- J. Zhou, B. Duan, Z. Fang, J. Song, C. Wang, P. B. Messersmith and H. Duan, Adv. Mater., 2014, 26, 701–705 CrossRef CAS PubMed.
- T. Kang, S. M. Yoo, I. Yoon, S. Y. Lee and B. Kim, Nano Lett., 2010, 10, 1189–1193 CrossRef CAS PubMed.
- D.-K. Lim, K.-S. Jeon, H. M. Kim, J.-M. Nam and Y. D. Suh, Nat. Mater., 2010, 9, 60–67 CrossRef CAS PubMed.
- Y. C. Cao, R. Jin and C. A. Mirkin, Science, 2002, 297, 1536–1540 CrossRef CAS PubMed.
- M. Wu, R. Kempaiah, P.-J. J. Huang, V. Maheshwari and J. Liu, Langmuir, 2011, 27, 2731–2738 CrossRef CAS PubMed.
- C.-H. Lu, H.-H. Yang, C.-L. Zhu, X. Chen and G.-N. Chen, Angew. Chem., Int. Ed., 2009, 48, 4785–4787 CrossRef CAS PubMed.
- Q. Mei and Z. Zhang, Angew. Chem., Int. Ed., 2012, 51, 5602–5606 CrossRef CAS PubMed.
- Z. Fang, Y. Wang, J. Song, Y. Sun, J. Zhou, R. Xu and H. Duan, Nanoscale, 2013, 5, 9830–9838 RSC.
- H. Gao, F. Xiao, C. B. Ching and H. Duan, ACS Appl. Mater. Interfaces, 2012, 4, 2801–2810 CAS.
- S.-I. Ana, C.-A. Enrique, G. Arnaud, R.-G. Benito, P.-J. Jorge, P.-S. Isabel and M. L.-M. Luis, Chem. – Eur. J., 2010, 16, 5558–5563 CrossRef PubMed.
- B. Liu, G. Han, Z. Zhang, R. Liu, C. Jiang, S. Wang and M.-Y. Han, Anal. Chem., 2011, 84, 255–261 CrossRef PubMed.
- X. Yang, C. Gu, F. Qian, Y. Li and J. Z. Zhang, Anal. Chem., 2011, 83, 5888–5894 CrossRef CAS PubMed.
- A. Shen, J. Guo, W. Xie, M. Sun, R. Richards and J. Hu, Raman Spectrosc., 2011, 42, 879–884 CrossRef CAS PubMed.
- H. Li and L. Rothberg, Proc. Natl. Acad. Sci. U. S. A., 2004, 101, 14036–14039 CrossRef CAS PubMed.
- S. H. Yazdi, K. L. Giles and I. M. White, Anal. Chem., 2013, 85, 10605–10611 CrossRef CAS.
- K. Faulds, W. E. Smith and D. Graham, Anal. Chem., 2003, 76, 412–417 CrossRef PubMed.
- W. S. Hummers and R. E. Offeman, J. Am. Chem. Soc., 1958, 80, 1339–1339 CrossRef CAS.
- D. Li, M. B. Muller, S. Gilje, R. B. Kaner and G. G. Wallace, Nat. Nanotechnol., 2008, 3, 101–105 CrossRef CAS PubMed.
Footnote |
| † Electronic supplementary information (ESI) available: DNA sequence information and additional figures. See DOI: 10.1039/c5nr02164b |
| This journal is © The Royal Society of Chemistry 2015 |

