
 Open Access Article
 This Open Access Article is licensed under a
 Creative Commons Attribution 3.0 Unported Licence
A manual and an automatic TERS based virus discrimination†
Konstanze
Olschewski‡
ab,
Evelyn
Kämmer‡
abc,
Stephan
Stöckel
ab,
Thomas
Bocklitz
abc,
Tanja
Deckert-Gaudig
c,
Roland
Zell
d,
Dana
Cialla-May
abc,
Karina
Weber
abc,
Volker
Deckert
abc and
Jürgen
Popp
*abc
aInstitute of Physical Chemistry and Abbe Center of Photonics, Friedrich Schiller University, Helmholtzweg 4, 07743 Jena, Germany. E-mail: juergen.popp@ipht-jena.de
bInfectoGnostics Forschungscampus Jena e.V., Zentrum für Angewandte Forschung, Philosophenweg 7, 07743 Jena, Germany
cLeibniz Institute of Photonic Technology (IPHT), Albert-Einstein-Strasse 9, 07745 Jena, Germany
dDepartment of Virology and Antiviral Therapy, Jena University Hospital, Friedrich Schiller University, Hans-Knöll-Strasse 2, 07745 Jena, Germany
First published on 5th February 2015
Abstract
Rapid techniques for virus identification are more relevant today than ever. Conventional virus detection and identification strategies generally rest upon various microbiological methods and genomic approaches, which are not suited for the analysis of single virus particles. In contrast, the highly sensitive spectroscopic technique tip-enhanced Raman spectroscopy (TERS) allows the characterisation of biological nano-structures like virions on a single-particle level. In this study, the feasibility of TERS in combination with chemometrics to discriminate two pathogenic viruses, Varicella-zoster virus (VZV) and Porcine teschovirus (PTV), was investigated. In a first step, chemometric methods transformed the spectral data in such a way that a rapid visual discrimination of the two examined viruses was enabled. In a further step, these methods were utilised to perform an automatic quality rating of the measured spectra. Spectra that passed this test were eventually used to calculate a classification model, through which a successful discrimination of the two viral species based on TERS spectra of single virus particles was also realised with a classification accuracy of 91%.
1. Introduction
A quick virus identification, surveillance and diagnostics play an increasingly important role in clinical medicine and public health, considering the growing globalisation of travel and trade, bushmeat trafficking, climate change, as well as other factors that enhance the emergence and re-emergence of pathogenic viruses.1 The annually recurring worldwide flu seasons caused by influenza viruses or the geographically limited, nevertheless devastating outbreak of the Ebola virus disease in West Africa in 2014 clearly exemplify the importance of a global-scale virus diagnosis and surveillance.2,3 In order to optimally counteract viral infections by means of fast clinical actions in infection control, prophylaxis and tailored antiviral treatments, the diagnosis of viruses should be performed as fast as possible.Time-consuming and labour-intensive culture-based methods for virus isolation were once the mainstay in clinical virology, but are nowadays complemented by serological and genomic approaches like oligonucleotide microarrays, multiplex PCR and sequencing.1,4 In particular the advent of real-time monitoring of amplified PCR products can deliver rapid results, even within one hour.5 In addition, virus isolation is still required to adapt primers and probes on a regular basis to highly variable viruses, e.g. in the case of influenza surveillance.6 Reagents may not be available for all viruses; when they grow poorly or not at all in in vitro systems, the generation of sufficient material to produce commercial test kits is complicated.7 Also, molecular or antigen-based testing would probably miss one of the agents in cases of dual infection.8
Conversely, organism-specific reagents for the recognition of the pathogenic agents are not needed for direct methods like electron microscopy (EM). However, EM is often not able to identify a virus beyond the family level and requires lengthy and complex procedures for fixation and staining of the samples.8,9 Often, a complete dehydration is necessary. Another direct microscopy method applied for the analysis of viruses is atomic force microscopy (AFM).10 The advantages of AFM compared to EM are the simple sample preparation and the direct access to three-dimensional information without approximations via reconstruction.11 When combined with enhanced Raman spectroscopy, i.e. tip-enhanced Raman spectroscopy (TERS), not only topographic but also spectroscopic information of the virus at nanometre resolution can be obtained.12,13 In contrast to super-resolution microscopic methods like stimulated emission depletion (STED) microscopy or photoactivation localisation microscopy (PALM), TERS requires no target-specific fluorophores.14 A further advantage of TERS (especially in view of samples with low viral particle concentration) is the intrinsically high lateral resolution of AFM, which allows a single-virus particle investigation.15,16
In this work, the possibility for a fast virus detection and the discrimination of single virus particles by means of TERS is presented. Varicella-zoster virus (VZV), causing varicella and shingles in humans, and Porcine teschovirus (PTV) were selected as model viruses. The discrimination of the virus on the basis of TERS spectra takes place by means of chemometric methods. In the first part, this study illustrates the possibility to visually discriminate the two examined species based on the spectral signal content. Therefore, chemometric methods were used to emphasise the significant differences for a fast visual decision. In the second part, the developed method for extracting the crucial signal content is adjusted and used for an automatic quality rating of the spectra. Furthermore, positively rated spectra were used to develop a classification model using multivariate data analysis. Both strategies allow a fast and successful species discrimination. To our knowledge, this is the first study coping with the discrimination of virus species that is solely based on TERS spectra combined with multivariate data analysis.
2. Experimental
2.1. Sample preparation
Varicella-zoster virus (VZV) strain vOka (family Herpesviridae) was amplified in the human embryonic lung fibroblasts (HELF). HELFs were cultured in Eagle minimal essential medium (EMEM) complemented with 25 mM HEPES, 1% non-essential amino acids, 2 mM L-glutamine, 1 mg per 100 ml Ciprofloxacin and 10% fetal bovine serum at 37 °C and 1% CO2. Supernatants of infected cells showing complete lysis were centrifuged for 15 min at 4000 rpm (3774g; Variofuge 3.0R) to remove cell detritus and were inactivated by UV-irradiation (20 minutes). The inactivated viruses were diluted serially in twofold steps with phosphate-buffered saline and stored at −70 °C.The Porcine teschovirus (PTV) type 1 strain Talfan (family Picornaviridae) was amplified in the porcine kidney cells PK-15 cultured in EMEM. For PTV preparation, PK-15 monolayers in T75 Roux flasks were infected and incubated for approximately 48 h until complete lysis. Then, the supernatant was centrifuged at 4000 rpm (3774g; Variofuge 3.0R) to remove detritus and further ultracentrifuged for 90 minutes at 100![[thin space (1/6-em)]](https://www.rsc.org/images/entities/char_2009.gif) 000g (30000 rpm, rotor SW60Ti) to pellet PTV. The virus pellet was resuspended in 100 μl PBS and inactivated by UV-irradiation (20 minutes). Two-fold serial dilutions with PBS were performed and stored at −70 °C.
000g (30000 rpm, rotor SW60Ti) to pellet PTV. The virus pellet was resuspended in 100 μl PBS and inactivated by UV-irradiation (20 minutes). Two-fold serial dilutions with PBS were performed and stored at −70 °C.
The resulting virus solutions of VZV and PTV were diluted with sterile filtered, deionized water in a ratio of 1:10 and 1:100, respectively. A 18 × 18 mm glass cover slip, which was cleaned with a mixture of concentrated nitric acid and hydrogen peroxide (both from Roth) and stored under an argon atmosphere served as the substrate. On these glass slides, 10 μl of virus solution was dropped and dried under ambient conditions. To remove residues of the companion matrix, the samples were washed with 100 μl deionized, sterile filtered water. After a further drying step, the virus particles were adsorbed on the glass substrates and were ready for TERS measurement.
2.2. TERS setup
All TERS measurements were carried out with a transmission setup using a 180° back-scattering geometry. The TERS setup consisted of a Raman spectroscope (HR LabRam, Jobin Yvon Horiba) coupled to an AFM (Nano Wizard, JPK Instrument AG). The glass slide with the adsorbed virions was fixed in the sample holder and illuminated from below. An oil immersion objective with a magnification of 60× (PlanApo, Olympus, NA 1.45) was used to focus the excitation laser on the sample and the AFM tip. As TERS tips, conventional AFM probes (NT-MDT, type: NSG10, average ωResonance: 270 kHz, rTip: 6–10 nm), suitable for non-contact and intermittent mode, were coated with 25 nm silver and stored under an argon atmosphere until usage. A krypton ion laser (Innova 300c, USA) with a wavelength of 530.9 nm and a power of 1 mW on the sample was used as excitation and coupled to the inverse microscope (IX70, Olympus).Sample scanning was performed using a closed-loop XY piezo scanning stage (P-734, Physik Instrumente, Germany). To compensate for the z-tip movements the microscope objective was synchronized via a z-piezo stage (PIFOC, Physik Instrumente, Germany) with the tip vertical movement. The setup allows the positioning of the AFM tip with an accuracy of 0.5 nm. After the scanning of the virion's surface, distinct points in the form of a grid with a pre-defined dimension were selected. Then, the tip and the sample were irradiated by the laser and from each point of the grid, a TERS spectrum was recorded with an acquisition time of 10 s.
2.3. Chemometric analysis
All data used in this study underwent an adequate preprocessing that was implemented using the free software environment R.17 First, the measured spectra were interpolated and at the same time truncated to a wavenumber region from 2000 to 400 cm−1. After that, the data was normalised using the Silicon band at 520 cm−1. This signal originates from the used tip and is treated as the internal standard. Therefore, it allows scaling of the recorded TERS spectra. In a third step, the background for each spectrum was estimated and then removed applying the sensitive non-linear iterative peak-clipping (SNIP) algorithm.18 All spectra were exposed to the same treatment.After the preprocessing, the data is further evaluated in two different ways: for the visual virus discrimination, the data set was reduced by the low quality spectra based on a manual rating. For the automated discrimination based on multivariate data analysis, all spectra underwent an automatic quality rating explained below. After the rating, the automatically recognised low quality spectra were discarded and removed from the data set.
 | (1) |
|
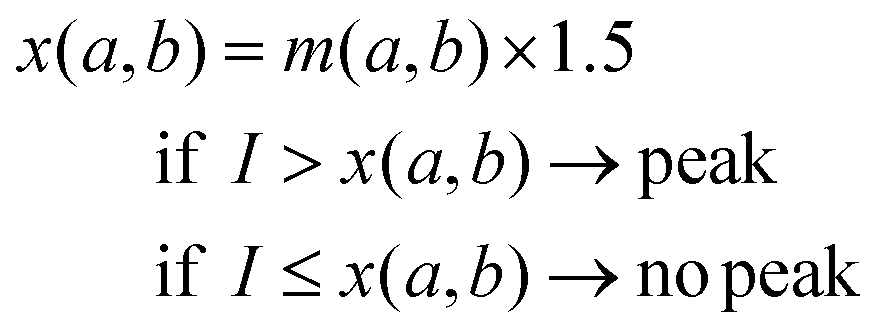
Eqn (1) shows how the decision value x for a subsection of a spectrum from wavenumber a to wavenumber b was determined. Thereby, m(a,b) denotes the arithmetic mean of the intensity values of a subsection of a spectrum from a to b inverse centimetres. A peak was recognised as valid signal if its intensity I exceeded x. Fig. 1 illustrates this decision process.
 | ||
| Fig. 1 Illustration of the peak decision. x denotes the decision value as computed in eqn (1), I is the intensity value of the fitted peak, a and b represent the borders of the considered wavenumber range. | ||
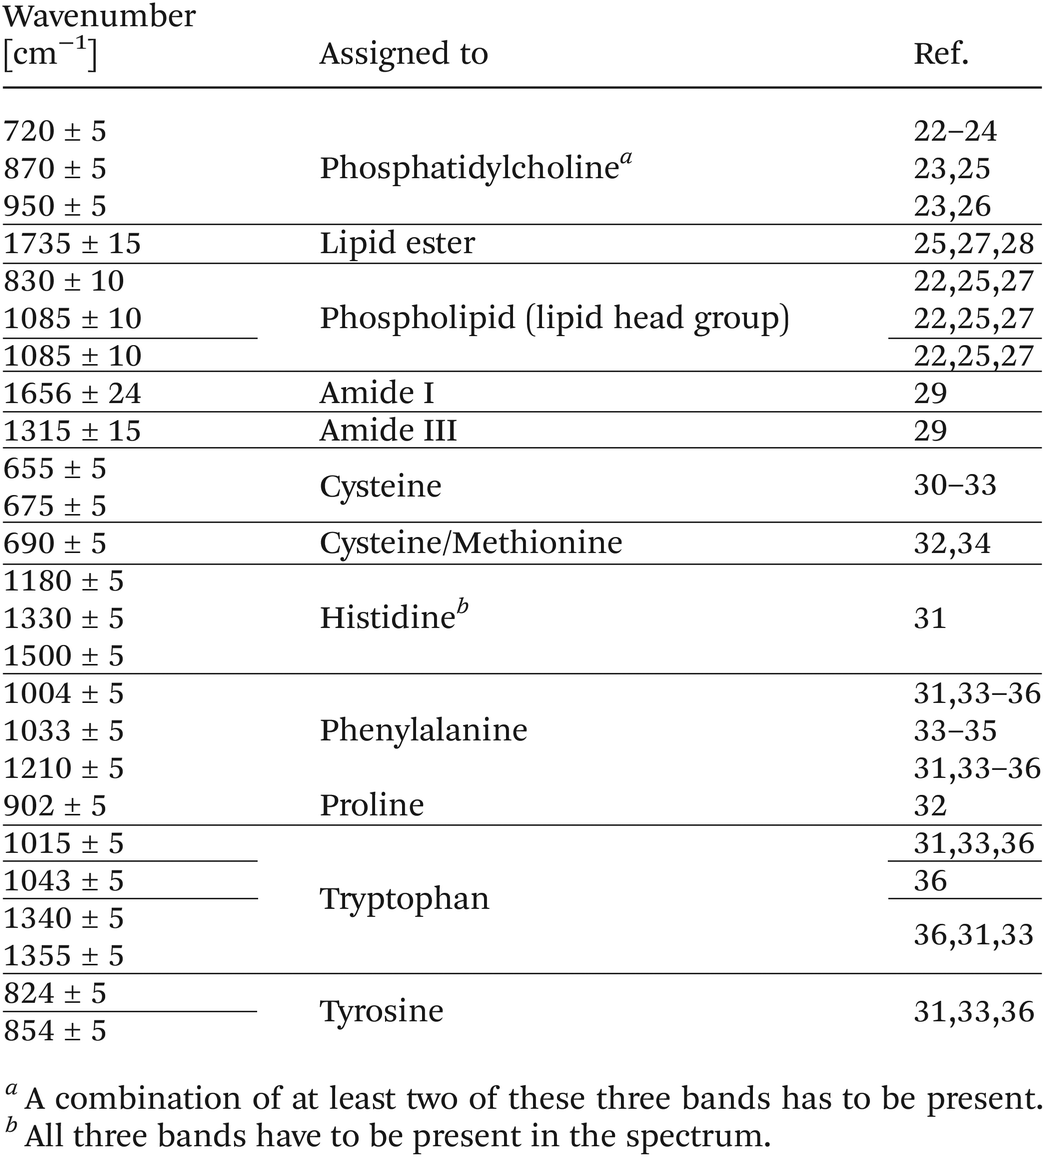
For every signal given in Table 1, an attempt was made to fit a peak in the range [a,b] around the expected wavenumber position. The peak was not only fitted at its expected position but also in an individual allowed range to compensate for possible wavenumber shifts. In Table 1, the first column gives the expected wavenumber position for a peak as well as the allowed deviation. The range [a,b] is derived from this deviation, i.e.,
| a = expected wavenumber position + allowed deviation |
| b = expected wavenumber position − allowed deviation |
If a peak was successfully fitted, its intensity value had to be higher than the decision value x for the considered range [a,b]. If the intensity value was higher than 1.5 times the mean intensity value over the examined wavenumber range, i.e. the decision value x, the peak was considered as present.
For each spectrum that is part of the analysis, the number of present signals was counted. Thereby, protein and lipid signals were counted separately to create a lipid and a protein map for each measured virus particle. This set of component maps was then used for a fast visual discrimination of the virus particles.
3. Results and discussion
For the investigation of virions based on tip-enhanced Raman spectroscopy (TERS), two virus species were chosen: Porcine teschovirus (PTV) and Varicella-zoster virus (VZV). Initially, AFM topographic images of both virus samples were measured to find viral particles. In Fig. 2, example AFM topographic images of VZV (A) and PTV (B) are shown. | ||
| Fig. 2 Left: AFM topographic images (height profile) of a (A) Varicella-zoster virus and of a (B) Porcine teschovirus are visualised. The illustrated height profile was levelled by subtraction of the mean level and the scan lines were corrected by matching the height medians using the Gwyddion software (version 2.36). The AFM images were measured in intermittent mode and in air by using a silicon nitride AFM tip. (C) Two exemplary untreated TERS spectra of each virus: Varicella-zoster virus (VZV) and Porcine teschovirus (PTV) are shown. The amide bands (protein markers) are marked in green colour. The lipid bands that only occur in the TERS spectra of VZV are labelled in blue colour. | ||
After topographically imaging the virions, subsequent spectroscopic investigations were carried out. The combination of AFM with enhanced Raman spectroscopy allowed one to record Raman spectra of the surface of virions. After imaging the topography of the virus surface, distinct points in the form of a grid were selected. The dimension of three grids per virus species can be found in the ESI Table S1.† At each grid point a TERS spectrum was recorded. In Fig. 2, two spectra of each virus species are shown as examples. The band at 520 cm−1 is assigned to silicon37 from the TERS tip. The two spectra in the lower panel were recorded by spectroscopically mapping the PTV virions. To protect their genome, the approximately 30 nm PTV virions have an icosahedral capsid, which consists of protein capsomeres. The TERS spectra of PTVs thus exhibit protein-specific signals. As an example, the amide I and III bands (protein markers) are highlighted in green in the spectra. In the spectra of the 200 nm sized VZV virion, protein-specific signals are visible as well. VZV virions also possess a capsid to protect the genome, which is further surrounded by a proteinaceous tegument and a lipid layer. Thus, VZV is an enveloped virus. In the lipid layer, proteins are tightly embedded, so that both categories of biomolecules can be detected in the TERS spectra. Some bands in the TERS spectra of VZV virions are therefore characteristic for lipids. In Fig. 2, these bands are marked in bluish colours. As can be clearly seen, the lipid bands are recognisable only in the TERS spectra of VZV virions, not in the PTV spectra. In addition to the labelled bands in Fig. 2, more characteristic TERS signals were used for data evaluation and are listed in Table 1. For the evaluation of the TERS spectra, the signals were divided into two categories, protein and lipid. Table 1 does not present a complete assignment of lipids as well as proteins and TERS spectra contain many more signals. For example, bands of CH2 modes are present in both compounds and thus, are not specific to one of the two categories. In order to ensure an unambiguous assignment very specific marker bands of lipid and protein/amino acids were used for data analysis. For instance, phenylalanine has an individual peak at 1004 ± 5 cm−1 (assigned to the ring breathing vibration31,33–36), which is considered as a protein signal. In addition to individual peaks, band combinations were used to achieve an unambiguous assignment. An example for a band combination are the two peaks at 1033 ± 5 cm−1 (ref. 33–35) and 1210 ± 5 cm−1.31,33–36 These two peaks are also regarded as protein signals for phenylalanine, whereas both peaks have to be present in the TERS spectra in order to count as a valid signal. The simultaneous detection of certain bands was in some cases a premise to unambiguously categorize a spectrum. In particular this was valid for marker bands with close band positions like for instance phenylalanine (1033 ± 5 cm−1) and tryptophan (1043 ± 5 cm−1). Here, the presence of a band at 1033 ± 5 cm−1 was not sufficient to identify phenylalanine but required a concurrent band at 1210 ± 5 cm−1. A further example for band combinations is phosphatidylcholine. At least two of the three bands assigned to this molecule group have to be present in a TERS spectrum to be interpreted as a lipid signal. The signals in unseparated rows in Table 1 must be simultaneously present in order to be recognised as a signal.
3.1. Data evaluation with manual quality rating
Based on the assignment of specific Raman bands to the two categories, namely protein and lipid, component maps can be created. A grid-based TERS measurement of the virus surface was performed so that at each point of the grid a spectrum was recorded. A component map represents such a grid. Thereby, each square in the map represents the accordingly measured point on the grid and therefore a spectrum recorded at this location. Hence, in the maps, a value for both categories can be specified for each point. The grid dimensions are given in ESI Table S1.† The resulting component maps are illustrated in Fig. 3. | ||
| Fig. 3 Component maps for the protein (left) and lipid (right) category of VZV grid (A) (above) and PTV grid (a) (below). The number of bands and band combinations found in the TERS spectra that are typical either for protein or lipids are visualised by the false colour scale. Each quadratic point of the component maps represents a TERS spectrum. | ||
Thus, each point corresponds to a TERS spectrum and the colour reflects the number of bands and band combinations found for the respective category. For a better comparison of all measured TERS spectra, an intensity normalisation was carried out using the silicon peak. Before the bands of interest were fitted and accepted as peak using eqn (1), all spectra of the grid underwent a manual quality rating, i.e. spectra with insufficient quality (too low signal-to-noise ratio caused by, for example, poor feedback of the tip during the measurement) were sorted out. The corresponding pixels are illustrated in grey in the component map. If a point was coloured in black, then a satisfying TERS spectrum was recorded at this position. However, the present bands could not be unambiguously assigned to one of the two categories. For example, the vibration assigned to the C–H molecule group can be found in lipid as well as protein spectra. Thereby, this signal does not provide additional information to successfully discriminate the virus species as presented in this study.
On the left in Fig. 3, the component maps based on the protein signals for VZV (above) and PTV (below) are presented. In comparison, on the right, the component maps based on the lipid signals are visualised. It is obvious that a high protein content is present on the surface of both viruses derived from the detected protein signals in a large number of TERS spectra. This is consistent with the morphology of the PTV, whose outermost layer is constituted by the capsid's proteins. In the case of the VZV also, protein signals can be expected, as proteins are embedded in the lipid envelope. Upon consideration of the lipid component maps of VZV, lipid-specific signals were found only in a few TERS spectra. This may be due to the hardly accessible lipid layer of VZV. The proteins incorporated there are packed very densely and thereby impede the measurement of the lipid signals. The TERS measurements were performed in the intermittent mode to reduce the tip-induced deformations of the viral particle, so that the TERS tip does not always reach the lipid layer of the VZV in between the protein spikes. In comparison, in the lipid component map of PTV virion no coloured points and therefore no lipid indicators are present. In agreement with the lack of lipid components in the PTV particle, no lipid-specific signal in the TERS spectra of the corresponding PTV virion was identified. Therefore, a discrimination of the two viruses is possible based on the observation of protein and lipid contents.
The process described above is based on the manual decision regarding the quality of the spectra. Such a decision differs from person to person and is highly subjective. In addition, an automation of the quality rating process for a higher amount of data, as it is necessary for model building algorithms, is more than useful. A manual quality rating for more than 200 spectra is very time consuming and unsatisfying. The method for creating the protein and lipid maps was adopted and adjusted accordingly to allow its application for an automatic quality rating for all measured spectra. In the adjusted method, the distinction in protein and lipid signals was discarded and all found signals were counted for each spectrum. If a spectrum showed at least one of the signals from Table 1, it was regarded as a high quality spectrum and considered for automatic classification, otherwise it was discarded. Consequently, it was possible to obtain an objective and fast quality rating for TERS spectra.
3.2. Classification
For the creation of the manual maps, two grids with 144 single raw spectra in each were recorded. After the manual quality rating, 78 spectra for VZV and 128 spectra for PTV were analysed for the expected protein and lipid signals given in Table 1. To increase the robustness and the general character of the classification model obtained through a LDA, the data set was extended. For the analysis, six virus grids including 1507 raw spectra were measured (913 spectra of the VZV and 594 spectra of the PTV). For the sake of completeness, the protein and lipid maps for the additional grids are given in ESI Fig. S1.†After a successful automatic quality rating for the six grids, the cleared data set (then consisting of 1322 single spectra (802 for VZV, 520 for PTV)) was used to train a classification model based on a Linear Discriminant Analysis (LDA). Thereby, each class included spectra measured on three different particles of the corresponding species. Furthermore, a leave-one-out cross-validation (LOOCV) was conducted to evaluate the classification model. The result of the LOOCV is presented in Table 2.
| A | ||
|---|---|---|
| Prediction | ||
| Reference | PTV | VZV |
| PTV | 512 | 8 |
| VZV | 108 | 694 |
| B | ||
|---|---|---|
| Prediction | ||
| Reference | PTV | VZV |
| PTV | 346 | 16 |
| VZV | 109 | 423 |
The numbers on the diagonal of the table show the number of correctly assigned spectra to the corresponding class. The classification accuracy can be determined by dividing the sum of the correctly assigned spectra by the number of spectra used in the analysis (sum over the whole table). The analysis showed a classification accuracy of approximately 91% for the two examined species based on the automatically rated data set. For comparison, the same analysis was carried out for the same data with a manual quality rating. In this part of the analysis, 894 single spectra were taken into account. Thereby, 532 spectra represented the class of Varicella-zoster virus and 362 spectra the class of Porcine teschovirus, respectively. The accuracy for this analysis decreased to 86%.
The manual quality rating discarded approx. 41% of the spectra whereas the automatic quality rating determined an unsatisfying quality for approx. 12% of the spectra. Despite the higher number of chosen spectra, the last mentioned method led to a decreased in-group variance for the considered spectra. Thus, the automatic quality rating, although being less strict than a manual quality rating, delivers a data set free of unusable spectra that exhibit more stability in a classification task and leads thereby to improved general results.
In both cases, misclassifications were mainly due to the high variance in the spectra, this holds particularly for the Varicella-zoster virus. This group showed a high standard deviation over all group spectra due to the highly variable morphology, the rather amorphous structure of the VZV virions38 and the fact that lipid and protein signals can occur in the spectra. In contrast, PTV spectra showed a significantly lower in-group variance because of their simple structure. The different magnitudes of variance are reflected in both the LOOCV results: the number of misclassified spectra of the PTV is a magnitude lower than the number of misclassified VZV spectra indicating a higher in-group variance. Such high variance for certain species was also observed by another working group13 and is thereby not an artefact of the presented measurements.
Furthermore, the variation of the TERS intensities can be explained by a different orientation of the molecules to the TERS tip as well as by the field gradient Raman (FGR) effect. The high lateral resolution of TERS results is much less averaging, consequently, the spectral variations are also related to locally specific interactions on the nanometric scale.12 Furthermore, at the apex of the tip (in the optimal case, there is a single nanoparticle), a field gradient can be induced in TERS measurement, so that a FGR effect may occur.39 Both effects result in intensity variations and significantly influence the spectroscopic analysis of complex structures. As previously mentioned, the VZV shows a high variability in its structure and is composed of lipids as well as proteins in comparison with the PTV. Thus, the interaction of the more complex virus structure with the mentioned effects can explain the higher variance in the TERS spectra of VZV.
Nevertheless, a discrimination of the two examined viruses based on a LDA is possible. In addition, the results indicate an improvement using an automatic quality rating for the spectral data and thereby a successful application of the introduced method.
4. Conclusion
Two different virus species were examined using tip-enhanced Raman spectroscopy and spectroscopic information was obtained from the virus surface. Due to the application of the TERS technique, the viruses were analysed on a single-particle level. Therefore, the possibility exists to refrain from pre-cultivation of viruses.Through the assignment of characteristic lipid and protein bands, component maps of both categories were created. In the TERS spectra of the Varicella-zoster virus both protein and lipid signals were identified. In comparison, for the Porcine teschovirus only protein signals were detected due to compositional differences. This is reflected in the component maps of both viruses and allowed a visual discrimination based on the spectroscopic data of the two examined species. Thus, the manual component maps represent a possibility to distinguish viruses for the untrained eye through detachment of the decision from spectroscopic expert knowledge.
Furthermore, the method used to create the above mentioned maps was adopted to perform an automatic quality rating of the TERS spectra. This step allows an objective view of the data as well as the inclusion of a high number of spectra and a reduction of the analysis time avoiding a manual quality rating by a spectroscopist. This is not only an achievement towards automation but also to a user-independent data evaluation. The spectra which have at least one specific signal were positively rated, used to train a classification model based on a LDA, and evaluated by a leave-one-out cross-validation. For the two investigated virus species a classification accuracy of approximately 91% was achieved. Further, it was shown that the automatic quality rating was successfully applied to TERS spectra and thus increased the classification power of the trained model.
Thereby, the presented study illustrates two paths for a successful discrimination of single viral particles based on their spectroscopic information. To our knowledge, this is the first time that a discrimination of viruses is achieved solely based on TERS spectra in combination with chemometric methods.
Acknowledgements
This research was supported by the Thüringer Aufbaubank under the support codes 2011FE9051 and 2011SE9048 (FastVirus). We gratefully acknowledge Steffen Trautmann who created the table of content figure (Scheme of viruses). In addition, we are grateful for the excellent preparation of the used TERS tips by Konstantin Kirsch and Dr Henrik Schneidewind.Notes and references
- W. I. Lipkin, Nat. Rev. Microbiol., 2013, 11, 133–141 CrossRef CAS PubMed.
- E. Lofgren, N. H. Fefferman, Y. N. Naumov, J. Gorski and E. N. Naumova, J. Virol., 2007, 81, 5429–5436 CrossRef CAS PubMed.
- S. Baize, D. Pannetier, L. Oestereich, T. Rieger, L. Koivogui, N. Magassouba, B. Soropogui, M. S. Sow, S. Keïta, H. De Clerck, A. Tiffany, G. Dominguez, M. Loua, A. Traoré, M. Kolié, E. R. Malano, E. Heleze, A. Bocquin, S. Mély, H. Raoul, V. Caro, D. Cadar, M. Gabriel, M. Pahlmann, D. Tappe, J. Schmidt-Chanasit, B. Impouma, A. K. Diallo, P. Formenty, M. Van Herp and S. Günther, N. Engl. J. Med., 2014, 1418–1425, DOI:10.1056/NEJMoa1404505.
- C. Y. Chius, Curr. Opin. Microbiol., 2013, 16, 468–478 CrossRef PubMed.
- G. Schalasta, A. Arents, M. Schmid, R. W. Braun and G. Enders, Infection, 2000, 28, 85–91 CrossRef CAS.
- R. L. Hodinka and L. Kaiser, J. Clin. Microbiol., 2013, 51, 2–8 CrossRef CAS PubMed.
- M. Lecuit and M. Eloit, Trends Microbiol., 2013, 21, 510–515 CrossRef CAS PubMed.
- C. S. Goldsmith and S. E. Miller, Clin. Microbiol. Rev., 2009, 22, 552–563 CrossRef PubMed.
- Y. Zhang, T. Hung, J. D. Song and J. S. He, Sci. China-Life Sci., 2013, 56, 421–430 CrossRef PubMed.
- Y. G. Kuznetsov and A. McPherson, Microbiol. Mol. Biol. Rev., 2011, 75, 268–285 CrossRef CAS PubMed.
- Y. Kuznetsov, P. D. Gershon and A. McPherson, J. Virol., 2008, 82, 7551–7566 CrossRef CAS PubMed.
- D. Cialla, T. Deckert-Gaudig, C. Budich, M. Laue, R. Müller, D. Naumann, V. Deckert and J. Popp, J. Raman Spectrosc., 2009, 40, 240–243 CrossRef CAS.
- P. Hermann, A. Hermelink, V. Lausch, G. Holland, L. Moeller, N. Bannert and D. Naumann, Analyst, 2011, 136, 1148–1152 RSC.
- B. Müller and M. Heilemann, Trends Microbiol., 2013, 21, 522–533 CrossRef PubMed.
- T. Deckert-Gaudig, E. Kämmer and V. Deckert, J. Biophotonics, 2012, 5, 215–219 CrossRef CAS PubMed.
- R. Treffer, R. Böhme, T. Deckert-Gaudig, K. Lau, S. Tiede, X. Lin and V. Deckert, Biochem. Soc. Trans., 2012, 40, 609–614 CrossRef CAS PubMed.
- R Development Core Team, R: A Language and Environment for Statistical Computing, R Foundation for Statistical Computing, Vienna, Austria, 2008 Search PubMed.
- C. G. Ryan, E. Clayton, W. L. Griffin, S. H. Sie and D. R. Cousens, Nucl. Instrum. Methods Phys. Res., Sect. B, 1988, B34, 396–402 CrossRef CAS.
- W. N. Venables and B. D. Ripley, Modern Applied Statistics with S, Springer, New York, 4th edn, 2002 Search PubMed.
- W. Schumacher, M. Kühnert, P. Rösch and J. Popp, J. Raman Spectrosc., 2011, 42, 383–392 CrossRef CAS.
- S. Stöckel, S. Meisel, M. Elschner, P. Rösch and J. Popp, Angew. Chem., Int. Ed., 2012, 51, 5339–5342 CrossRef PubMed.
- M. R. Bunow and I. W. Levin, Biochim. Biophys. Acta, Lipids Lipid Metab., 1977, 489, 191–206 CrossRef CAS.
- H. Akutsu, Biochemistry, 1981, 20, 7359–7366 CrossRef CAS.
- E. Bicknell-Brown and K. G. Brown, Biochem. Biophys. Res. Commun., 1980, 94, 638–645 CrossRef CAS.
- J. R. Beattie, S. E. J. Bell and B. W. Moss, Lipids, 2004, 39, 407–419 CrossRef CAS.
- J. Grdadolnik and D. Hadži, Spectrochim. Acta, Part A, 1998, 54, 1989–2000 CrossRef.
- H. Wu, J. V. Volponi, A. E. Oliver, A. N. Parikh, B. A. Simmons and S. Singh, Proc. Natl. Acad. Sci. U. S. A., 2011, 108, 3809–3814 CrossRef CAS PubMed.
- C. Lee and C. D. Bain, Biochim. Biophys. Acta,– Biomembr., 2005, 1711, 59–71 CrossRef CAS PubMed.
- G. Socrates, Infrared and Raman characteristic group frequencies: tables and charts, John Wiley & Sons, 2004 Search PubMed.
- C. Jing and Y. Fang, Chem. Phys., 2007, 332, 27–32 CrossRef CAS PubMed.
- M. Wolpert and P. Hellwig, Spectrochim. Acta, Part A, 2006, 64, 987–1001 CrossRef PubMed.
- E. Podstawka, Y. Ozaki and L. M. Proniewicz, Appl. Spectrosc., 2004, 58, 570–580 CrossRef CAS PubMed.
- S. Stewart and P. M. Fredericks, Spectrochim. Acta, Part A, 1999, 55, 1641–1660 CrossRef.
- A. Brambilla, A. Philippidis, A. Nevin, D. Comelli, G. Valentini and D. Anglos, J. Mol. Struct., 2013, 1044, 121–127 CrossRef CAS PubMed.
- G. Zhu, X. Zhu, Q. Fan and X. Wan, Spectrochim. Acta, Part A, 2011, 78, 1187–1195 CrossRef PubMed.
- T. Deckert-Gaudig, E. Rauls and V. Deckert, J. Phys. Chem. C, 2010, 114, 7412–7420 CAS.
- Z. Iqbal, S. Vepřek, A. Webb and P. Capezzuto, Solid State Commun., 1981, 37, 993–996 CrossRef CAS.
- C. Grose, R. Harson and S. Beck, Virology, 1995, 214, 321–329 CrossRef CAS PubMed.
- E. Bailo and V. Deckert, Chem. Soc. Rev., 2008, 37, 921–930 RSC.
Footnotes |
| † Electronic supplementary information (ESI) available. See DOI: 10.1039/c4nr07033j |
| ‡ These authors contributed equally to this work. |
| This journal is © The Royal Society of Chemistry 2015 |