
 Open Access Article
 This Open Access Article is licensed under a
 Creative Commons Attribution 3.0 Unported Licence
Copper nanoparticles of well-controlled size and shape: a new advance in synthesis and self-organization†
Mohamed Ali
Ben Aissa
a,
Benoît
Tremblay
bc,
Amandine
Andrieux-Ledier
bc,
Emmanuel
Maisonhaute
de,
Noureddine
Raouafi
a and
Alexa
Courty
*bc
aLaboratoire de Chimie Analytique et Electrochimie, Département de Chimie, Faculté des Sciences de Tunis, Université de Tunis El Manar, campus universitaire de Tunis El Manar, 2092 Tunis El Manar, Tunisie
bSorbonne Universités, UPMC Univ Paris 06, UMR 8233, Laboratoire MONARIS, F-75005 Paris, France. E-mail: alexa.courty@umpc.fr
cCNRS, UMR 8233, Laboratoire MONARIS, F-75005, Paris, France
dSorbonne Universités, UPMC Univ Paris 06, UMR 8235, Laboratoire Interfaces et Systèmes Electrochimiques, F-75005 Paris, France
eCNRS, UMR 8235, LISE, F-75005, Paris, France
First published on 12th January 2015
Abstract
Here, we report a new synthetic route for spherical small copper nanoparticles (CuNPs) with size ranging from 3.5 nm to 11 nm and with an unprecedented associated monodispersity (<10%). This synthesis is based on the reduction of an organometallic precursor (CuCl(PPh3)3) by tert-butylamine borane in the presence of dodecylamine (DDA) at a moderate temperature (50 to 100 °C). Because of their narrow size distribution, the CuNPs form long-range 2D organizations (several μm2). The wide range of CuNPs sizes is obtained by controlling the reaction temperature and DDA-to-copper phosphine salt ratio during the synthesis process. The addition of oleic acid (OA) after the synthesis stabilizes the CuNPs (no coalescence) for several weeks under a nitrogen atmosphere. The nature and the reactivity of the ligands were studied by IR and UV-visible spectroscopy. We thus show that just after synthesis the nanoparticles are coated by phosphine and DDA. After adding OA, a clear exchange between phosphine and OA is evidenced. This exchange is possible thanks to an acid–base reaction between the free alkylamine in excess in the solution and OA. OA is then adsorbed on the NPs surface in the form of carboxylate. Furthermore, the use of oleylamine (OYA) instead of DDA as the capping agent allows one to obtain other NP shapes (nanorods, triangles and nanodisks). We get evidence that OYA allows the selective adsorption of chloride ions derived from the copper precursor on the different crystallographic faces during the growth of CuNPs that induces the formation of anisotropic shapes such nanorods or triangles.
1. Introduction
The ability to produce metal nanoparticles (NPs) of controlled size and shape is important for the study of their physical properties. Among the various metallic nanoparticles, CuNPs have received great attention because Cu is much cheaper than Ag or Au.1 Very peculiar optical, electrical and thermal properties have been described for CuNPs.2–4 Indeed, the nanoscale properties of Cu have found application in catalysis,2 cooling fluids for the electronic system,3 and conductive inks.4 Furthermore, nanosized Cu exhibits a prominent Localized Surface Plasmon Resonance (LSPR) in the visible range as Ag and Au.5 Nevertheless, a major drawback limiting the use of CuNPs is their tendency to oxidize. The literature on the synthesis of CuNPs of controlled size and shape is thus less developed than that for Ag or AuNPs.Among the methods of CuNPs elaboration reported in the literature,6 were mainly, the thermal decomposition,7 reduction in micro emulsion and reverse micelles,8–10 polyol process11 and chemical reductions.12–14 Nevertheless, most of the existing methods of CuNPs synthesis produce particles of large polydispersity (≥20%) or of sizes larger than a few tens of nm. Indeed, most research groups work on the stabilization of the copper nanoparticles against oxidation sometimes to the detriment of the size and shape control.15 However, a narrow size distribution is a key parameter to obtain reproducible and controllable chemical and physical properties of nano-objects.16 In addition, NPs with a narrow size distribution self-organize in 2D and 3D superlattices at long range.17,18 In fact a long-range order is necessary for the practical incorporation of NPs in functional devices. The strategy based on the reduction of an organometallic precursor in the presence of ligands at a controlled reaction temperature and by a weak reducing agent is a procedure developed since a few years for the preparation of gold or silver NPs of controlled size and shape.19–23 This soft chemistry method offers several parameters including temperature, nature and concentration of the ligand, nature of the organometallic precursor (nature of the functional group, number of phosphine), which have a strong influence on the size, shape and surface of the nanoparticles.
In this context, we have developed a new synthetic route for CuNPs with tunable size and shape based on the reduction of an organometallic precursor (CuCl(PPh3)3) in the presence of alkylamine (dodecylamine (DDA) or oleylamine (OYA)). The NPs thus prepared are further functionalized by oleic acid (OA) through a ligand exchange. The size and the shape of the CuNPs are controlled through the reaction temperature, the alkylamine ligand-to-copper salt ratio and the hydrocarbon chain length of the alkylamine. The resulting nanoparticles for this study are characterized by imaging (TEM, HRTEM) and spectroscopic (UV-Vis and IR) techniques.
2. Materials and methods
2.1. Materials
1-Dodecylamine (99%, 325163) (DDA), oleic acid (90%, 364525) (OA) and toluene (≥99.5%, 24529) purchased from Sigma-Aldrich were used without further purification. The tert-butylamine borane (TBAB) complex (≥97%, 05-0101) and oleylamine (80–90%, 129540050) (OYA) were purchased from STREM Chemicals and ACROS Organics, respectively, and were used as received. The synthesis procedure of the copper phosphine precursor (CuCl(PPh3)3) is built upon the studies by Yu et al.24 (see ESI†). The infrared spectra of these molecules are given in Fig. S1. of the ESI.† The spectrum agrees well with detailed spectroscopic studies on PPh3 and its complexes.25 The CuNPs synthesis was carried out in a glove box under nitrogen.2.2. Characterization methods
NPs size and morphology were studied with a JEOL Model JEM 100 CX electron microscope having an acceleration voltage of 100 kV. High resolution transmission electron microscopy observations were performed using a JEOL2010 microscope of 200 kV. Samples for TEM were prepared by placing a drop of NP solution on a carbon coated copper grid. The size distributions are determined with Image J software (1.37v) by measuring the diameter of around 500 NPs.The UV–Vis absorption spectra of CuNP solutions were obtained on a Cary 5000 spectrophotometer, at room temperature, between 400 and 800 nm, using a quartz cell (L = 1 mm).
Infrared spectra of the samples were recorded using a Bruker Equinox 55 spectrometer equipped with a Ge/KBr beamsplitter and a liquid nitrogen-cooled MCT detector. Using a single reflection accessory, we obtained the IR spectra of the deposited particles on a horizontal mirror (fused silica substrate and aluminum coating) at a spectral resolution of 4 cm−1.
3. Results and discussion
3.1. Synthesis of Cu nanoparticles: role of oleic acid
In a typical synthesis, 0.25 mmol of CuCl(PPh3)3 is dissolved in 25 mL of toluene in a glove box under a nitrogen atmosphere. After the clear solution is heated at the desired temperature (between 50 and 100 °C), 520 μL of alkylamine (OYA or DDA) is quickly injected into the solution under vigorous stirring. In parallel, a second solution is prepared by dissolving 2.5 mmol of the tert-butylamine borane (TBAB) complex in 15 mL of toluene and is heated to the same temperature. The injection of TBAB takes place a few minutes after the injection of alkylamine in order to allow the first solution to stabilize at the desired temperature. The solution with alkylamine remains stable, indicating that alkylamine alone cannot reduce the copper precursor. After the addition of TBAB, the color of the mixture turns from yellow to red indicating the NP growth. Furthermore, if alkylamine is replaced by dodecanethiol, the solution remains colorless and the salt precursor is not reduced. The couple DDA/TBAB is thus necessary to reduce the copper salt. Depending on the reaction temperature, the mixture is stirred continuously for different times (60 or 120 min). After, the reaction is stopped, the solution is cooled to room temperature and 400 μL of oleic acid (OA) is added, which is then stirred for 4 min. To eliminate by-products and to reduce the size distribution via a size selective precipitation process, the solution is then washed with ethanol and centrifuged. The precipitate is then collected and dispersed in toluene.The addition of OA allows the improvement of the stability of the CuNPs since the solution remains stable (no coalescence) after several weeks of storage under a nitrogen atmosphere whereas the NPs coated only by DDA coalesce rapidly and form a large precipitate after 24 h as evidenced by the TEM images of Fig. 1a and b. Alkylamine molecules are, indeed, known to be weakly bound to the metal surface thanks to the electron pair of the nitrogen atom and are rapidly exchanged with the solvent.26 Furthermore, OA is known to be a good stabilizing agent for metal nanoparticles through the formation of a covalent metal–oxygen bond.27–31
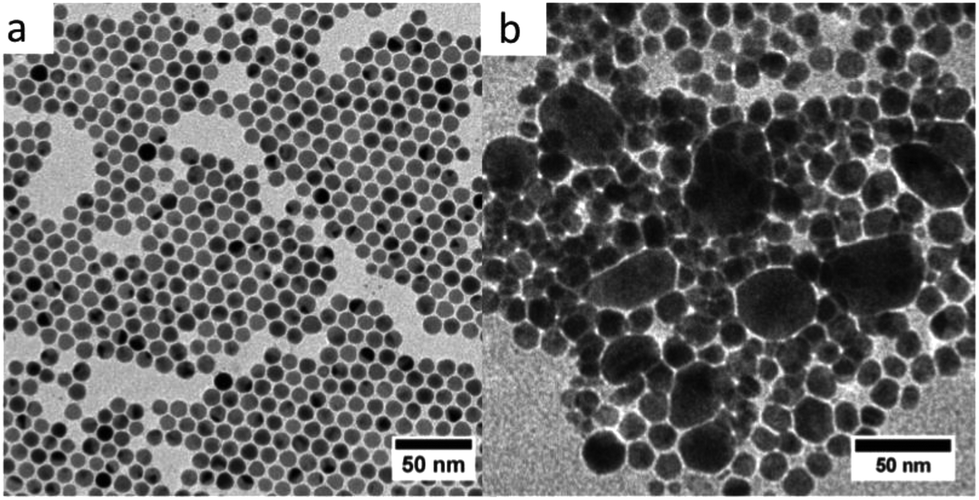 | ||
| Fig. 1 TEM images of CuNPs synthesized via the reduction of CuCl(PPh3)3 at 100 °C stabilized by: (a) mixed ligands dodecylamine and oleic acid, (b) dodecylamine after 24 h. | ||
We have analyzed the CuNP solution obtained from the reduction of CuCl(PPh3)3 at 100 °C in the presence of DDA by IR spectroscopy before and after the addition of OA. IR spectroscopy indeed allows one to probe the nature of the ligands adsorbed at the NPs surface and to obtain evidence of ligand exchanges.23Fig. 2 shows the IR spectra of CuNPs before and after the addition of OA, and the spectra of free PPh3, free DDA, free OA, and a 1![[thin space (1/6-em)]](https://www.rsc.org/images/entities/char_2009.gif) :1 mixture of OA and DDA. In the Fig. 2a and 2b, we can observe several characteristic bands for the phenyl ring and DDA. When we compare the spectrum of the CuNPs before the addition of OA (Fig. 2c) with the previous spectra, several characteristic bands from the PPh3 and from the DDA have changed positions compared to those of the free molecules, especially for DDA (see the dotted lines between spectra (b) and (c)). All of these band shifts are consistent with the coordination of PPh3 and DDA to the CuNPs.32–34 To easily compare the spectra of CuNPs before and after the addition of OA (Fig. 2c and 2d), they have been normalized using the NH2 wagging band at around 970 cm−1.33 In this case, we can observe that when we add OA at the end of the synthesis: (i) all the PPh3 bands decrease, (ii) two new bands appear at around 1570 and 1400 cm−1, and (iii) the intensity of the methylene and the terminal methyl stretching and bending bands observed at around 2900 and 1480 cm−1 increases.
:1 mixture of OA and DDA. In the Fig. 2a and 2b, we can observe several characteristic bands for the phenyl ring and DDA. When we compare the spectrum of the CuNPs before the addition of OA (Fig. 2c) with the previous spectra, several characteristic bands from the PPh3 and from the DDA have changed positions compared to those of the free molecules, especially for DDA (see the dotted lines between spectra (b) and (c)). All of these band shifts are consistent with the coordination of PPh3 and DDA to the CuNPs.32–34 To easily compare the spectra of CuNPs before and after the addition of OA (Fig. 2c and 2d), they have been normalized using the NH2 wagging band at around 970 cm−1.33 In this case, we can observe that when we add OA at the end of the synthesis: (i) all the PPh3 bands decrease, (ii) two new bands appear at around 1570 and 1400 cm−1, and (iii) the intensity of the methylene and the terminal methyl stretching and bending bands observed at around 2900 and 1480 cm−1 increases.
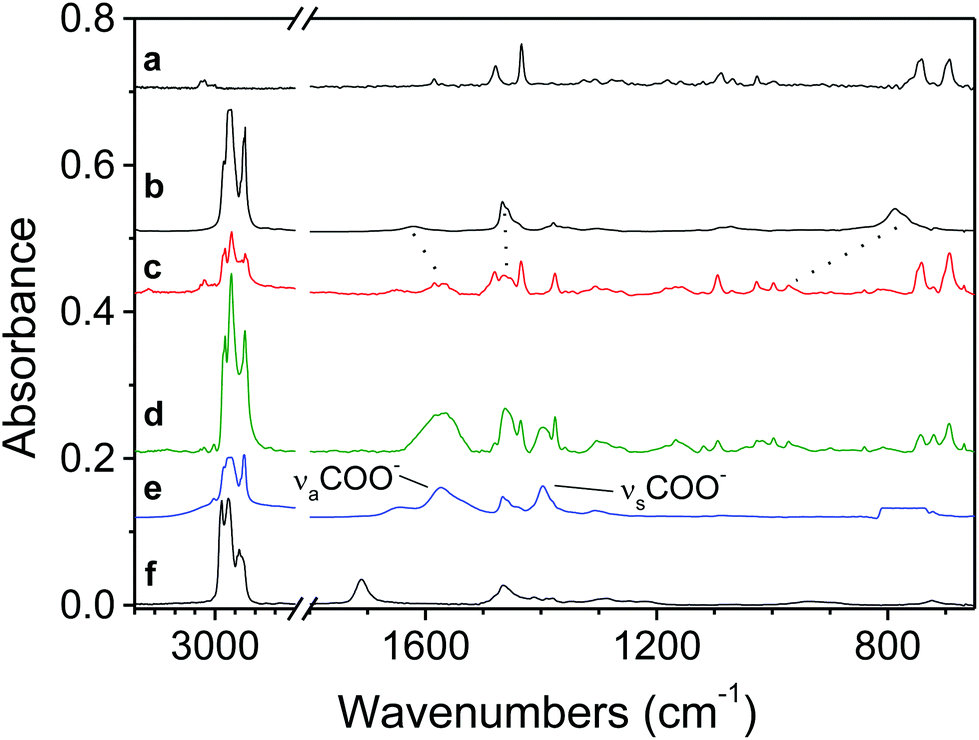 | ||
| Fig. 2 IR spectra of (a) free PPh3, (b) free DDA in CCl4 (except for the 1000–600 cm−1 zone, obtained in hexane, since CCl4 has a strong absorption band around 800 cm−1), (c) CuNPs before the addition of OA, (d) CuNPs after the addition of OA, (e) 1:1 mixture of OA and DDA in CCl4, and (f) free OA. The spectra c and d are obtained for the deposited NPs. | ||
The origin of the two new bands when we add OA can be understood when we examine Fig. 2e. We observe indeed that a 1:1 mixture of OA and DDA gives a spectrum that does not seem to be a combination of pure DDA and OA spectra (Fig. 2b and 2f). For example, we do not observe the band at around 1710 cm−1 due to the C![[double bond, length as m-dash]](https://www.rsc.org/images/entities/char_e001.gif) O mode of the COOH group. In fact, the mixture of DDA and OA gives an acid–base complex since we observe the following characteristic bands: νa(COO−) and νs(COO−) at 1574 and 1395 cm−1, and νa(NH3+) and νs(NH3+) at 1645 and 1538 cm−1, respectively.34 A similar reaction between OA and OYA has been reported previously.34 From these results, we can assign the two new bands observed in the spectrum of CuNPs after the addition of OA (Fig. 2d) to the νa(COO−) and νs(COO−) stretching modes and this reveals that OA is chemisorbed as a carboxylate onto the CuNPs. Also, the splitting amounts (Δ) between these two stretching modes can be used to characterize the type of interaction between the carboxylate and the metal atom. According to many previous studies of carboxylates,35,36 our value for Δ, 172 cm−1, is ascribed to the bridging bond with two Cu atoms.
O mode of the COOH group. In fact, the mixture of DDA and OA gives an acid–base complex since we observe the following characteristic bands: νa(COO−) and νs(COO−) at 1574 and 1395 cm−1, and νa(NH3+) and νs(NH3+) at 1645 and 1538 cm−1, respectively.34 A similar reaction between OA and OYA has been reported previously.34 From these results, we can assign the two new bands observed in the spectrum of CuNPs after the addition of OA (Fig. 2d) to the νa(COO−) and νs(COO−) stretching modes and this reveals that OA is chemisorbed as a carboxylate onto the CuNPs. Also, the splitting amounts (Δ) between these two stretching modes can be used to characterize the type of interaction between the carboxylate and the metal atom. According to many previous studies of carboxylates,35,36 our value for Δ, 172 cm−1, is ascribed to the bridging bond with two Cu atoms.
Finally, from the IR spectra, we can conclude that the decrease of the PPh3 bands implies a ligand exchange of PPh3 by the OA, which has a carboxylate form since we observe the COO− stretching modes. The carboxylate form is clearly due to an acid–base reaction between DDA and OA. Only free DDA (not adsorbed at the NP surface) in excess in the solution at the end of the synthesis can react with OA. Indeed, when OA is added after the washing step using ethanol that allows eliminating free DDA, the CuNPs are not stabilized and start to coalesce and precipitate after 24 h. A prior acid–base reaction between OA and DDA is thus necessary for efficient stabilization of the CuNPs.
Furthermore, the increase of the intensity of the methylene and the terminal methyl stretching and bending bands, observed at around 2900 and 1480 cm−1, when we add OA, is in agreement with a ligand exchange between PPh3 and OA since PPh3 does not contain methylene and methyl groups, in contrast to OA. Thus, these results imply that PPh3 derived from the precursor can act as a ligand for CuNPs. This is supported by previous studies showing that PPh3 can coat gold, silver or cobalt NPs either alone or when mixed with other ligands.22,23,37
The ligand exchange between PPh3 and OA has also been confirmed by performing UV visible spectroscopy of both solutions with and without OA (Fig. 3). We observe indeed that the maximum of Surface Plasmon Resonance (SPR) band, initially located at 576 nm, undergoes a 14 nm blue-shift when OA is added to the solution. As a blue-shift of the SPR maximum is expected when the medium dielectric constant decreases,38,39 the changing SPR maximum can be explained by a variation of the medium refractive indices due to a ligand exchange between PPh3 (n ∼ 1.59) and OA (n ∼ 1.45), the refractive indices of OA and DDA being nearly the same. Furthermore, PPh3 is known to be a weaker binding ligand to the surface metal than OA and DDA.40
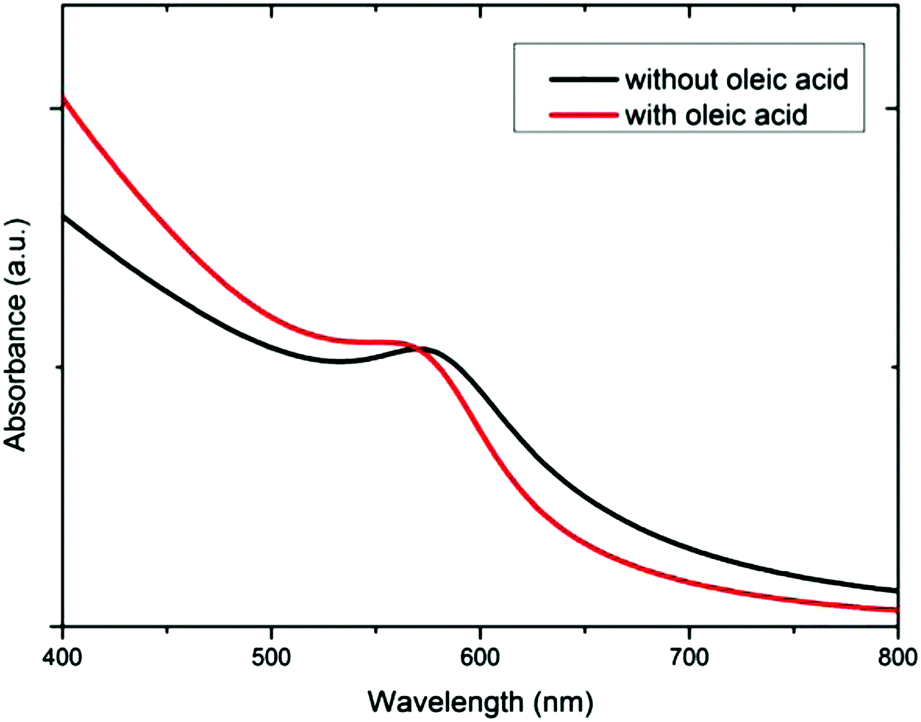 | ||
| Fig. 3 UV-vis absorption spectra of CuNPs obtained by the reduction of CuCl(PPh3)3 at 100 °C in the presence of dodecylamine (in black) and after the addition of oleic acid (in red). Both solutions have been washed with ethanol. | ||
3.2. Size control of dodecylamine and oleic acid-coated CuNPs
After one hour of reaction at 100 °C, the TEM image reveals the presence of CuNPs uniform in size and shape (Fig. 4a) with a mean diameter of 10.7 ± 0.7 nm. Fig. 4b shows the corresponding selected area electron diffraction (SAED) pattern. The diffraction lines correspond only to metal copper and the presence of the oxide phase was not detected. High Resolution TEM (HRTEM) imaging performed on several tens of CuNPs reveal that the NPs are well crystallized and correspond to a mixture of fcc single crystals (Fig. 4c) and multiply-twinned particles (Fig. 4d). The spacing between the lattice planes (0.204 nm) correspond to the (111) planes of the face centered cubic (fcc) Cu structure. This synthesis method allows thus to obtain pure CuNPs, which are not oxidized.
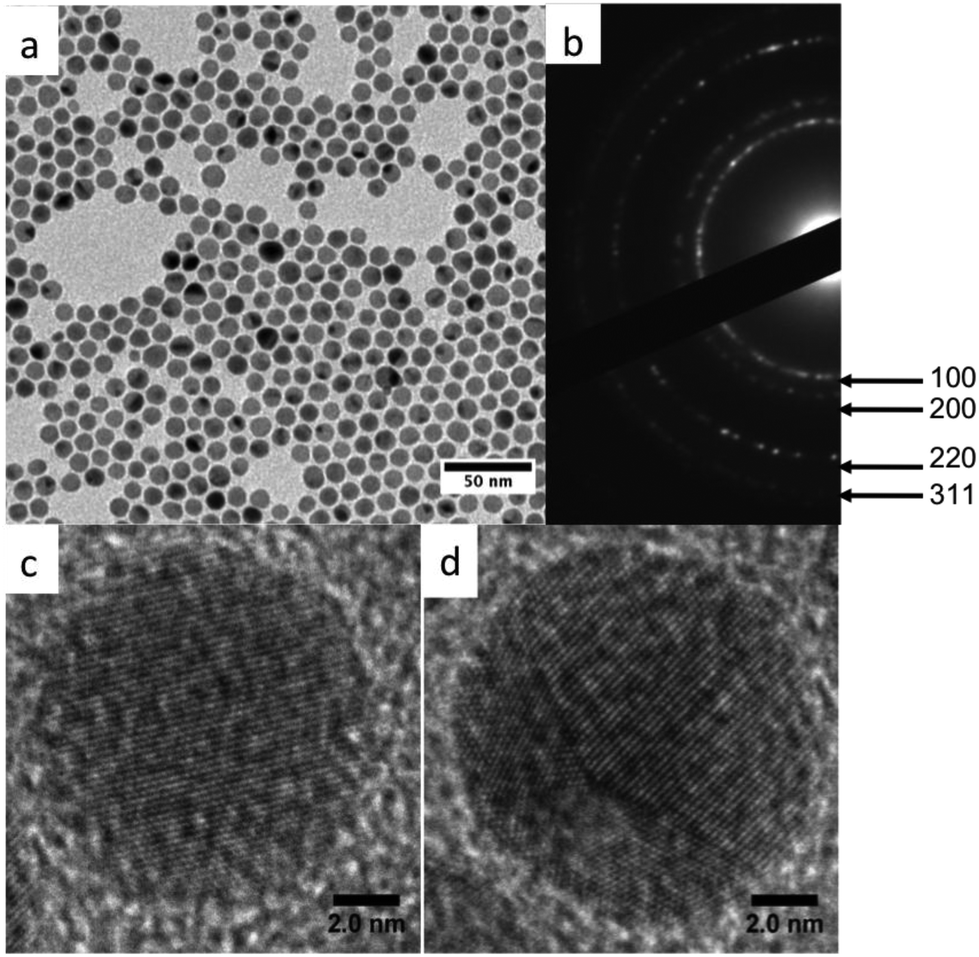 | ||
| Fig. 4 CuNPs synthesized via the reduction of CuCl(PPh3)3 at 100 °C and stabilized by mixed ligands DDA and OA. (a) Typical TEM image, (b) the corresponding selected area electron diffraction (SAED) pattern, (c) HRTEM images of a fcc single crystal and (d) HRTEM images of an icosahedron viewed along the threefold axis. | ||
By decreasing the reaction temperatures to 80 °C and 50 °C and increasing the reaction time to two hours, the average size of CuNPs decreases from 10.7 ± 0.7 nm to 9.7 ± 0.9 nm and then to 3.5 ± 0.4 nm (Fig. 5a–c).
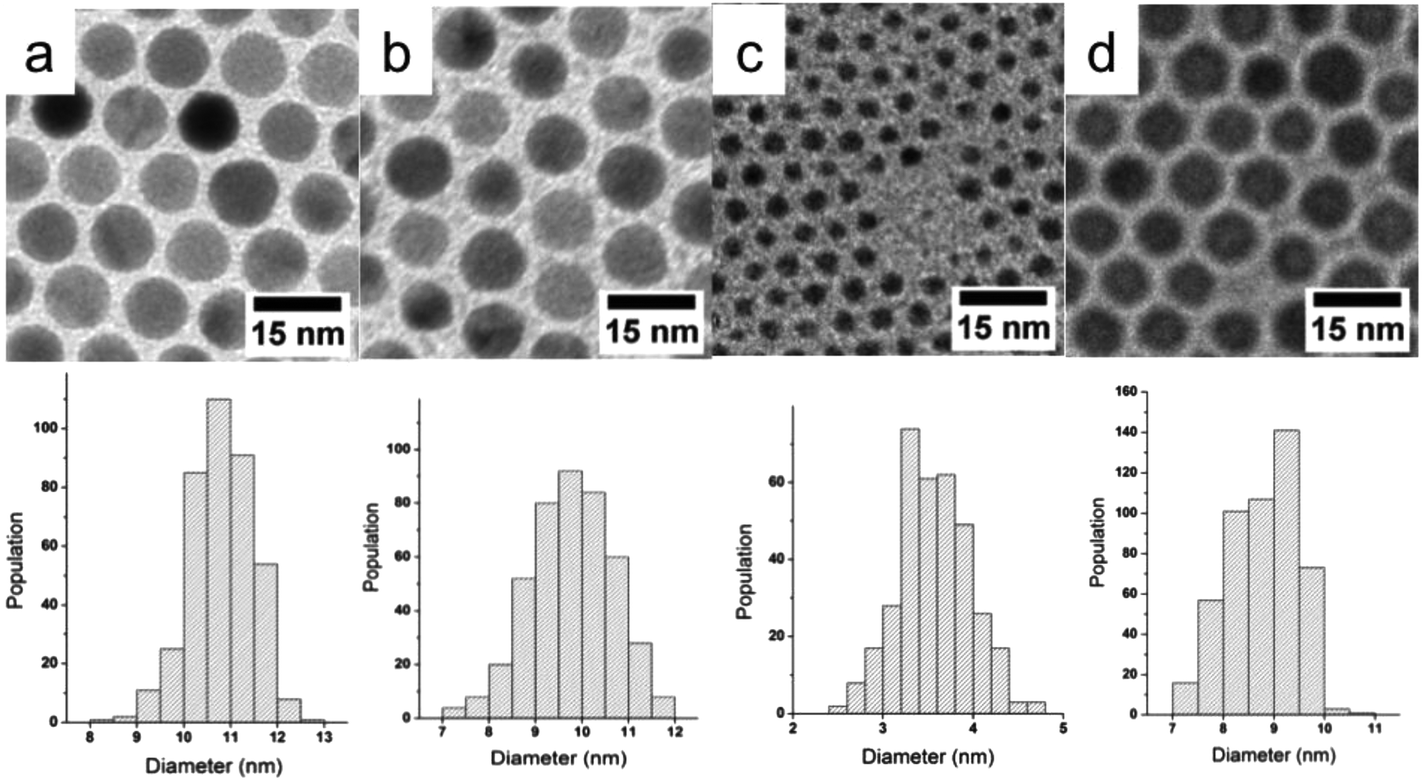 | ||
| Fig. 5 TEM images and size histograms of CuNPs stabilized by mixed ligands dodecylamine/oleic acid and prepared via the reduction of CuCl(PPh3)3 by TBAB (R = (TBAB)/(CuCl(PPh3) = 10)). The molar ratio of dodecylamine to copper during the synthesis process is of ratio 8:1 at (a) 100 °C; (b) 80 °C and (c) 50 °C and (d) of ratio 16:1 at 100 °C. | ||
The growth process is thus clearly facilitated at high temperatures. This temperature effect has been already observed for the synthesis of gold or silver nanoparticles via an organometallic route using a metal–phosphine precursor.19,23 The increase of the reaction temperature favors probably the decomposition of the copper phosphine salt, which can lose one or more PPh3 groups allowing a more rapid precursor reduction by TBAB and then favor the growth of the CuNPs. The identification of phosphine coating the NPs by IR spectroscopy (see above) supports our hypothesis.
:1 to 16:1 for the synthesis at 100 °C, we observe a decrease in the diameter of the synthesized CuNPs from 10.7 ± 0.7 to 8.7 ± 0.7 nm (Fig. 5a and 5d). The increase of the molar ratio between DDA and Cu leads to a better stabilization of the nuclei and thus a slower growth according to the La Mer mechanism.42 This effect of the ligand concentration has been previously observed for the synthesis of silver nanoparticles from a silver–phosphine precursor in the presence of dodecanethiols.23 DDA which is not tightly bound at the surface as dodecanethiols appears sufficient to control the CuNP growth.
3.3. Organization of spherical Cu nanoparticles at long distance
CuNPs coated by mixed ligands DDA/OA have a strong tendency to self-organize due to their uniformity in size and shape (Fig. 1).Highly ordered 2D assemblies at long distance can thus be obtained after placing drops of solution of CuNPs (10.7 ± 0.7 in diameter) on the surface of a bad solvent (diethylene glycol (DEG (Teb = 245 °C))).43 In a typical process, a toluene (Teb = 110 °C) solution (∼20 μL) containing CuNPs coated with DDA and OA (10.7 nm) was spread onto the surface of DEG in a Teflon well (1.5 × 1.5 × 1.5 cm3). The well was then covered with a glass slide to slow down the evaporation of toluene. After 15 min, the film was transferred onto carbon coated copper grid that was further dried under vacuum to remove extra DEG. A long-range (more than 5 μm2) 2D organization without any significant defects is obtained as evidenced by TEM images (Fig. 6a and 6b). More quantitatively the Fourier transform of the image in (b) (PS) (Fig. 6c) displays well-defined spots characteristic of CuNPs organized in a hexagonal network. Furthermore, the presence of the second and third orders confirms a long range ordering. The interparticle distance is of ca. 2 nm, reflecting the length of the aliphatic part of the ligands (1.77 nm for DDA44 and 2.00 nm for OLA).45
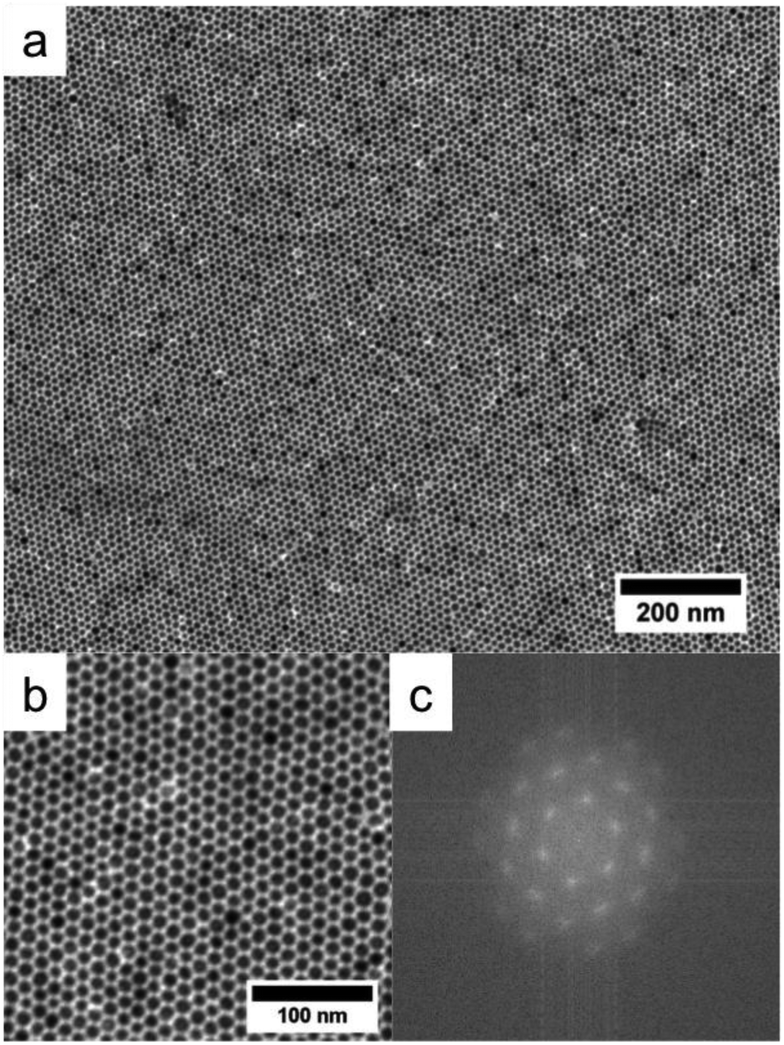 | ||
| Fig. 6 (a) and (b) TEM images at different magnifications of 2D organization of 10.7 nm CuNPs, formed at the DEG interface and transferred on a TEM grid, (c) the Fourier transform of the image in (b). | ||
A similar 2D organization at long range can be obtained on ethylene glycol, also a bad solvent for the CuNPs (Fig. S2a and b of ESI†). Nevertheless, more defects such as holes in the monolayers are observed. This is confirmed by the PS in Fig. S2c of ESI.† Indeed, the spots are more diffuse and we observe only two orders. These organizations are stable (no coalescence) when allowed for eight weeks in the glove box.
3.4. Shape and size control of the CuNPs stabilized by oleylamine and oleic acid
We have studied the influence of the amine chain length on the CuNP formation. We have replaced DDA by OYA and have carried out the syntheses at the same temperatures (50, 80 and 100 °C) for the same reaction times and for the same ratio (R) of TBAB to CuCl(PPh3)3 (R = 10). Note that the TEM analysis has been performed on samples of CuNPs obtained after stabilization with OA and washing with ethanol.By replacing DDA by OYA during the synthesis at 50 °C, we observe an increase in the average size of the spherical nanoparticles from 3.5 ± 0.4 (Fig. 5c) to 7.4 ± 0.7 nm (Fig. 7a and b). By increasing the temperature to 80 °C, small amounts of triangle-shaped particles are observed as can be seen in Fig. 7c. At T = 100 °C, various shapes such as nanorods, triangles, spheres, and nanodisks are observed (Fig. 7d). The percentage of nanoparticles differing in their shapes is determined by counting about 500 particles. It was found that 66% of the particles were spheres or nanodisks, 28% were triangles and 6% were elongated particles.
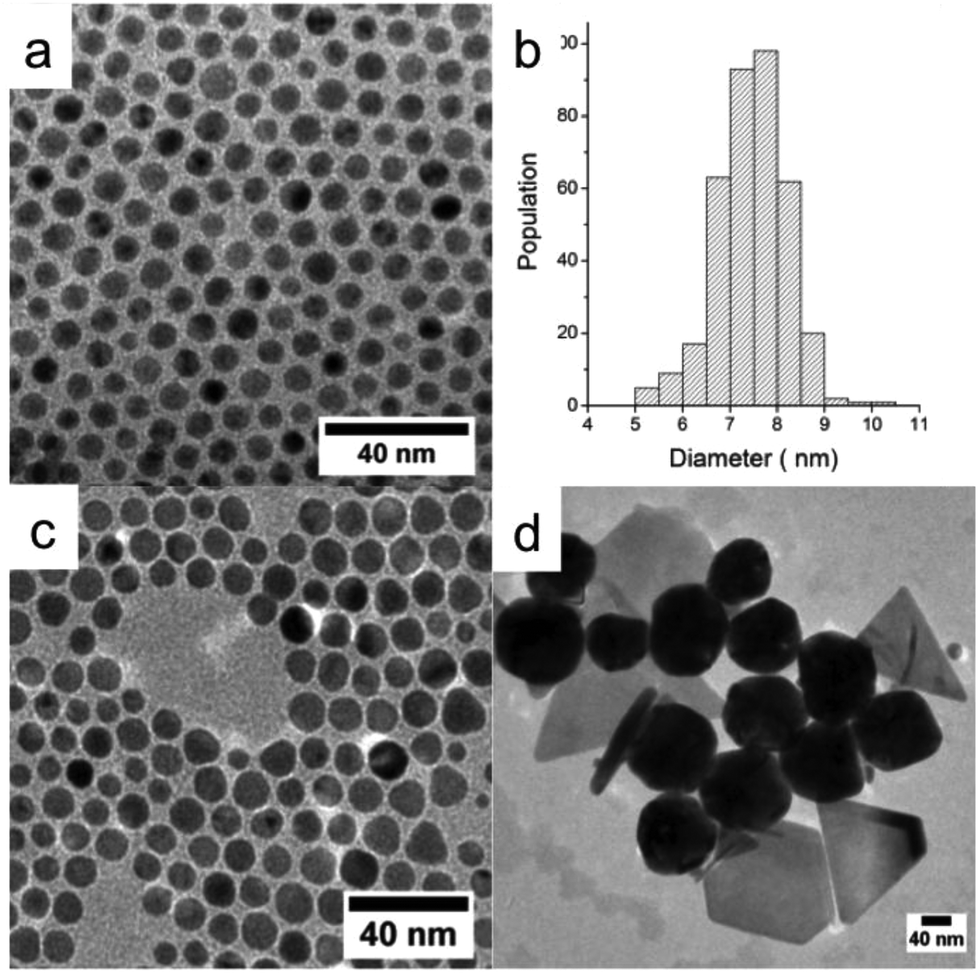 | ||
| Fig. 7 TEM images of CuNPs synthesized via the reduction of CuCl(PPh3) at R = (TBAB)/(CuCl(PPh3)) = 10 in the presence of oleylamine, washed with ethanol, after the addition of oleic acid at different reaction temperatures: (a) 50 °C, (b) size histogram at 50 °C, (c) 80 °C and (d) 100 °C. | ||
These results show clearly that the nature of the amine ligands influence the final size and shape of the CuNPs. By increasing the hydrocarbon chain length of the ligand, the chain–chain interaction between the ligand and the apolar solvent (toluene) increases.46 Since OYA exhibits a longer hydrocarbon chain length than DDA, it thus tends to remain in the solvent that favors the NP growth, and allows the formation at 50 °C of spherical NPs of larger sizes. As expected, by increasing the temperature to 80 and 100 °C, the NP sizes continue to increase. Nevertheless, we also observe the formation of CuNPs of anisotropic shape. It has been reported that obtaining anisotropic shape can be connected to the selective adsorption of Cl− ions on the different crystallographic faces during the growth of CuNPs.47,48 Cl− ions can only be derived from the copper salt precursor. The increase in temperature can thus help to liberate the Cl− ions through the dissociation of the salt. Furthermore, the adsorption of Cl− is favored with OYA in comparison with DDA because of the strong interaction of the long hydrocarbon chain with the solvent.
To probe the role of Cl− ions derived from the salt precursor, we have performed the synthesis of CuNPs at different ratios (R = [TBAB]/[CuCl(PPh3)3]) by varying the concentration of CuCl(PPh3)3 and by maintaining the TBAB concentration constant. The reaction temperature and reaction time were maintained at 100 °C and 1 hour, respectively. Fig. 8 shows the TEM images of CuNPs synthesized at R = 5, 10 and 15.
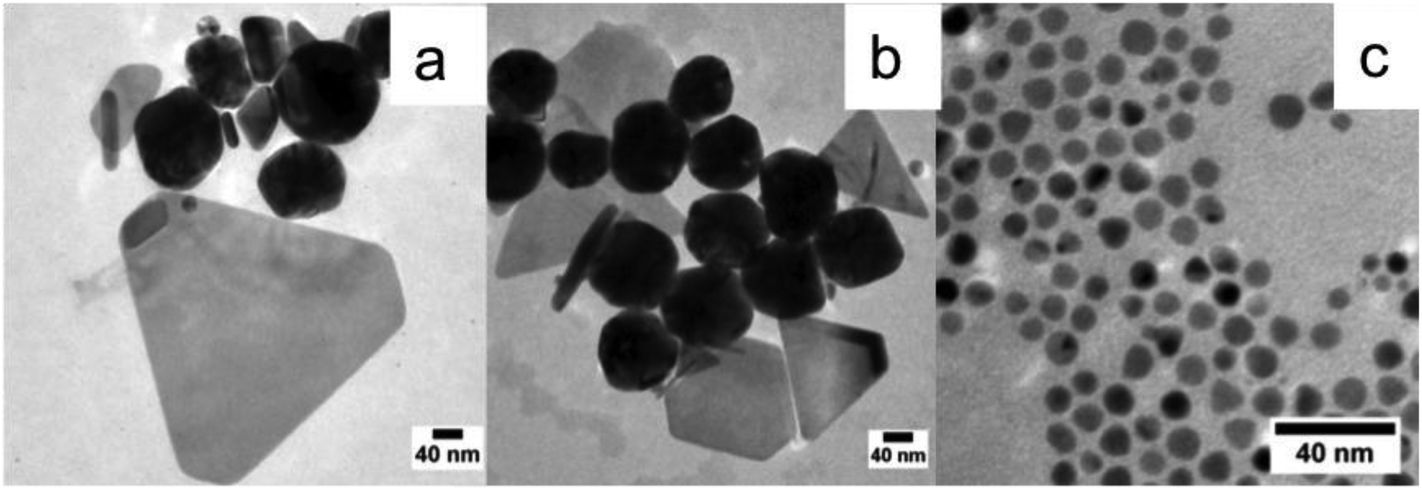 | ||
| Fig. 8 TEM images of CuNPs stabilized by mixed ligands oleylamine and oleic acid and prepared via the reduction of CuCl(PPh3)3 at 100 °C, for different ratios R = (TBAB)/(CuCl(PPh3) with a fixed TBAB concentration: (a) R = 5, (b) R = 10 and (c) R = 15. | ||
When the CuCl(PPh3)3 concentrations decreases from R = 5 (Fig. 8a) to R = 10 (Fig. 8b) and to R = 15 (Fig. 8c), the size of the CuNPs decreases in agreement with a less amount of precursor. Furthermore, at R = 15 many spherical CuNPs appear with few triangles and the nanorods are no longer observed. From these data, it is concluded that the concentration of Cl− induces an important change in the NPs shape with the appearance of nanorods at high Cl− concentration, in agreement with the previous results showing the role of halide ions in controlling the shape of CuNPs.48
4. Conclusion
Small spherical CuNPs with size range (3.5–11 nm) and narrow size distribution (<10%) have been synthesized by the reduction of an organometallic precursor (CuCl(PPh3)3) in the presence of alkyl amines. The addition of OA is clearly shown to stabilize the CuNPs, its adsorption being allowed via an acid–base reaction between OA and free DDA in excess in solution. The temperature and DDA-to-copper precursor ratio are shown to control the final spherical NPs sizes. Because of their narrow size distribution spherical NPs can self-assemble into a long-range 2D hexagonal network on several micrometers. Other CuNP shapes can be synthesized depending on the temperature and reducing agent-to-copper precursor ratio especially for longer amine chains such as OYA. The anisotropic shapes can be connected to the selective adsorption of Cl− ions derived from the precursor on the different crystallographic faces during the growth of CuNPs.Further studies are underway in order to achieve the synthesis of only one type of NP shape (nanorod or triangles) and to study the stability of the CuNPs with exposition time under air. Moreover, obtaining spherical NPs of controlled size and organized at long distance paves the way for the study of their collective physical properties.49–52
Acknowledgements
The authors thank Patricia Beaunier of UPMC, Service de Microscopie Electronique à Transmission. They acknowledge the financial support from the Ministry of Higher Education and Scientific Research (Alternance Grant) and DGRST/CNRS CMCU project (ref. 11G1202).References
- P. Dixit, J. M. Mia and R. Presser, Electrochem. Solid-State Lett., 2006, 9, L16–L16 CrossRef CAS PubMed.
- N. N. Hoover, B. J. Auten and B. D. Chandler, J. Phys. Chem. B, 2006, 110, 8606–8612 CrossRef CAS PubMed.
- H. Kim, S. R. Dhage, D. Shim and H. T. Hahn, Appl. Phys. A, 2009, 97, 791–798 CrossRef CAS PubMed.
- Y. Lee, J. Choi, K. J. Lee, N. E. Stott and D. Kim, Nanotechnology, 2008, 19, 415604–415610 CrossRef PubMed.
- E. J. Zeman and G. C. Schatz, J. Phys. Chem., 1987, 91, 634–643 CrossRef CAS.
- H. Magdassi, M. Grouchko and A. Kamyshny, Materials, 2010, 3, 4626–4638 CrossRef PubMed.
- Y. Wei, S. Chen, B. Kowalczyk, S. Huda, T. P. Gray and B. A. Grzybowski, J. Phys. Chem. C, 2010, 114, 15612–15616 CAS.
- I. Lisiecki and M. P. Pileni, J. Am. Chem. Soc., 1993, 115, 3887–3896 CrossRef CAS.
- M. P. Pileni, B. W. Ninham, T. Gulik-Krzywicki, J. Tanori, I. Lisiecki and A. Filankembo, Adv. Mater., 1999, 11, 1358–1362 CrossRef CAS.
- L. M. Qi, J. M. Ma and J. L. Shen, J. Colloid Interface Sci., 1997, 186, 498–500 CrossRef CAS.
- B. K. Park, S. Jeong, D. Kim, J. Moon, S. Lim and J. S. Kim, J. Colloid Interface Sci., 2007, 311, 417–424 CrossRef CAS PubMed.
- A. Sarkar, T. Mukherjee and S. Kapoor, J. Phys. Chem. C, 2008, 112, 3334–3340 CAS.
- I. Pastoriza-Santos, A. Sanchez-Iglesia, B. Rodriguez-Gonzalez and L. M. Liz-Marzan, Small, 2009, 5, 440–443 CrossRef CAS PubMed.
- H. J. Yang, S. He, H. Chen and H. Tuan, Chem. Mater., 2014, 26, 1785–1793 CrossRef CAS.
- P. Kanninen, C. Johans, J. Merta and K. Kontturi, J. Colloid Interface Sci., 2008, 318, 88–95 CrossRef CAS PubMed.
- A. Courty, J. Phys. Chem. C, 2010, 114, 3719–3731 CAS.
- D. V. Talapin, ACS Nano, 2008, 2, 1097–1100 CrossRef CAS PubMed.
- A. Courty, J. Richardi, P. A. Albouy and M. P. Pileni, Chem. Mater., 2011, 23, 4186–4192 CrossRef CAS.
- N. Zheng, J. Fan and G. D. Stucky, J. Am. Chem. Soc., 2006, 128, 6550–6551 CrossRef CAS PubMed.
- Y. Tang and M. Ouyang, Nat. Mater., 2007, 6, 754–759 CrossRef CAS PubMed.
- H. Portales, N. Goubet, L. Saviot, S. Adichtchev, D. B. Murray, A. Mermet, E. Duval and M. P. Pileni, Proc. Natl. Acad. Sci. U. S. A., 2008, 105, 14784–14789 CrossRef CAS PubMed.
- J. Song, D. Kim and D. Lee, Langmuir, 2011, 27, 13854–13860 CrossRef CAS PubMed.
- A. Andrieux-Ledier, B. Tremblay and A. Courty, J. Phys. Chem. C, 2013, 117, 14850–14857 CAS.
- Z. Yu, L.-S. Tan and E. Fossum, ARKIVOC, 2009, 14, 255–226 Search PubMed.
- G. B. Deacon and J. H. S. Green, Spectrochim. Acta, Part A, 1968, 24, 845–852 CrossRef CAS.
- C. Barriere, K. Piettre, V. O. Latour, C. O. Margeat, B. Turrin, B. Chaudret and P. Fau, J. Mater. Chem., 2012, 22, 2279 RSC.
- J. Zhang and J. Fang, J. Am. Chem. Soc., 2009, 131, 18543–18547 CrossRef CAS PubMed.
- M. Farahmandjou, J. Supercond. Novel Magn., 2012, 25, 2075–2079 CrossRef CAS PubMed.
- A. L. Willis, N. J. Turro and S. O'Brien, Chem. Mater., 2005, 17, 5970–5975 CrossRef CAS.
- D. Mott, J. Galkowski, L. Wang, J. Luo and C.-J. Zhong, Langmuir, 2007, 23, 5740–5745 CrossRef CAS PubMed.
- T. S. Nunney, J. J. Birtill and R. Raval, Surf. Sci., 1999, 427, 282–287 CrossRef.
- G. Westermark and I. Persson, Colloids Surf., A, 1998, 144, 149–166 CrossRef CAS.
- S. M. Barlow, K. J. Kitching, S. Haq and N. V. Richardson, Surf. Sci., 1999, 401, 322–335 CrossRef.
- N. Shukla, C. Liu, P. M. Jones and D. Weller, J. Magn. Magn. Mater., 2003, 266, 178–184 CrossRef CAS.
- D. H. Lee and R. A. Condrate, J. Mater. Sci., 1999, 34, 139–146 CrossRef CAS.
- N. Wu, L. Fu, M. Aslam, K. Chun Wong and V. P. Dravid, Nano Lett., 2004, 4, 383–386 CrossRef CAS.
- Y. Su, X. OuYang and J. Tang, Appl. Surf. Sci., 2010, 256, 2353–2356 CrossRef CAS PubMed.
- C. Noguez, J. Phys. Chem. C, 2007, 111, 3806–3819 CAS.
- S. Link, M. B. Mohamed and M. A. El-Sayed, J. Phys. Chem. B, 1999, 103, 3073–3077 CrossRef CAS.
- M. Green, J. Mater. Chem., 2010, 20, 5797–5809 RSC.
- C. Noguez, J. Phys. Chem. C, 2007, 111, 3806–3819 CAS.
- M. M. Miller and A. A. Lazarides, J. Phys. Chem. B, 2005, 109, 21556–21565 CrossRef CAS PubMed.
- A. G. Dong, J. Chen, P. M. Vora, J. M. Kikkawa and C. B. Murray, Nature, 2010, 466, 474 CrossRef CAS PubMed.
- C. D. Bain, E. B. Troughton, Y. T. Tao, J. Evall, G. M. Whitesides and R. G. Nuzzo, J. Am. Chem. Soc., 1989, 111, 321321–321335 Search PubMed.
- Z. Wang, X. D. Wen, R. Hoffmann, J. S. Son, R. Li, C. C. Fang, D. M. Smilgies and T. Hyeon, Proc. Natl. Acad. Sci. U. S. A., 2010, 107(40), 17119 CrossRef CAS PubMed.
- P. B. Miranda, V. Pflumio, H. Saijo and J. Y. R. Shen, J. Am. Chem. Soc., 1998, 120, 12092–12099 CrossRef CAS.
- S. Link, M. B. Mohamed and M. A. El-Sayed, J. Phys. Chem. B, 1999, 103, 3073–3077 CrossRef CAS.
- A. Filakembo, S. Gerogio, I. Lisiecki and M. P. Pileni, J. Phys. Chem. B, 2003, 107, 7492–7500 CrossRef.
- N. Pinna, M. Maillard, A. Courty, V. Russier and M. P. Pileni, Phys. Rev. B: Condens. Matter, 2002, 66, 045415–045420 CrossRef.
- A. Courty, A. Mermet, P.-A. Albouy, E. Duval and M.-P. Pileni, Nat. Mater., 2005, 4, 395–397 CrossRef CAS PubMed.
- I. Lisiecki, V. Halte, C. Petit, M. P. Pileni and J. M. Bigot, Adv. Mater., 2008, 20, 4176–4179 CAS.
- P. Aubertin, M. A. Ben Aissa, N. Raouafi, S. Joiret, A. Courty and E. Maisonhaute, Nanoresearch, 2014 DOI:10.1007/s12274-014-0650-5.
Footnote |
| † Electronic supplementary information (ESI) available: (1) Synthesis procedure and characterization of the copper precursors by infrared spectroscopy, (2) TEM images of 2D organization of CuNPs deposited at the EG interface. See DOI: 10.1039/c4nr06893a |
| This journal is © The Royal Society of Chemistry 2015 |