 Open Access Article
Efficient screening of 2D molecular polymorphs at the solution–solid interface†
Shern-Long
Lee
a,
Jinne
Adisoejoso
a,
Yuan
Fang
a,
Kazukuni
Tahara
b,
Yoshito
Tobe
*b,
Kunal S.
Mali
*a and
Steven
De Feyter
*a
aDepartment of Chemistry, Division of Molecular Imaging and Photonics, KU Leuven-University of Leuven, Celestijnenlaan 200F, B-3001 Leuven, Belgium. E-mail: Kunal.Mali@chem.kuleuven.be; Steven.DeFeyter@chem.kuleuven.be
bDivision of Frontier Materials Science, Graduate School of Engineering Science, Osaka University Toyonaka, Osaka 560-8531, Japan. E-mail: tobe@chem.es.osaka-u.ac.jp
First published on 27th February 2015
Abstract
Formation of multiple polymorphs during two-dimensional (2D) crystallization of organic molecules is more of a routine occurrence than rarity. Although such diverse crystalline structures provide exciting possibilities for studying crystal engineering in 2D, predicting the occurrence of polymorphs for a given building block is often non-trivial. Moreover, there is scarcity of methods that can experimentally verify the presence of such crystalline polymorphs in a straightforward fashion. Here we demonstrate a relatively simple experimental approach for screening of 2D polymorphs formed at the solution–solid interface. The strategy involves use of solution flow produced by contacting a piece of tissue paper to the sample to generate a lateral density gradient along the substrate surface. In situ generation of such gradient allows rapid discovery and nanoscale separation of multiple 2D polymorphs in a single experiment. The concept is demonstrated using three structurally different building blocks that differ in terms of intermolecular interactions responsible for 2D crystal formation. The method described here represents a powerful tool for efficient screening of 2D polymorphs formed at the solution–solid interface.
Introduction
Polymorphism, the ability of molecules to crystallize in more than one type of packing in the solid state, is no longer a mysterious phenomenon. Last few decades have witnessed an explosive growth in the research on crystal polymorphism as it has profound influence on a variety of material properties such as pharmaceutical activity, pigment quality and solid-state reactivity.1,2 The research on crystal polymorphism has mostly focused on the understanding, control, and separation of the polymorphic forms of organic and metal–organic synthons.1–3 However, despite years of research, scientists have not been able to achieve predictive power over the phenomenon. Thus, there is no convenient method to foresee, simply based on molecular formulae, whether a given molecule will exhibit polymorphism and how many polymorphs it will form. Furthermore, given their isoenergetic nature, separation of polymorphs is often a difficult task.4The challenges associated with polymorphism are not alleviated when working under reduced dimensionality, where molecules undergo the so-called two-dimensional (2D) crystallization. 2D self-assembly,5–8 which is often hailed as a simplified platform for understanding the complications arising in bulk crystallizations, also suffers from formation of multiple 2D crystalline structures. In fact, predicting polymorphism in 2D crystallization occurring at the solution–solid interface is often more complicated due to the nature of the interface itself. A variety of factors such as the temperature,9–13 solvent,14–18 substrate19–22 and solute concentration23–30 influence polymorph formation at the solution–solid interface. Concentration-dependent pattern formation, which is a unique facet of 2D crystallization at the solution–solid interface, is one of the routinely described phenomena. Traditionally, the process of unraveling concentration controlled 2D polymorphs involves preparation of different samples using several concentrations and then characterizing the structure of each polymorph using scanning tunneling microscopy (STM) at the solution–solid interface.23–30 Although this approach has proved beneficial in discovering various polymorphic structures so far, it is often time-consuming and thus there is a pressing need for exploration of methods for rapid and efficient screening of 2D polymorphs.
In this contribution, we describe a relatively simple method for screening of 2D polymorphs formed at the solution–solid interface. The experimental protocol involves contacting a piece of tissue paper to the solution–substrate interface immediately after deposition of the sample solution. This generates a solution flow in the direction of the tissue contact due to absorption of the solution by the tissue paper. Our experiments suggest that, such flow creates a lateral density gradient of molecules on the surface thus revealing several polymorphs, as one maps the substrate surface systematically going away from the tissue contact line using STM. The efficiency of this method lies in the fact that several polymorphs that differ in molecular densities are separated at the nanoscale in a single experiment without a need to scrutinize different solution concentrations. Given the simplicity of the method, we foresee the use of this method as a nanoscale manipulation tool when working with 2D polymorphs formed at the solution–solid interface.
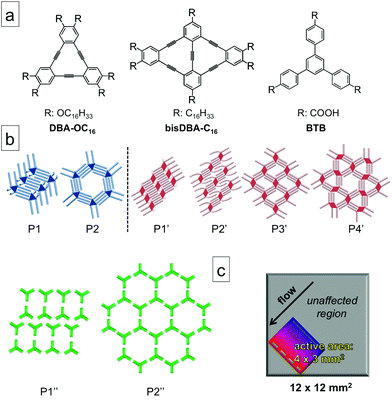
To illustrate the general applicability of the flow method for polymorph screening at the solution–solid interface, three molecules namely, hexadecyloxy substituted dehydrobenzo[12]annulene (DBA-OC16),31 hexadecyl substituted bis(dehydrobenzo[12] annulene) (bisDBA-C16)30 and 1,3,5-tris(4-carboxyphenyl) benzene (BTB),13 were selected as model systems (Scheme 1a). The 2D self-assembly of these molecules at the solution-highly oriented pyrolytic graphite (HOPG) has been documented extensively. They all exhibit concentration-dependent polymorph formation wherein different 2D self-assembled structures (Scheme 1b) are obtained upon varying the concentration of the building block in solution.13,30,31
Results and discussion
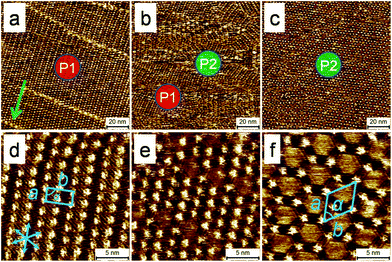
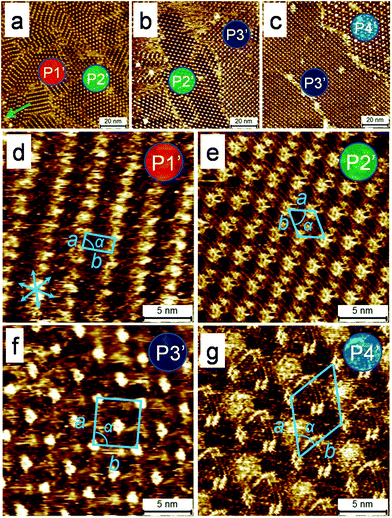
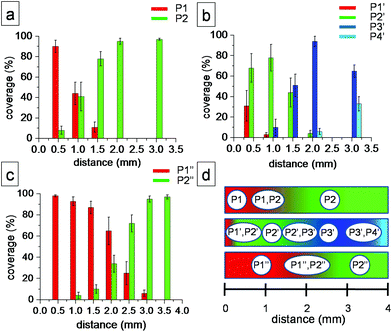
Fig. 1 shows representative STM images of self-assembled network of DBA-OC16 acquired on a sample prepared by employing flow ([DBA-OC16] = 5.7 × 10⁻⁶ M) immediately after drop casting a 1,2,4-trichlorobenzene (TCB) solution of DBA-OC16 on the HOPG surface. These images were obtained by probing the surface at different distances from the tissue contact line by moving the sample parallel to the flow direction away from the contact line. Fig. 1 reveals existence of two different polymorphs, namely linear (P1) and porous (P2), on the surface of HOPG at distances approximately 0.5 and 3 mm away from the tissue contact line, respectively (Fig. 1a and 1c). At intermediate distances, for example 1.5 mm away from the contact line, the two polymorphs were found to coexist (Fig. 1b). These results are in stark contrast to those obtained by simple drop casting of the same solution on HOPG where polymorph P2 was obtained predominantly. In the region outside the active zone depicted in Scheme 1c, the network formation of DBA-OC16 was found to be unaffected by the induced flow and the surface morphology similar to that obtained by drop casting (Fig. S1c in ESI†) was observed. The lattice parameters of P1 and P2 calculated from drift-corrected STM images correlate well with those reported previously23 indicating that the two polymorphs formed under the influence of solution flow are identical to those already reported.To illustrate the applicability of the flow method to more complex systems, bisDBA-C16 (Scheme 1a) was selected since its self-assembly at the TCB/HOPG interface leads to formation of as many as four different polymorphs depending on the concentration in solution.30Fig. 2 shows representative STM images of self-assembled network of bisDBA-C16 formed on the HOPG surface ([bisDBA-C16] = 1.3 × 10⁻⁶ M) after application of flow. Similar to DBA-OC16, flow treatment of the sample affords four different polymorphs (P1′–P4′), which are formed at different distances (ca. 0.5, 1, 2, and 3 mm, respectively) from the tissue contact line. It must be noted that upon drop casting the same solution, self-assembly of bisDBA-C16 yields phase-separated domains of P3′ (81%) and P4′ (19%) and the other two polymorphs are never formed on the surface (Table S1 in ESI†). These results demonstrate an unprecedented ability of the flow method to uncover as many as four different polymorphs in a single experiment on the same solid surface.
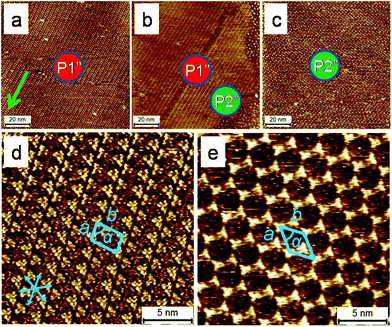
Both the systems described so far consist of supramolecular networks in which the building blocks interact with each other via van der Waals forces between interdigitated alkyl chains. To demonstrate the polymorph screening ability of this method for systems in which the building blocks interact via forces other than van der Waals interactions, a hydrogen bond based system was put to test. BTB (Scheme 1a) is a typical building block known to self-assemble via hydrogen bonding interactions. It forms solvent17 and temperature as well as concentration dependent13 2D polymorphs at the solution/HOPG interface. Application of flow to the sample immediately after drop casting BTB solution in 1-octanoic acid ([BTB] = 6.5 × 10⁻⁶ M) revealed that in the area near the tissue contact line, a densely packed ‘oblique structure’ (P1′′), is formed whereas in the area 3 mm away, a low-density ‘chicken wire’ structure (P2′′) is uniquely observed (Fig. 3). The areas, ca. 2.0–2.5 mm away from the contact line, show coexistence of the two polymorphs. When the sample was prepared via drop casting, exclusive formation of P2′′ was observed. Independent concentration dependent experiments further established that P1′′ and P2′′ exist at relatively high and low concentrations, respectively (Fig. S2 in ESI†).
The results described in the previous paragraphs indicate that application of flow to the solution–HOPG interface creates a density gradient of molecules on the surface such that high density polymorphs are formed near the tissue contact line while further away, the system evolves gradually into relatively lower density structures (Table 1). The surface coverage of each polymorph varies significantly within the active zone for each case. Panels a–c in Fig. 4 show histograms of the relative surface coverage of the polymorphs as a function of distance from the tissue contact line. Finally, for all the three cases investigated, the unit cell parameters of the 2D polymorphs obtained after application of flow (Table 1) agree well with those reported previously.13,17,23,30 This highlights the usefulness of the flow method to screen concentration-dependent polymorphs formed at the solution–solid interface.
| System | P | ρ | N | Unit cell parameters | ||
|---|---|---|---|---|---|---|
| a (nm) | b (nm) | α (°) | ||||
| a ρ = Density (molecules/nm2), N = molecules/unit cell. | ||||||
| DBA-OC 16 | P1 | 0.246 | 2 | 1.9 ± 0.2 | 4.3 ± 0.1 | 86 ± 2 |
| P2 | 0.100 | 2 | 4.7 ± 0.2 | 4.8 ± 0.1 | 62 ± 2 | |
| bisDBA-C 16 | P1′ | 0.169 | 1 | 1.8 ± 0.2 | 3.3 ± 0.3 | 87 ± 2 |
| P2′ | 0.134 | 1 | 3.0 ± 0.2 | 3.1 ± 0.2 | 53 ± 2 | |
| P3′ | 0.091 | 2 | 4.7 ± 0.2 | 4.7 ± 0.1 | 89 ± 2 | |
| P4′ | 0.088 | 3 | 6.2 ± 0.2 | 6.3 ± 0.1 | 62 ± 2 | |
| BTB | P1′′ | 0.355 | 2 | 1.8 ± 0.1 | 3.2 ± 0.2 | 74 ± 2 |
| P2′′ | 0.237 | 2 | 3.2 ± 0.2 | 3.1 ± 0.2 | 59 ± 2 | |
At this juncture, the effect of flow direction on the efficiency of polymorph screening merits special attention. This aspect concerns our previous reports where we employed solution flow for long-range uniaxial alignment of molecular systems. These previous studies revealed that the efficiency of alignment depends on the specific direction along which the flow is applied.32,33 For the results described in the previous paragraphs (for all the three systems), the solution flow was applied along one of the main symmetry directions of the HOPG lattice (e.g., <0110>). Application of flow along the normal to the main symmetry axis of HOPG (e.g., <1121>) leads to virtually the same result where different polymorphs get separated on the surface however, the size of the phase-separated domains is relatively smaller than the case where the flow is applied along the main symmetry direction. These observations are in line with previous results where solution flow was used for inducing large-scale alignment of organic molecules on surface.32,33 The only exception to this observation is polymorph P1′ of bisDBA-C16 which does not show any dependence of the domain size on the flow direction. This behaviour appears to be related to the inherent tendency of the building block to pack inefficiently into such compact structure. P1′ can also be obtained using simple drop casting of concentrated solutions of bisDBA-C16. However, such samples also revealed lack of long-range order for P1′.30 A plausible reason for the relatively smaller domains of P1′ could be the overcrowding of alkyl chains in between molecular rows. These experiments confirm that the generation of density gradient and thus in turn the screening process, is independent of the direction in which the flow is applied (see Fig. S3–S6 in ESI† for details).
The mechanism behind the flow-assisted polymorph separation warrants some scrutiny at this stage. The formation of different molecular polymorphs under the influence of flow is due to the synergistic effect of both thermodynamic as well as kinetic factors. The ‘active zone’ near the tissue contact line where the effective separation of polymorphs takes place, represents an area where kinetic processes operate more efficiently than the thermodynamic ones. On the other hand, 2D crystallization in the areas away from the tissue contact line appears to be governed by thermodynamic factors as it yields results that one would get without the influence of flow. During the tissue-induced flow, a much more dynamic interface is created due to capillary suction. The high dynamics prevalent during the solvent flow forces the molecules to be “pumped” and transported towards areas near the tissue contact line, thereby yielding a lateral density gradient of molecules on the surface as a function of distance from the contact line.
Given that the molecular systems investigated here show concentration dependent structure formation, it is tempting to attribute the observed results to local changes in solution concentration as a function of distance from the tissue contact line. However, the flow is applied to homogenous molecular solutions and during capillary suction one expects the solution ‘as a whole’ (solute + solvent) to be absorbed in the tissue paper. This process will initiate a mass transfer, which will carry the solution towards the tissue contact line. It must be noted that, such mass transfer does not change the relative concentration within the solution. In other words, application of flow does not necessarily create a formal ‘concentration gradient’ in solution. We propose that, given the minimal rate of evaporation, the higher density of molecules on the surface near the tissue contact line plausibly results from the relatively higher number of solute molecules passing over the area as compared to that farther away. This hypothesis however, must be treated with some caution, as a mere increase in the total number of solute molecules that can access the interface at constant concentration does not produce a densely packed polymorph, at least in case of the DBAs. An experiment carried out in absence of solvent flow at low solution concentration revealed that the porous polymorph is formed predominantly irrespective of the volume of the sample solution added to a liquid cell (results not shown here). Although carried out in a different context, these experiments suggest that the fast reorganization dynamics (adsorption–desorption as well as mass transfer) prevalent under the influence of flow critically control the end result of the flow experiments described above.
We do understand that for unknown systems, the choice of concentration will constitute a somewhat ‘grey’ area. For the experiments described above, relatively low solution concentrations were chosen deliberately, to ensure accessibility of the lowest density polymorph. However, the present method is not limited by solution concentration and works equally well for higher concentrations as well. Application of flow to relatively concentrated solution of BTB ([BTB] = 6.5 × 10⁻⁴ M) in 1-octanoic acid yielded a different pair of polymorphs, one of which was previously inaccessible at lower concentration. Fig. S7 in the ESI† shows that the polymorph formed near the tissue contact line consists of rows of BTB molecules standing upright on the HOPG surface. This polymorph has been reported previously by Lackinger et al. and is obtained from saturated solution of BTB in 1-octanoic acid.13 According to the model proposed by them, it consists of densely packed rows of molecules. In the row structure, molecules are stacked face to face and are almost standing upright. The structure is stabilized by intermolecular van der Waals and π–π interactions. Conversely, when flow was applied to a relatively dilute solution ([BTB] = 1.6 × 10⁻⁶ M), it resulted in the formation of polymorphs P1′′ and P2′′ as described earlier. Due to the low solution concentration however, most of the surface remained empty, showing isolated patches of the two polymorphs (Fig. S8 in ESI†). It must be noted that this concentration normally leads to a sub-monolayer surface coverage of the porous polymorph (P2′′) upon drop casting.
An important practical aspect that deserves a special mention is that, the absorption of the solution by the tissue paper leaves the surface almost dry. Once formed, such dry surface does not undergo significant changes due to the scarcity of solvent medium on top. It must be noted however, that the densely packed structures generated under the influence of flow do not necessarily represent equilibrium structures at given (low) solution concentrations. As a consequence, re-solvation of the monolayer by addition of a neat solvent drop reverts it back to the low-density polymorph as illustrated in the case of BTB (Fig. S9 in ESI†).
The ability to screen concentration-controlled polymorphs at the liquid–solid interface as reported here is complementary to our previous report where solvent flow was used to select and stabilize the kinetic form of a 2D crystal formed by a polycyclic aromatic hydrocarbon.34 In the previous study however, the system did not show any concentration-dependent polymorphism thus separating it fundamentally from the present case. The two methods together thus constitute an important approach towards efficient screening of polymorphs at the liquid–solid interface. The influence of solvent, temperature as well as the speed of the flow on the efficiency of screening process remain unresolved areas and are currently under investigation.
In conclusion, we have demonstrated a simple, efficient and versatile method for screening of 2D polymorphs formed at the solution–solid interface. Application of solvent flow enables generation of a density gradient on the substrate surface, which allows phase separation of multiple 2D polymorphs that differ in molecular density as a function of distance from the tissue contact line. Given the routine occurrence of polymorphism in 2D crystallization at the liquid–solid interface, this method represents an eloquent tool to reduce the total number experiments needed to identify polymorphs for a given molecular system assembling in 2D.
Acknowledgements
This work is supported by the Fund of Scientific Research – Flanders (FWO), KU Leuven (GOA 11/003), Belgian Federal Science Policy Office (IAP-7/05) and JSPS KAKENHI Grant Number 10252628, 26620063. This research has also received funding from the European Research Council under the European Union's Seventh Framework Programme (FP7/2007-2013)/ERC grant agreement no. 340324. S.-L.L. is an FWO Pegasus Marie Curie Fellow.Notes and references
- B. Moulton and M. J. Zaworotko, Chem. Rev., 2001, 101, 1629–1658 CrossRef CAS PubMed.
- J. Bernstein, Cryst. Growth Des., 2011, 11, 632–650 CAS.
- M. Kitamura, CrystEngComm, 2009, 11, 949–964 RSC.
- M. B. J. Atkinson, D. K. Bwambok, J. Chen, P. D. Chopade, M. M. Thuo, C. R. Mace, K. A. Mirica, A. A. Kumar, A. S. Myerson and G. M. Whitesides, Angew. Chem., Int. Ed., 2013, 52, 10208–10211 CrossRef CAS PubMed.
- S. De Feyter and F. C. De Schryver, Chem. Soc. Rev., 2003, 32, 139–150 RSC.
- Y. Yang and C. Wang, Chem. Soc. Rev., 2009, 38, 2576–2589 RSC.
- A. Ciesielski, C.-A. Palma, M. Bonini and P. Samorì, Adv. Mater., 2010, 22, 3506–3520 CrossRef CAS PubMed.
- L.-J. Wan, Acc. Chem. Res., 2006, 39, 334–342 CrossRef CAS PubMed.
- M. O. Blunt, J. Adisoejoso, K. Tahara, K. Katayama, M. Van der Auweraer, Y. Tobe and S. De Feyter, J. Am. Chem. Soc., 2013, 135, 12068–12075 CrossRef CAS PubMed.
- C. Marie, F. Silly, L. Tortech, K. Müllen and D. Fichou, ACS Nano, 2010, 4, 1288–1292 CrossRef CAS PubMed.
- D. Rohde, C.-J. Yan, H.-J. Yan and L.-J. Wan, Angew. Chem., Int. Ed., 2006, 45, 3996–4000 CrossRef CAS PubMed.
- A. Bellec, C. Arrigoni, G. Schull, L. Douillard, C. Fiorini-Debuisschert, F. Mathevet, D. Kreher, A.-J. Attias and F. Charra, J. Chem. Phys., 2011, 134, 124702–124707 CrossRef PubMed.
- R. Gutzler, T. Sirtl, J. r. F. Dienstmaier, K. Mahata, W. M. Heckl, M. Schmittel and M. Lackinger, J. Am. Chem. Soc., 2010, 132, 5084–5090 CrossRef CAS PubMed.
- Y. Yang and C. Wang, Curr. Opin. Colloid Interface Sci., 2009, 14, 135–147 CrossRef CAS PubMed.
- T. Sirtl, W. Song, G. Eder, S. Neogi, M. Schmittel, W. M. Heckl and M. Lackinger, ACS Nano, 2013, 7, 6711–6718 CrossRef CAS PubMed.
- W. Mamdouh, H. Uji-i, J. S. Ladislaw, A. E. Dulcey, V. Percec, F. C. De Schryver and S. De Feyter, J. Am. Chem. Soc., 2005, 128, 317–325 CrossRef PubMed.
- L. Kampschulte, M. Lackinger, A.-K. Maier, R. S. K. Kishore, S. Griessl, M. Schmittel and W. M. Heckl, J. Phys. Chem. B, 2006, 110, 10829–10836 CrossRef CAS PubMed.
- S.-L. Lee, Y.-C. Chu, H.-J. Wu and C.-h. Chen, Langmuir, 2011, 28, 382–388 CrossRef PubMed.
- T. Balandina, K. Tahara, N. Sändig, M. O. Blunt, J. Adisoejoso, S. Lei, F. Zerbetto, Y. Tobe and S. De Feyter, ACS Nano, 2012, 6, 8381–8389 CrossRef CAS PubMed.
- F. Klappenberger, M. E. Cañas-Ventura, S. Clair, S. Pons, U. Schlickum, Z.-R. Qu, T. Strunskus, A. Comisso, C. Wöll, H. Brune, K. Kern, A. De Vita, M. Ruben and J. V. Barth, ChemPhysChem, 2008, 9, 2522–2530 CrossRef CAS PubMed.
- N. Katsonis, A. Marchenko and D. Fichou, J. Am. Chem. Soc., 2003, 125, 13682–13683 CrossRef CAS PubMed.
- T. Kudernac, N. Sändig, T. Fernández Landaluce, B. J. van Wees, P. Rudolf, N. Katsonis, F. Zerbetto and B. L. Feringa, J. Am. Chem. Soc., 2009, 131, 15655–15659 CrossRef CAS PubMed.
- S. Lei, K. Tahara, F. C. De Schryver, M. Van der Auweraer, Y. Tobe and S. De Feyter, Angew. Chem., Int. Ed., 2008, 47, 2964–2968 CrossRef CAS PubMed.
- S. Ahn and A. J. Matzger, J. Am. Chem. Soc., 2010, 132, 11364–11371 CrossRef CAS PubMed.
- C. Meier, M. Roos, D. Künzel, A. Breitruck, H. E. Hoster, K. Landfester, A. Gross, R. J. r. Behm and U. Ziener, J. Phys. Chem. C, 2009, 114, 1268–1277 Search PubMed.
- N. Thi Ngoc Ha, T. G. Gopakumar and M. Hietschold, J. Phys. Chem. C, 2011, 115, 21743–21749 Search PubMed.
- X. Zhang, T. Chen, Q. Chen, G.-J. Deng, Q.-H. Fan and L.-J. Wan, Chem. – Eur. J., 2009, 15, 9669–9673 CrossRef CAS PubMed.
- K. S. Mali, M. G. Schwab, X. Feng, K. Mullen and S. De Feyter, Phys. Chem. Chem. Phys., 2013, 15, 12495–12503 RSC.
- B. Zha, X. Miao, P. Liu, Y. Wu and W. Deng, Chem. Commun., 2014, 50, 9003–9006 RSC.
- K. Tahara, S. Okuhata, J. Adisoejoso, S. Lei, T. Fujita, S. D. Feyter and Y. Tobe, J. Am. Chem. Soc., 2009, 131, 17583–17590 CrossRef CAS PubMed.
- K. Tahara, S. Furukawa, H. Uji-i, T. Uchino, T. Ichikawa, J. Zhang, W. Mamdouh, M. Sonoda, F. C. De Schryver, S. De Feyter and Y. Tobe, J. Am. Chem. Soc., 2006, 128, 16613–16625 CrossRef CAS PubMed.
- S.-L. Lee, C.-Y. J. Chi, M.-J. Huang, C.-h. Chen, C.-W. Li, K. Pati and R.-S. Liu, J. Am. Chem. Soc., 2008, 130, 10454–10455 CrossRef CAS PubMed.
- S.-L. Lee, Z. Yuan, L. Chen, K. S. Mali, K. Müllen and S. De Feyter, J. Am. Chem. Soc., 2014, 136, 4117–4120 CrossRef CAS PubMed.
- S.-L. Lee, Z. Yuan, L. Chen, K. S. Mali, K. Müllen and S. De Feyter, J. Am. Chem. Soc., 2014, 136, 7595–7598 CrossRef CAS PubMed.
Footnote |
| † Electronic supplementary information (ESI) available: Additional STM data. See DOI: 10.1039/c4nr06808d |
| This journal is © The Royal Society of Chemistry 2015 |

