 Open Access Article
Adsorption of ciprofloxacin onto graphene–soy protein biocomposites
Yuan
Zhuang
a,
Fei
Yu
b,
Jie
Ma
*a and
Junhong
Chen
*ac
aState Key Laboratory of Pollution Control and Resource Reuse, School of Environmental Science and Engineering, Tongji University, 1239 Siping Road, Shanghai 200092, P. R. China. E-mail: jma@tongji.edu.cn; Tel: +86-21-6598 1831
bCollege of Chemistry and Environmental Engineering, Shanghai Institute of Technology, Shanghai 2001418, China
cDepartment of Mechanical Engineering, University of Wisconsin–Milwaukee, Milwaukee, WI 53211, USA. E-mail: jhchen@uwm.edu
First published on 18th February 2015
Abstract
New biocomposite, porous graphene–soy protein (GS) aerogels were prepared and the influence of protein content on the aerogels and the ciprofloxacin adsorption onto them were studied. The GS aerogels demonstrated good hydrophilicity and possessed abundant functional groups. Cu2+ could improve ciprofloxacin adsorption through coordination with the aerogel GS8.
Antibiotics have received comparatively little attention as pollutants in the aquatic environment, which is surprising because they have a direct biological action on microbes, unlike many other pollutants. Many of these antibiotics are not completely metabolized or eliminated in the body and between 30% and 90% are excreted unchanged into the waste system. The degradation products of these antibiotics can also be considered as contaminants contributing to these complex waste mixtures. There is even some evidence that these degradation products can be as active and/or toxic as the parent antibiotics. The presence of broad spectrum antibiotics like these in aquatic environments, albeit at low concentrations, may pose serious threats to the ecosystem and human health by inducing the proliferation of bacterial drug resistance.1 The annual global application of antibiotics has been estimated to be between 100
![[thin space (1/6-em)]](https://www.rsc.org/images/entities/char_2009.gif) 000 and 200
000 and 200![[thin space (1/6-em)]](https://www.rsc.org/images/entities/char_2009.gif) 000 tons.2 Ciprofloxacin is a highly used second generation fluoroquinolone antibiotic that has a high aqueous solubility at various pH conditions and a high stability in soil and wastewater systems.3,4 Chemically, ciprofloxacin is a 1-cyclopropyl-6-fluoro-4-oxo-7-piperazin-1-yl-quinolone-3-carboxylic acid. Since it has an extended aromatic part and functional groups suitable for hydrogen bonding, it can be expected that this phenolic-type molecule is able to interact strongly with biomacromolecules and that these noncovalent interactions may play a decisive role in its mechanism of action.5
000 tons.2 Ciprofloxacin is a highly used second generation fluoroquinolone antibiotic that has a high aqueous solubility at various pH conditions and a high stability in soil and wastewater systems.3,4 Chemically, ciprofloxacin is a 1-cyclopropyl-6-fluoro-4-oxo-7-piperazin-1-yl-quinolone-3-carboxylic acid. Since it has an extended aromatic part and functional groups suitable for hydrogen bonding, it can be expected that this phenolic-type molecule is able to interact strongly with biomacromolecules and that these noncovalent interactions may play a decisive role in its mechanism of action.5
Carbon materials such as active carbon and carbon nanotubes present unique advantages in adsorption due to their low cost, high adsorption capacity and easy disposal.6,7 In general, it has been found that increasing the oxygen content of samples (i.e., turning the carbon surface more acidic), has detrimental effects on adsorption.8 A dispersive interaction has been reported between the free electron of ciprofloxacin and the delocalized electron in carbon basal planes.9
Electrostatic attraction and hydrogen bonding via the protonated amine and carboxylic groups of ciprofloxacin, respectively, seem to play important roles for adsorption onto the surface of carbonaceous adsorbents.8 Cation exchange has also been reported to be an important interaction for ciprofloxacin disposition.10,11 Moreover, active site competition and/or multilayer adsorption between ciprofloxacin and coexisting metals have rarely been reported in the literature.
In this research, graphene–soy protein (GS) aerogels with different protein content were prepared using a simple thermal reduction method and then used as adsorbents to remove antibiotics from aqueous solutions. The influence of the protein content on material properties was investigated in order to study the combination of graphene and protein. Moreover, the adsorption of ciprofloxacin onto the GS aerogels and the influence of Cu(II) ions on the adsorption were studied and the adsorption mechanism was discussed based on results from FTIR, BET and XAFS studies.
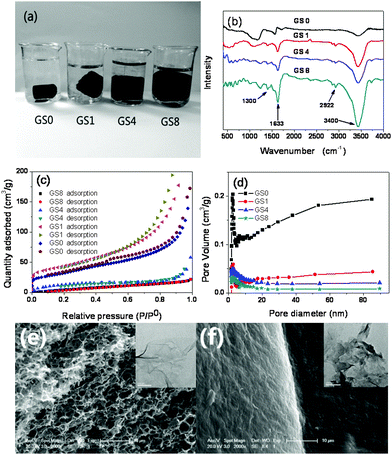
Digital images of GS0, GS1, GS4 and GS8 are shown in Fig. 1a. It can be observed that all of the hydrogels have uniform structures; however, the hydrogels with a higher protein content have much looser structures because the protein in hydrogels can help them to retain more water. As a result, with a higher water content, the hydrogels with a higher protein content have a more porous structure. Fig. 1a also reveals that the protein and graphene combine well in this biocomposite, with the protein preventing the graphene from agglomerating, enabling it to combine with the protein to form a more ordered and larger structure. Fig. 1b shows the FTIR spectra of GS0, GS1, GS4 and GS8. It can be seen that many peaks become stronger when the protein content is higher, indicating that new bonds are formed between the graphene and the protein. The band at 2922 cm−1 is associated with the stretching vibration of the ring methane hydrogen atoms. The broad band around 3400 cm−1 was attributed to O–H stretching vibrations, the strong band at 1227 cm−1 was assigned to C–OH, and the band at 1633 cm−1 was due to carbonyl stretching vibrations (amide I), which indicated that hydrogen bonds are formed between the protein and graphene.16,17 Moreover, it can be seen that with a higher protein content, the hydrogels have more functional groups.
Fig. 1c shows the N2 adsorption–desorption isotherms of GS0, GS1, GS4 and GS8 and their pore size distributions are shown in Fig. 1d. The isotherms of GS0 exhibit a typical type-I shaped curve and a hysteresis loop at a relative pressure of 0.4, indicating the presence of slit-shaped pores between the parallel layers of graphene.18 Although the GS hydrogel primarily contains protein, it shows an obvious increase in N2 adsorption. The specific surface areas of GS0, GS1, GS4 and GS8 were 119.17 m2 g−1, 155.77 m2 g−1, 40.51 m2 g−1 and 30.07 m2 g−1, respectively, as shown in Table 1. As GS1 had a larger specific area than GS0, it indicated that the protein prevented the graphene from agglomerating. Since the protein itself was not porous, GS4 and GS8 had smaller specific areas than that of GS1. The pore size distribution of the GS hydrogels are also shown in Fig. 1d. It can be seen that the GS0, GS1, GS4 and GS8 curves have the same pore volume tendencies and have peaks in the same position at around 2 nm, indicating that the graphene maintains its nanopores in the GS hydrogels. Moreover, because the protein did not close the pores of the graphene, it can be deduced that the combining force between the graphene and the protein may be a hydrogen bond. Fig. 1e and f show the SEM images (inset: TEM images) of GS0 and GS8. It can be seen that GS0 contains more pores than GS8.
| Samples | Specific surface area (m2 g−1) | Average pore size (nm) | Total pore volume (cc g−1) |
|---|---|---|---|
| GS0 | 119.17 | 2.86 | 0.26 |
| GS1 | 155.77 | 3.05 | 0.56 |
| GS4 | 40.51 | 3.91 | 0.02 |
| GS8 | 30.07 | 4.96 | 0.03 |
We then investigated the adsorption capacities of GS0, GS1, GS4 and GS8 for ciprofloxacin, as shown in Fig. 2. As can be seen, the protein content did not have an evident effect on the adsorption, because the protein contributes to adsorption through chemical bonding while the graphene contributes to adsorption mainly due to its abundant pores. Thus, whether the protein or graphene component is dominant, the resulting material can still have a considerable adsorption capacity. However, as the cost of the adsorbent is an important factor for adsorbent evaluation and protein is a biopolymer that is much cheaper than graphene, we calculated the adsorption capacity based on the mass of the graphene in the GS composites. It can be seen that GS8, which has an adsorption capacity of 160 mg g−1, is the best choice. So we chose GS8 for the following batch experiments.
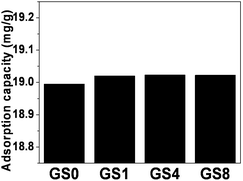 | ||
| Fig. 2 The adsorption capacity of ciprofloxacin onto GS hydrogels with different protein content (25 °C, ciprofloxacin initial concentration 20 mg L−1, solid–liquid ratio 0.5 mg mL−1, 24 h). | ||
The adsorption isotherm of GS8 was calculated using the Langmuir, Freundlich, Temkin, and Dubinin–Radushkevich (D–R) models as shown in Fig. 3a–d and their parameters are shown in Table 2. The good regression coefficients of the Langmuir and Temkin isotherm models represent a good affinity between ciprofloxacin and GS8. The influence of pH and time on the adsorption of ciprofloxacin onto GS8 is shown in Fig. 3e and f. GS8 showed better adsorption capacity under acidic solutions as shown in Fig. 3e. This result was attributed to the charge difference of ciprofloxacin at different pH levels. Under acidic solutions, the ciprofloxacin is positively charged with an electrostatic attraction toward graphene while in alkaline solution the action is repulsion. It can be seen from Fig. 3f that the adsorption capacity reaches equilibrium at around 24 h.
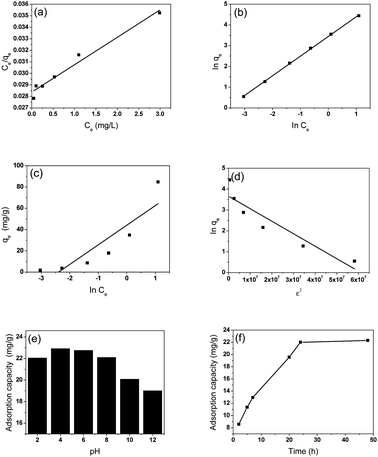 | ||
| Fig. 3 The adsorption isotherms of GS8 using the (a) Langmuir, (b) Frendlich, (c) Tempkin, and (d) D–R models and the influence of (e) pH and (f) time on ciprofloxacin adsorption onto GS8. | ||
| Isotherm | Characteristic | GS8 |
|---|---|---|
| Langmuir | q m (mg g−1) | 500 |
| R 2 | 0.967 | |
| Freundlich | R 2 | 0.999 |
| Temkin | R 2 | 0.740 |
| D–R | R 2 | 0.83 |
The XRD and BET of GS8 before and after adsorption are shown in Fig. 4. In Fig. 4a, it can be seen that a peak around 6° appeared after adsorption, which indicated that the crystal structure of GS8 had changed. Thus, a chemical reaction may have occurred during adsorption. During ciprofloxacin adsorption onto GS8, both π–π and hydrogen bonding played an important role. Electron donor–acceptor interaction is one of the driving forces for the sorption of organic chemicals with benzene rings onto graphene. The benzene rings with fluorine groups act as π-electron-acceptors due to the strong electron withdrawing ability of N and F. The –OH groups on the graphene surface can make the graphene act as an electron donor. Thus, significantly enhanced sorption was expected as a result of the formation of a π–π bond. Moreover, the –COOH group of the ciprofloxacin and the –NH2 groups of the GS hydrogels could form a hydrogen bond between the adsorbents and the adsorbate.19 It can be seen from Fig. 4b that after adsorption the specific area of GS8 was nearly zero, which further proved that pores play an important role in adsorption. It was then believed that the adsorption followed a site to site behavior.
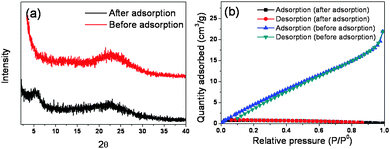 | ||
| Fig. 4 Characterization of GS8 before and after adsorption. (a) XRD pattern and (b) N2 adsorption and desorption curves. | ||
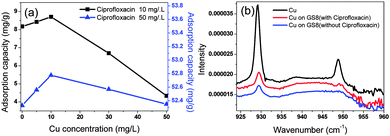
Heavy metals pose potential risks for their impact on environmental quality and human health. Due to the use of copper as a growth promoter in animal feed, copper and antibiotics can coexist in the environment. Hence, we studied the influence of copper on ciprofloxacin adsorption. As shown in Fig. 5a, the ciprofloxacin adsorption capacity increased in certain concentration ranges of Cu because GS8 contains a deprotonated hydroxyl group and an amide group that enables Cu2+ coordination. Cu2+ can also strongly bind with the hydroxyl groups on the surface of ciprofloxacin through ligand-exchange reactions. Therefore, ternary complexes are expected to form among the Cu2+, ciprofloxacin, and GS8 functional groups, resulting in Cu2+-enhanced ciprofloxacin adsorption onto GS8 through cation bridging between the metal ion and ciprofloxacin and the adsorbent ligand groups.20 However, after the Cu concentration exceeded 10 mg L−1, competitive adsorption increased and the adsorption of ciprofloxacin began to decrease. To further investigate the influence of Cu on ciprofloxacin adsorption, we measured the XAFS of Cu, Cu adsorbed onto GS8 and Cu adsorbed onto GS8 with ciprofloxacin, as shown in Fig. 5b. Pure Cu has two characteristic peaks at 929.7 cm−1 and 949.8 cm−1. After the adsorption onto GS8, the peak at 949.8 cm−1 disappeared whether ciprofloxacin co-existed or not, further proving that Cu2+ coordinated with GS8.
Biocomposite porous graphene–soy protein (GS) aerogels with different protein content were prepared by a simple hydrothermal method and then used as adsorbents to remove ciprofloxacin. Batch adsorption experiments were carried out to remove ciprofloxacin from an aqueous solution using the GS aerogels as adsorbents. The GS aerogels demonstrated good hydrophilicity and possessed abundant functional groups, and the protein was able to prevent graphene from agglomerating. For the adsorption of ciprofloxacin onto GS8, both the pores and the functional groups played an important role. At a certain concentration, Cu2+ could improve ciprofloxacin adsorption.
Experimental
All of the chemicals were purchased from Sinopharm Chemical Reagent Co., Ltd (Shanghai, China) in analytical purity and were used in the experiments directly without any further purification. All of the solutions were prepared using deionized water. Graphite oxide was obtained using the modified Hummers' method,12–15 dispersed in deionized water, and sonicated in an ultrasound bath for 12 h. Soy protein and ascorbic acid were added to the GO dispersion and placed into an ultrasound bath for 5 h to form a uniform solution. The mass ratios of graphene to soy protein were 1![[thin space (1/6-em)]](https://www.rsc.org/images/entities/char_2009.gif) :
:![[thin space (1/6-em)]](https://www.rsc.org/images/entities/char_2009.gif) 0, 1
0, 1![[thin space (1/6-em)]](https://www.rsc.org/images/entities/char_2009.gif) :
:![[thin space (1/6-em)]](https://www.rsc.org/images/entities/char_2009.gif) 1, 1
1, 1![[thin space (1/6-em)]](https://www.rsc.org/images/entities/char_2009.gif) :
:![[thin space (1/6-em)]](https://www.rsc.org/images/entities/char_2009.gif) 4 and 1
4 and 1![[thin space (1/6-em)]](https://www.rsc.org/images/entities/char_2009.gif) :
:![[thin space (1/6-em)]](https://www.rsc.org/images/entities/char_2009.gif) 8; the resulting products were denoted as GS0, GS1, GS4 and GS8. The mixture solutions were heated in a water bath at 90 °C for 12 h to form hydrogels. The aerogels were synthesized after the hydrogels were washed with distilled water several times and then freeze-dried for 24 h.
8; the resulting products were denoted as GS0, GS1, GS4 and GS8. The mixture solutions were heated in a water bath at 90 °C for 12 h to form hydrogels. The aerogels were synthesized after the hydrogels were washed with distilled water several times and then freeze-dried for 24 h.
The surface morphologies of GS0 and GS8 were visualized using field-emission SEM (Hitachi, S-4800) and TEM (JEOL, JEM-2010). The surface functional groups were observed using FTIR (NEXUS, 670). Micro-Raman spectroscopic measurements were carried out using a Raman Scope system (LabRam, 1B). XRD patterns were collected on a Bragg–Brentano diffractometer (Rigaku, D/Max-2200). The BET isotherms were measured using an Accelerated Surface Area and Porosimetry system (Micromeritics, ASAP 2020). The fine local structure of Cu was studied using XAFS (Shanghai Synchrotron Radiation Facility, BL08U).
Batch experiments were conducted to evaluate the adsorption performance of ciprofloxacin onto the adsorbents. GS0, GS1, GS4 and GS8 were used as adsorbents for the ciprofloxacin adsorption in an aqueous solution. 100 mg L−1 of a stock ciprofloxacin solution was prepared by dissolving 100 mg of ciprofloxacin in 1 L of deionized water. Working solutions of the required concentrations were obtained by diluting the stock solution with deionized water. All of the sorption tests were conducted in well-capped 100 mL flasks containing 20 mL tetracycline solutions with the required concentration. After adding 10 mg of GS8 aerogel, the flasks were shaken in a thermostatic shaker at 150 rpm at 298 K for 24 h. All of the adsorption experiments were conducted in duplicate, and only the mean values were reported. The maximum deviation for the duplicates was usually less than 5%. Blank experiments without the addition of an adsorbent were conducted to ensure that the decrease in the concentration was actually due to the adsorbent rather than adsorption onto the glass bottle wall. After adsorption, the adsorbent was separated using a 0.45 μm membrane. The residual concentrations in the solution were determined using an ultraviolet spectrophotometer (Tianmei UV-2310(II)) at 270 nm.
Acknowledgements
This research was supported by the National Natural Science Foundation of China (no. 21207100).References
- A. J. Watkinson, E. J. Murby and S. D. Costanzo, Water Res., 2007, 41, 4164–4176 CrossRef CAS PubMed.
- K. Kummerer, J. Antimicrob. Chemother., 2003, 52, 5–7 CrossRef CAS PubMed.
- J. W. D. M. Carneiro and M. T. D. M. Cruz, J. Phys. Chem. A, 2008, 112, 8929–8937 CrossRef CAS PubMed.
- X. Yang, R. C. Flowers, H. S. Weinberg and P. C. Singer, Water Res., 2011, 45, 5218–5228 CrossRef CAS PubMed.
- A. Varshney, Y. Ansari, N. Zaidi, E. Ahmad, G. Badr, P. Alam and R. H. Khan, Cell Biochem. Biophys., 2014, 70, 93–101 CrossRef CAS PubMed.
- I. Cabrita, B. Ruiz, A. S. Mestre, I. M. Fonseca, A. P. Carvalho and C. O. Ania, Chem. Eng. J., 2010, 163, 249–255 CrossRef CAS PubMed.
- H.-H. Cho, B. A. Smith, J. D. Wnuk, D. H. Fairbrother and W. P. Ball, Environ. Sci. Technol., 2008, 42, 2899–2905 CrossRef CAS.
- S. A. Carabineiro, T. Thavorn-Amornsri, M. F. Pereira and J. L. Figueiredo, Water Res., 2011, 45, 4583–4591 CrossRef CAS PubMed.
- S. A. C. Carabineiro, T. Thavorn-amornsri, M. F. R. Pereira, P. Serp and J. L. Figueiredo, Catal. Today, 2012, 186, 29–34 CrossRef CAS PubMed.
- Z. Li, H. Hong, L. Liao, C. J. Ackley, L. A. Schulz, R. A. MacDonald, A. L. Mihelich and S. M. Emard, Colloids Surf., B, 2011, 88, 339–344 CrossRef CAS PubMed.
- C. J. Wang, Z. Li, W. T. Jiang, J. S. Jean and C. C. Liu, J. Hazard. Mater., 2010, 183, 309–314 CrossRef CAS PubMed.
- T. S. Gendy, Y. Barakat and A. I. Mead, Polym. Int., 1994, 33, 247–252 CrossRef CAS.
- M. Hirata, T. Gotou, S. Horiuchi, M. Fujiwara and M. Ohba, Carbon, 2004, 42, 2929–2937 CAS.
- S. Mao, H. H. Pu and J. H. Chen, RSC Adv., 2012, 7, 2643–2662 RSC.
- J. Ma, L. Zhou, C. Li, J. H. Yang, T. Meng, H. M. Zhou, M. X. Yang, F. Yu and J. H. Chen, J. Power Sources, 2014, 247, 999–1004 CrossRef CAS PubMed.
- J. N. Tiwari, K. Mahesh, N. H. Le, K. C. Kemp, R. Timilsina, R. N. Tiwari and K. S. Kim, Carbon, 2013, 56, 173–182 CrossRef CAS PubMed.
- V. Mittal, A. U. Chaudhry and G. E. Luckachan, Mater. Chem. Phys., 2014, 147, 319–332 CrossRef CAS PubMed.
- A. C. Ferrari, Solid State Commun., 2007, 143, 47–57 CrossRef CAS PubMed.
- N. Saikia and R. C. Deka, New J. Chem., 2014, 38, 1116–1128 RSC.
- F. Yu, J. Ma and S. Han, Sci. Rep., 2014, 4, 5326 Search PubMed.
| This journal is © The Royal Society of Chemistry and the Centre National de la Recherche Scientifique 2015 |

