
Semiconductor-based photocatalytic CO2 conversion
Michal
Marszewski
a,
Shaowen
Cao
 b,
Jiaguo
Yu
bc and
Mietek
Jaroniec
*a
b,
Jiaguo
Yu
bc and
Mietek
Jaroniec
*a
aDepartment of Chemistry and Biochemistry, Kent State University, 214 Williams Hall, Kent, OH 44242, USA. E-mail: jaroniec@kent.edu; Fax: +1 330 672 3816; Tel: +1 330 672 2032
bState Key Laboratory of Advanced Technology for Material Synthesis and Processing, Wuhan University of Technology, Wuhan, 430070, P. R. China
cDepartment of Physics, Faculty of Science, King Abdulaziz University, Jeddah 21589, Saudi Arabia
First published on 18th November 2014
Abstract
Climate change and its impact on the Earth and Society has been recently reassessed by the International Panel on Climate Change. The panel estimates that the greenhouse gas emissions should be reduced by half by 2030 to mitigate climate change. Photocatalytic CO2 conversion is one of the promising technologies that can help with this modest goal. This review discusses the theoretical and practical aspects of CO2 conversion over semiconducting photocatalysts and overviews the recently reported CO2 conversion photocatalysts. A spectrum of photocatalysts reviewed in this work includes titania and its composites with metal oxides, metals, and advanced carbon allotropes; other solid photocatalysts, mostly based on germanium, gallium, tungsten, and niobium; graphitic carbon nitride; silver–silver halide plasmonic systems; photocatalytically active metal–organic frameworks; and graphene-based systems. Finally, a summary of the current state and an outlook for the future are provided.
 Michal Marszewski | Michal Marszewski received his MSc degree in the field of chemistry in 2011 from the Faculty of New Technologies & Chemistry at the Military University of Technology (Warsaw, Poland). Currently, he is a PhD candidate in the Department of Chemistry & Biochemistry at Kent State University (Kent, OH, USA). His research interests include the design, synthesis, and characterization of nanostructured materials for environmental and energy-related applications. In his doctoral research, he mainly focuses on titania materials; however, he is also involved in studying silica, carbon, alumina, and metal–organic framework materials; for more information see Michal@LinkedIn.com/in/MichalMarszewski. |
 Shaowen Cao | Shaowen Cao received his BS in Geochemistry in 2005 from the University of Science and Technology of China, and his PhD in Materials Chemistry & Physics in 2010 from the Shanghai Institute of Ceramics, Chinese Academy of Sciences. Then he worked as a Research Fellow at the School of Materials Science and Engineering, Nanyang Technological University until Feb 2014. He is now a Professor at the Wuhan University of Technology. His current research interests include the design and fabrication of photocatalytic materials for energy and environmental applications. See more details on http://www.researcherid.com/rid/I-8050-2013. |
 Jiaguo Yu | Jiaguo Yu received his BS and MS in chemistry from Central China Normal University and Xi'an Jiaotong University, respectively, and his PhD in Materials Science in 2000 from the Wuhan University of Technology. In 2000, he became a Professor at the Wuhan University of Technology. He was a postdoctoral fellow at the Chinese University of Hong Kong from 2001 to 2004, a visiting scientist from 2005 to 2006 at the University of Bristol, a visiting scholar from 2007 to 2008 at the University of Texas at Austin. His current research interests include semiconductor photocatalysis, photocatalytic hydrogen production, CO2 reduction to hydrocarbon fuels, and so on. See more details on http://www.researcherid.com/rid/G-4317-2010. |
 Mietek Jaroniec | Mietek Jaroniec received his MS and PhD from M. Curie-Sklodowska University (Poland) in 1972 and 1976; afterward, he was appointed as a faculty at the same University. Since 1991, he has been Professor of Chemistry at Kent State University, Kent, Ohio (USA). His research interests include interfacial chemistry and chemistry of materials, especially adsorption at the gas/solid and liquid/solid interfaces and nanoporous materials. At Kent State he has established a vigorous research program in the area of nanomaterials such as ordered mesoporous silicas, organosilicas, inorganic oxides, carbon nanostructures, and nanostructured catalysts/photocatalysts, focusing on their synthesis, characterization and environmental and energy-related applications. |
1 Introduction
The International Panel on Climate Change (IPCC) has just released the 5th version of the Assessment Report,1–3 which states beyond doubt the existence of climate change. This report states that the human population and the resulting anthropogenic greenhouse gas (GHG) emissions contribute most to the warming effect.1 Unfortunately, the emissions have been on the rise since the industrial revolution, despite the ongoing reduction efforts. As a result, the ongoing climate change has already had an impact on human health, agriculture, water resources, and ocean and land ecosystems.2 The main GHG sources invariably remain fossil fuel combustion and industrial processes. The IPCC estimates that the effective mitigation of climate change will require cutting the GHG emissions by half by 2030.3 The technologies proposed to achieve this modest goal are renewable and nuclear energy, carbon capture and storage, and broadly defined improvement in energy efficiency. CO2 conversion is one of the future technologies that fits these criteria.CO2 conversion is a process of chemical reduction of carbon dioxide.4,5 The possible products are CO, HCHO, CH3OH, and CH4, depending on the number of transferred electrons (2e−, 4e−, 6e−, and 8e−, respectively). Although reported,6–11 higher hydrocarbons are rarely the product. Naturally, the conversion is an endergonic process (ΔG > 0), considering that a very stable molecule is transformed into high-energy hydrocarbons. The process can be driven by various forms of energy, resulting in different conversion variants such as direct or catalyzed chemical conversion, thermochemical conversion, electrochemical conversion, and photochemical conversion.12,13 The last variant is the most attractive option because it utilizes the sun's radiation as the energy source. In contrast, thermochemical and electrochemical processes require heat or electricity to drive the process. Of course, both of these can be supplied from green and renewable sources; however, the vision of direct conversion of solar energy into useful fuels is so much more appealing.
Photochemical CO2 conversion is a “kill two birds with one stone” approach. The use of CO2 as the feedstock can help with the required emission cuts, while the hydrocarbon products can serve as a green and renewable energy source (solar fuels). The process can consume either atmospheric or man-supplied CO2 to help with its reduction. In the latter case, CO2 feedstock could be supplied from the capture and storage strategy (CCS), yielding even more powerful results. Instead of much less appealing geological storage, CO2 could be reused in the form of solar fuels.14 The latter could render the CCS as a more economical and attractive solution, in addition to solving the CO2 storage problem. Secondly, the produced hydrocarbons have potential to replace the currently used fossil fuels, using the available infrastructure. Particularly, methane is widely used for electricity generation (natural gas power plants), heating, transportation, and as a chemical feedstock. Methanol, on the other hand, is already being tested in flex-fuel cars as a gasoline substitute. Thus, methane and methanol are the most desired products from the economic viewpoint.
Photochemical conversion of CO2 is mostly carried out using solid photocatalysts, which are the sole focus of this review. By far, the most studied materials are semiconducting metal oxides and sulfides; however, a number of other materials have been studied for this purpose, including: graphitic carbon nitride, carbon nanotubes, graphene oxide, plasmonic nanoparticles, and metal–organic frameworks. Table 1 lists the recently reported CO2 conversion photocatalysts, along with the product yield and experimental details. The following section discusses theoretical and practical aspects concerning every solid photocatalyst, before the discussion of specific photocatalytic systems in the third section. Finally, the last section provides a summary of the current state and an outlook for the future. In the intent to keep this review concise, yet informative and leading-edge, the reference selection comprises mostly reports published within the last three years.
| Material description | Material efficiency (μmol g−1 h−1) | Reference efficiency (μmol g−1 h−1) | Normalized efficiency | Experimental details | Ref. |
|---|---|---|---|---|---|
| a Values reported by the authors (no reference data available for calculation of the normalized efficiency). | |||||
| Titania–metal oxide composites | |||||
| Pt–MgO/TiO2 | 11 (CH4) | 0.35 (P25) | 31 | 10 hours, 100 W Xe lamp, 320–780 nm, CO2 at 2.0 MPa | 15 |
| Porous microspheres of MgO-patched TiO2 | 2.1–21.3 (CO) | 2.8–9.9 (P25) | 0.75 (50 °C), 2.2 (150 °C) | 5 hours, temp. range 50–150 °C | 16 |
| Magnesium-modified TiO2 | 1.0 (CH4) | 0.22 (pristine TiO2) | 4.5 | Solar light simulator with an AM1.5 filter, 100 mW cm−2 | 17 |
| Cu2O@Pt core–shell loaded onto TiO2 (Degussa P25) | 33 (CH4), 8.3 (CO), 25 (H2) | 1.2 (CH4, P25), 2.5 (CO, P25), 4.9 (H2, P25) | 28 (CH4), 3.3 (CO), 5.1 (H2) | 200 W Xe lamp (320–780 nm), wet CO2 at 0.2 MPa | 18 |
| Cu2O/TiO2 | 28.4 (CH4, ppm g−1 h−1) | 3.7 (P25, ppm g−1 h−1) | 7.7 | Static experiment, 10 hours, 300 W Xe lamp, wet CO2 at 80 kPa | 19 |
| Hybrid CuO–TiO2−xNx hollow nanocubes | 41.3 (CH4, ppm g−1 h−1) | 16.2 (P25, ppm g−1 h−1) | 2.5 | 300 W Xe lamp with an AM1.5 filter, 100 mW cm−2 | 20 |
| Ordered mesoporous CeO2–TiO2 composites | 1800–2100 (CH4), 12![[thin space (1/6-em)]](https://www.rsc.org/images/entities/char_2009.gif) 000–13100 (CO) 000–13100 (CO) |
220 (CH4, P25), 5500 (CO, P25) | 8.2–9.5 (CH4), 2.2–2.4 (CO) | 300 W Xe arc lamp | 21 |
| Montmorillonite modified TiO2 nanocomposites | 442 (CH4), 103 (CO) | — | 12 (CH4)a, — (CO) | 500 W Hg lamp, UV light, at 100 °C | 22 |
| Ni2+–TiO2 photocatalysts (nickel in NiO form) | 7.7 (CH4), 19.5 (CH3OH) | — | — | UV light, 365 nm, 200 W Hg lamp, 33.42 mW cm−2 | 23 |
|
|||||
| Titania–metal composites | |||||
| Ultrafine Pt nanoparticles on TiO2 single crystals | 1360 (CH4) | 11 (P25) | 124 | Continuous flow, wet CO2, 400 W Xe lamp, 19.6 mW cm−2 in UV range | 24 |
| Cu/TiO2 (P25) nanoparticle catalysts | 0.46–0.65 (CH4), 12–24 (CO) | — | 189 (CH4, P25)a, 10 (CO, P25)a | 6.5 hours, continuous CO2 flow, 150 W solar simulator, 90 mW cm−2 | 25 |
| Ag-doped TiO2 | 0.44 (CH4 + CH3OH) | 0.16 (P25) | 2.8 | 24 hours, 4750 mW cm−2 | 26 |
| Cu and Pt loaded, periodically modulated multiwalled TiO2 nanotube array catalyst | 2.6 (CH4, mL g−1 h−1), 3.5 (total CxHy, mL g−1 h−1) | 0.4 (CH4, pristine titania nanotube array, mL g−1 h−1), 0.5 (total CxHy, pristine titania nanotube array, mL g−1 h−1) | 6.5 (CH4), 7 (total CxHy) | 1 sun AM 1.5 simulated sunlight, wet 99.9% CO2 at 4900 Torr | 6 |
| Au/Pt nanoparticle-decorated TiO2 electrospun nanofibers | 114 (CH4), 17 (CO) | 6 (CH4, pristine TiO2 nanofibers), 12 (CO, pristine TiO2 nanofibers) | 19 (CH4), 1.4 (CO) | 500 W Xe lamp, wet CO2 | 27 |
|
|||||
| Titania–carbon composites | |||||
| TiO2–graphene 2D sandwich-like hybrid nanosheets | 4.6–10.1 (CH4), 7.2–16.8 (C2H6) | 0.69 (CH4, P25), 0 (C2H6, P25) | 6.7–14.6 (CH4) N/A (C2H6) | 300 W Xe arc lamp | 7 |
| Hollow spheres consisting of alternating titania nanosheets and graphene nanosheets | 1.1 (CH4), 8.9 (CO) | 0.69 (CH4, P25), 0.16 (CO, P25) | 1.6 (CH4), 56 (CO) | 300 W Xe arc lamp | 28 |
| MWCNT/TiO2 core–shell nanocomposites | 0.17 (CH4) | 0.03 (pristine anatase TiO2) | 5.7 | Continuous CO2 flow, atmospheric pressure, 15 W light bulb | 29 |
| Solvent-exfoliated-graphene loaded Ti nanosheets | 9.3 (CH4, μmol m−2 h−1) | 2.7 (pristine TiNS, μmol m−2 h−1) | 3.4 | 100 W Hg vapor lamp, 365 nm, 110 W m−2, H2O-saturated CO2, 3 hours | 30 |
| Single-walled carbon nanotube loaded Ti nanosheets | 5.3 (CH4, μmol m−2 h−1) | 2.7 (pristine TiNS, μmol m−2 h−1) | 2 | 100 W Hg vapor lamp, 365 nm, 110 W m−2, H2O-saturated CO2, 3 hours | 30 |
|
|||||
| Pure titania materials | |||||
| Electrospun mesoporous TiO2 nanofibers after solvothermal treatment | 3.08–19.55 | 0.78 (P25) | 4–25 | Ambient temperature and atmospheric pressure, 300 W Xe arc lamp with UV and visible irradiation, CO2 and H2O produced by reacting HCl with NaHCO3 | 31 |
| Anatase TiO2 with coexposed {001} and {101} facets | 1.35 (CH4) | 0.38 (P25) | 3.55 | 300 W simulated solar Xe arc lamp, CO2 and H2O generated in situ by reaction of NaHCO3 and HCl | 32 |
| Bicrystalline TiO2 with controllable anatase–brookite phase content | 1.2 (100% A, CO), 2.1 (75:25 A:B, CO), 0.7 (100% B, CO) |
1.3 (P25) | 0.92 (100% A), 1.6 (75:25 A:B), 0.54 (100% B) |
Continuous wet CO2 flow, 150 W solar simulator, 69.6 mW cm−2 (200–1000 nm) and 12.5 mW cm−2 (200–400 nm) | 33 |
| Hollow anatase TiO2 single crystals and mesocrystals with dominant {101} facets | 1.6 (CH4) | 0.3 (pristine anatase TiO2) | 5.3 | 300 W Xe lamp, wet CO2 at 0.06 MPa | 34 |
| Anatase TiO2 nanosheets with exposed 95% {100} facets | 6 (CH4, ppm g−1 h−1) | 1.2 (cuboid shaped TiO2 with 53% of {100}, ppm g−1 h−1) | 5 | 300 W Xe arc lamp, wet CO2 at 80 kPa | 35 |
|
|||||
| Non-titania photocatalysts | |||||
| Mesoporous 4.5(ZnGa2O4):(Zn2GeO4) | 3.8 (CH4), 22 (O2) | — | 33 (CH4, ZnGa2O4)a, 4.9 (O2, ZnGa2O4)a | UV-enhanced (200 to 350 nm), 300 W Xe arc lamp, wet CO2 | 36 |
| Single-crystalline, ultrathin ZnGa2O4 nanosheets | 6.9 (CH4, ppm h−1) | 0.3 (bulk ZnGa2O4, ppm h−1) | 23 | Ultraviolet enhanced 300 W Xe arc lamp with an IR cut filter + gas pump to accelerate gas diffusion, wet CO2 | 37 |
| ZnGa2O4 nanocubes with exposed {100} facets | 1.2 (CH4), 12 (O2) | 0.18 (CH4, pristine mesoporous ZnGa2O4), 5 (O2, pristine mesoporous ZnGa2O4) | 6.7 (CH4), 2.4 (O2) | UV-enhanced (200 to 350 nm), 300 W Xe arc lamp, wet CO2 | 38 |
| ZnAl2O4-modified ZnGaNO (Pt loaded) | 4.7 (CH4) | 0.9 (pristine ZnGaNO, Pt loaded) | 5.2 | 300 W Xe arc lamp (>420 nm), wet CO2 | 39 |
| Porous Ga2O3 | 0.21 (CH4), 1.5 (CO) | — | 4 (CH4, reference Ga2O3)a | 300 W Xe lamp with an IR cutting filter, 500 mW cm−2, wet CO2 | 40 |
| Zn-doped, Ag-modified Ga2O3 | 117 (CO), 16.9 (H2), 70.1 (O2) | — | — | 1 wt% Ag as co-catalyst, 0.1 M NaHCO3 aqueous solution, CO2 bubbled through the solution at 30 mL min−1, 400 W high-pressure mercury lamp | 41 |
| Mesoporous zinc germanium oxynitride (Pt loaded) | 2.7 (CH4, ppm g−1 h−1) | 1.1 (Pt-loaded bulk material, ppm g−1 h−1) | 2.5 | 300 W Xe arc lamp (>400 nm), wet CO2 at 80 kPa | 42 |
| Cd2Ge2O6 nanowires (RuO2 loaded) | 0.72 (CH4) | — | 2.2 (unloaded Cd2Ge2O6)a | UV-enhanced 300 W Xe arc lamp with a water filter + gas pump to accelerate gas diffusion, wet CO2 | 43 |
| Sheaf-like, hyperbranched Zn1.7GeN1.8O nanoarchitectures (Pt & RuO2 loaded) | 4.4 (CH4) | — | — | 300 W Xe arc lamp (>420 nm), gas pump to accelerate gas diffusion, wet CO2 | 44 |
| Bi2WO6 hollow microspheres | 16.3 (CH3OH) | 0.64 (pristine Bi2WO6) | 25.5 | In aqueous solution at 0 °C, 300 W Xe arc lamp (>420 nm) | 45 |
| Ultrathin, single-crystal WO3 nanosheets | 1.2 (CH4) | 0.09 (commercial WO3) | 13 | Wet CO2, 300 W Xe arc lamp (>420 nm) | 46 |
| Bare rectangular sheet-like WO3 crystals | 0.34 (CH4) | — | — | 300 W Xe lamp (>400 nm), wet CO2 at 0.06 MPa | 47 |
| SiO2-pillared HNb3O8 | 3.8 (CH4) | 1.7 (anatase) | 2.2 | 350 W Xe arc lamp, 34.8 mW cm−2, 60 °C | 48 |
| NaNbO3 photocatalyst | 2.45–5.7 (CH4) | — | — | CO2 at 80 kPa, 300 W Xe arc lamp | 49 |
| NaNbO3 photocatalyst | 1.7–2.9 (CH4) | — | — | CO2 at 80 kPa, 300 W Xe arc lamp | 50 |
| Na2V6O16·H2O nanoribbons co-loaded with Pt and RuO2 | 0.19 (CH4) | 0.0068 (pristine nanoribbons) | 28 | 300 W Xe arc lamp (>420 nm), wet CO2 | 51 |
| Cu2O/RuOx heterojunction photocatalyst | 0.29 (CO) | 0.05 (pristine Cu2O) | 5.8 | 150 W Xe arc lamp, wet CO2, 0.7 M Na2SO3 as a hole scavenger | 52 |
| Ordered mesoporous Fe-doped CeO2 catalysts | 2.9 (CH4), 11 (CO) | 1.2 (CH4, pristine mesoporous CeO2), 6.3 (CO, pristine mesoporous CeO2) | 2.4 (CH4), 1.7 (CO) | 300 W Xe arc lamp with sun-like spectrum, wet CO2 at 30 °C and 110 kPa | 53 |
| In2O3/g-C3N4 hybrid photocatalysts | 1990 (with Pt, ppm h−1 g−1), 958 (without Pt, ppm h−1 g−1) | — | — | 500 W Xe lamp with 1200 mW cm−2 light intensity, wet CO2 | 54 |
| Red phosphor/g-C3N4 heterojunction photocatalyst (Pt loaded) | 295 (CH4) | 145 (r-P), 107 (g-C3N4) | 2 (r-P), 2.8 (g-C3N4) | 500 W Xe arc lamp, wet CO2 | 55 |
| Ag-modified BaLa4Ti4O15 | 1.0 (HCOOH), 14.3 (CO), 33.3 (H2), 23.3 (O2) | — | — | 1.0 wt% Ag, aqueous conditions, CO2 bubbled through the solution at 15 mL min−1, 400 W high-pressure mercury lamp | 56 |
| Layered double hydroxides | 0.5–3.7 (CO), 0.4–6.4 (O2) | — | — | Aqueous conditions, over 10 h, 200 W Hg–Xe lap equipped with fiber optics, a collective lens, and a mirror | 57 |
|
|||||
| Silver–silver halide systems | |||||
| Plasmonic shaped AgX:Ag | 38 (AgCl:Ag, CH3OH), 22 (AgBr:Ag, CH3OH) | — | — | 300 W Xe arc lamp (>400 nm), in water solution, 5 hours | 58 |
| Ag@AgBr/AgCl heterostructured nanocashews | 45 (CH3OH), 66 (CH3CH2OH) | — | — | Visible light (>400 nm), in water solution at 0 °C, 5 hours | 8 |
| Red Ag/AgCl photocatalyst | 29 (CH3OH), 45 (CH3CH2OH) | — | — | 500 W Xe arc lamp (>420 nm), in water solution, 5 hours | 9 |
| Ag@AgBr/CNT nanocomposites | 28.45 (CH4), 17.21 (CH3OH), 2.94 (CO), 7.11 (CH3CH2OH) | — | — | 150 W Xe lamp with a UV cutoff filter (λ > 420 nm), measured light intensity 22.4–25 mW cm−2, 0.2 M KHCO3 solution, agitated with magnetic stirring, vessel pressurized with CO2 to 7.5 MPa | 59 |
| Ternary alloyed AgClxBr1−x nanocrystals | 36 (CH3OH), 72 (CH3CH2OH) | — | — | 500 W Xe arc lamp (>420 nm), in water solution, 5 hours | 10 |
|
|||||
| Metal–organic frameworks | |||||
| Copper porphyrin based metal–organic framework | 263 (CH3OH, ppm g−1 h−1) | 37.5 (unmodified MOF, ppm g−1 h−1) | 7 | Visible light, aqueous solution | 60 |
| Amine-functionalized zirconium metal–organic framework NH2-Uio-66(Zr) | 26.4 (HCOOH) | 16.3 (NH2-MIL-125(Ti)) | 1.6 | 500 W Xe lamp, 420–800 nm, in acetonitrile with triethanolamine | 61 |
| Amine-functionalized titanium metal–organic framework NH2-MIL-125(Ti) | 16 (HCOOH) | — | — | 500 W Xe lamp, 420–800 nm, in acetonitrile with triethanolamine | 62 |
|
|||||
| Other inorganic–organic hybrid systems | |||||
| ZIF-8/Zn2GeO4nanorod composite (Pt loaded) | 0.28 (CH3OH) | 0.14 (pristine Zn2GeO4 nanorods) | 2 | 500 W Xe arc lamp, in 0.1 M Na2SO3 solution, thermostatted | 63 |
| Polymeric-semiconductor–metal-complex hybrid photocatalyst:mesoporous C3N4 loaded with Ru complex (cis,trans-[Ru{4,4′-(CH2PO3H2)2-2,2′-bipyridine}(CO)2Cl2] | 375–483 (HCOOH), 36–75 (CO), 32–43 (H2) | — | — | 20 vol.% triethanolamine in acetonitrile, 450 W high-pressure Hg lamp (>400 nm) | 64 |
|
|||||
| Graphene-based systems | |||||
| Cu2O/reduced graphene oxide composites | 75 (CO, ppm g−1 h−1) | 5.1 (P25, ppm g−1 h−1) | 14 | 150 W Xe lamp, wet CO2, Na2S as a hole scavenger | 65 |
| Graphene oxide | 0.172 (CH3OH) | 0.03 (P25) | 5.7 | Continuous gas flow, 25 °C, 300 W halogen light, wet CO2 | 66 |
| Reduced graphene oxide–CdS nanorods | 2.5 (CH4) | 0.21 (pure CdS nanorods) | 12 | 300 W Xe arc lamp (>420 nm), 150 mW cm−2 | 67 |
| Porphyrin and graphene containing photocatalyst | 170 (C2H2 + CH4, μmol m−2 h−1) | — | — | Wet CO2, solar light simulator, 100 mW cm−2, at 45 °C | 11 |
2 Theoretical and practical considerations
This section discusses the theoretical and practical aspects of photochemical CO2 conversion over a solid photocatalyst. The process requires a chain of specific steps that must occur to complete the conversion. The process starts with adsorption of a CO2 molecule on the photocatalyst surface, where the molecule is susceptible to reduction by photogenerated electrons. These electrons are generated through light absorption, excitation, and charge separation. First, a bound electron in the photocatalyst absorbs a quantum of electromagnetic radiation, provided its energy is equal to or greater than a gap between the valence band (VB) and conduction band (CB). The consumed energy excites the electron from the VB to the CB, leaving a deficit of negative charge in the VB. The latter is referred to as a “hole” and serves as a positive charge carrier. Both charge carriers travel through the photocatalyst, in their respective bands, until they reach the surface. Then the electrons can serve as a reducing agent for the adsorbed CO2 molecules, while the holes can drive a charge-balancing oxidation reaction. After the reduction process, the product molecule (e.g., methane) has to desorb and diffuse to the gas phase to accomplish the whole conversion process. Notably, all these subsequent steps will impact the overall product yield (a measure of photoactivity); thus, understanding their mechanism is crucial for improving the photoactivity.2.1 Adsorption
A seemingly trivial adsorption step is not only the necessity but often the foundation toward improving the photoactivity of solid photocatalysts. If more molecules are adsorbed on the surface, then more quickly electrons can reach and reduce them. The latter results in lower surface recombination (less time spent on the surface) and higher product yield (more electrons consumed per unit time). At equilibrium, the number of adsorbed molecules is determined by equilibrium uptake. During the conversion process, however, CO2 adsorption is not at the equilibrium due to the constant conversion of CO2. Thus, the actual uptake will depend on the equilibrium uptake (driving force) and how fast the molecules can be replenished (gas diffusion and adsorption kinetics). According to adsorption thermodynamics, the equilibrium uptake is a function of: (1) partial pressure of an adsorbate, (2) temperature, (3) surface area, and (4) surface energetics. Clearly, by increasing the CO2 pressure and lowering the temperature one can achieve higher CO2 uptake but these parameters are purely experimental and can be controlled. From the material viewpoint, the surface area and surface energetics are the important aspects.:1 ratio), whilst {001} facets (highly energetic) consist of exclusively 5-coordinated Ti.47 This unsaturated environment results in the improved adsorbent–adsorbate interactions and photoactivity.
Generally, the most stable, low-energy facets dominate the surface to minimize the total surface free energy; however, specific synthetic paths can afford materials with exposed high-energy facets to a high degree. Usually, the desired facets are capped with protecting molecules to deteriorate their activity and favour growth along the low-energy facets. Afterwards, the removal of capping agents results in exposing the highly energetic surface. Unfortunately, the capping molecules are rather dependent on the type of material and facet; for instance, HF is often used to obtain {001} TiO2 facets.73 To achieve the maximum exposure, the materials are structured in the form of nanosheets with the desired facets at the top and the bottom. This arrangement affords as much as 95% of high-energy facets, as well as enlarges the specific surface area.35 So far, {001} facets of anatase have been dubbed the most energetic ones73 but some authors reported varied data: Jiao et al.34 reported TiO2 with {101} facets that performed 5-times better than pristine material and Xu et al.35 reported titania sheets with 95% exposed {100} facets that performed 5-times better than a material with only 53% exposed {100} facets. A similar diversity is noticeable for other compounds as well.37,38,46,47 Although these discrepancies are apparent, the general conclusion holds true that the exposure of specific crystal facets can be used to significantly improve the photoactivity.
2.2 Light absorption, excitation, and charge separation
On the surface of a photocatalyst, CO2 molecules undergo reduction by photogenerated electrons and water undergoes oxidation by holes. To take part in these reactions, the charge carriers have to (1) form through a light absorption and subsequently an electron excitation, and (2) reach the surface. Consequently, these two steps will impact the performance of a photocatalyst.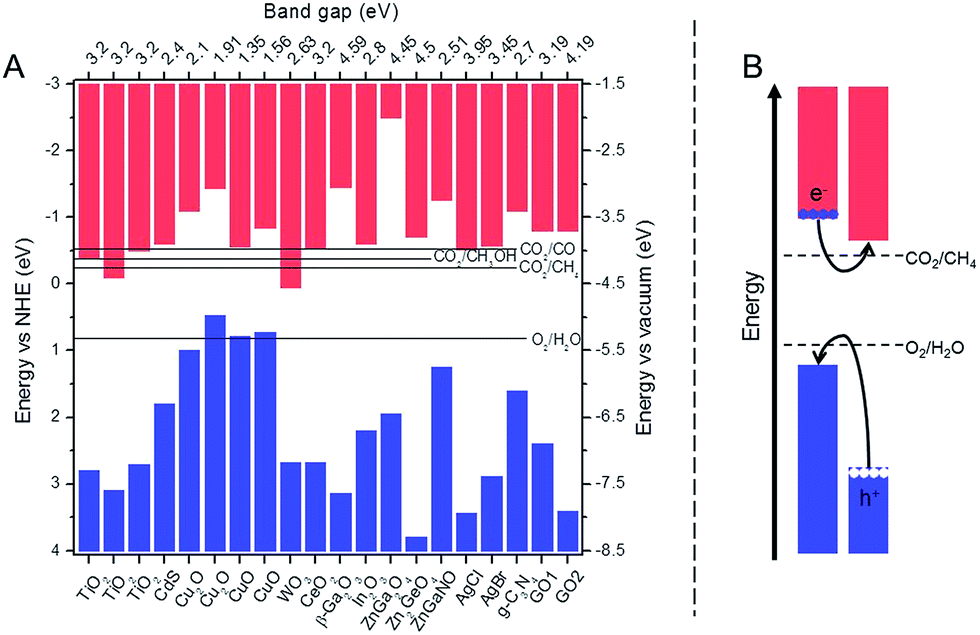 | ||
| Fig. 1 (A) Band edge positions for the selected photocatalysts discussed in this work along with electrochemical potentials for water oxidation and CO2 reduction; the values of CV and VB positions adapted from ref. 11, 19, 24, 36, 39, 40, 46, 54, 58, 65–67 and 74–78 and (B) structure of a heterojunction with good charge separation and improved light absorption. | ||
The time a charge carrier spends in the bulk depends on its mobility and distance to the surface. Thus, a photocatalyst with high carrier mobility and short bulk-to-surface distance will suffer less of bulk recombination. The mobility is rather carrier and material specific but it may be negatively impacted in some cases. Crystal defects and impurities will slow the carriers' transport – either through trapping or scattering – and intensify bulk recombination. Specifically, Ohtani et al.82 investigated a set of amorphous-anatase TiO2 mixtures and showed that the (1) photoactivity of amorphous TiO2 was negligible, (2) photoactivity of the mixtures increased with increasing anatase fraction, and (3) photoactivity of anatase improved upon further calcination. Thus, crystallinity and purity are important in suppressing bulk recombination. Besides, some morphologies – such as nanoparticles, nanorods, nanosheets, and ordered porous materials – allow an easy control over a bulk-to-surface distance. Reducing their dimensions such as diameter, width, and/or pore wall thickness shortens the carriers' path in the bulk and lessens the recombination. Ideally, the path should be infinitely small; however, reduction below an average path length already yields significant improvements. Consequently, a supreme photocatalyst would be of high crystallinity and purity and had a short bulk-to-surface distance. Notably, these two priorities may stand astray as the simultaneous improvement of crystallinity and retention for a nanostructure is often difficult or impossible.83
In contrast, the time spent on the surface depends on how quickly charge carriers are consumed in the redox reactions. The main improvement strategies include an increase in the reactants' uptake and surface area, which were discussed in Section 2.1. Briefly, the accumulation of reactants helps the carriers reach them more quickly; whereas larger surface area lowers the charge carrier surface densities and reduces their encounter probability.
The same effect can develop between two crystal phases of a single compound, which can explain an often-dubbed synergistic effect in mixed-phase materials. TiO2, for instance, has three common crystal phases: anatase, brookite, and rutile that differ slightly in their band gap energy and the VB and CB positions.85 As a result, mixed phases may yield an improved charge separation and thus an improved photoactivity.33
2.3 Desorption
After the reaction, the newly formed products must desorb and transfer to the gas phase. A poor desorption or mass transfer will impact the product yield because (1) adsorbed products occupy a space that could adsorb fresh reactants and (2) products on the surface are susceptible to back and/or side reactions. This part of the process is virtually reversed to the transport and adsorption of the substrate molecules; thus, the same considerations apply. Ideally, the product should quickly desorb after the reaction and transfer from the surface proximity to the bulk of the gas phase.2.4 Concept of the normalized yield and final remarks
To arrive at a rational comparison, we propose to use a normalized yield quantity. The normalized yield is defined as a ratio of the reported photocatalyst yield to the reference photocatalyst yield obtained under the same experimental conditions. We assume that two photocatalysts can be reasonably compared using their normalized yields, if the reference photocatalyst was the same. The widespread use of Degussa P25 as a reference photocatalyst enabled compilation of the P25-normalized yields for many of the materials listed in Table 1. Although convenient, this approach makes two major assumptions (1) photoactivity of Degussa P25 is reproducible and (2) experimental conditions equally affect the photoactivity of all materials. Number 1 implies that a difference in Degussa P25 product yields is purely due to the difference in experimental conditions. Number 2 implies that a change in experimental conditions that caused an n-fold change in the Degussa P25 product yield would cause also an n-fold change in the product yield of the photocatalyst studied. Whereas the first assumption seems plausible as P25 is a well-studied commercial material, the second assumption may not hold in some instances. Mainly, Degussa P25 is active only in UV; thus, changes outside the UV range will be misrepresented unless they equally propagate in the UV range. Still, a comparison of the normalized yields remains more reasonable than the straight comparison of absolute yields. A brief survey of Table 1 shows that the CH4 yields span over five orders of magnitude, whereas the corresponding normalized yields span over two orders of magnitude only. Unfortunately, not all publications report the yield on P25, which is by far the most common for TiO2-related studies. The authors hope that the outlined advantages of the normalized yield will encourage reporting of the P25 yields for all photocatalytic systems.
Finally, it should be mentioned that the catalytic activity often does not change linearly with the amount of catalyst and approaches saturation at high photocatalyst amounts. The reported product yields, expressed per gram of a photocatalyst, represent a best scenario for each photocatalyst, because most often only milligram quantities of the photocatalyst are used in the regime of the highest activity per gram.
Two parameters – photon-to-charge carrier quantum efficiency and CO2-to-product yield – were not discussed in the above example. Although they impact the product yield, their control is not well established. Properties at the heart of catalysis, such as stability, cyclability, turnover number, etc., are not discussed as well. More often than not, publications lack the discussion of these properties, mainly because of their purely exploration nature. The aim of this section was to outline the theoretical and practical aspects of the CO2 conversion process before reviewing the recently reported photocatalytic systems.
3 Materials review
3.1 Titania–metal oxide composites
Titania is by far the most widely studied photocatalyst. Pure TiO2, however, has some strong drawbacks such as poor light absorption. Thus, TiO2 is often combined with other metal oxides (MOs) to afford various composite photocatalysts with superior photoactivity, thanks to improved charge separation,15,19,23 light absorption,19–21,23 structural properties,21–23 and surface chemistry.15–17,23 As discussed in Section 2.2, the charge separation is achieved at the heterojunction between two materials. TiO2–MO composites can take advantage of this effect, if their VBs and CBs are properly matched. In addition, the charge carrier separation results in separation of redox reactions as well, which prevents back and side reactions and benefits the product yield. If incorporated MO has a smaller band gap than TiO2, it will improve the composite's light absorption. Importantly, the VBs and the CBs must be well matched to achieve simultaneous charge separation and improved light absorption. If the incorporated MO is nanostructured, it is beneficial for structural parameters – surface area and/or porosity – of the composite. Otherwise, if either TiO2 or MO is in a bulk form, it negatively impacts the structural properties. Finally, the surface chemistry of the incorporated MO may be more favourable than TiO2; for instance, basic MOs can improve CO2 adsorption properties if incorporated in the framework or deposited on the surface of TiO2. Depending on the MO used, the composite may take advantage of one or more of these benefits. The most common MOs reported in the recent literature are MgO15–17 and CuxO18–20,86 but other MOs, such as NiO23,87,88 and CeO,21 are reported as well.Xie et al.15 investigated various metal oxides deposited on TiO2/Pt, including: MgO, SrO, CaO, BaO, La2O3, and Lu2O3 and found that the basicity had a strong impact on the CH4 yield (see Fig. 2A). All MO–TiO2 composites showed an increase in the CH4 yields; in particular, the MgO–TiO2 composite showed the highest yield. The authors attributed this result to chemisorption of CO2 on MgO patches that concentrated and destabilized CO2 molecules to be more reactive. In addition, the authors discussed a possibility of charge separation between Pt and MgO and inhibition of CH4 oxidation as a result. Liu et al.16 observed an increase in the product yield over MgO-patched TiO2 microspheres as well (see Fig. 2B); however, the detected product was CO instead of CH4. This difference may have been due to the lack of Pt loading or the elevated temperature used for conversion of CO2 (50–150 °C).
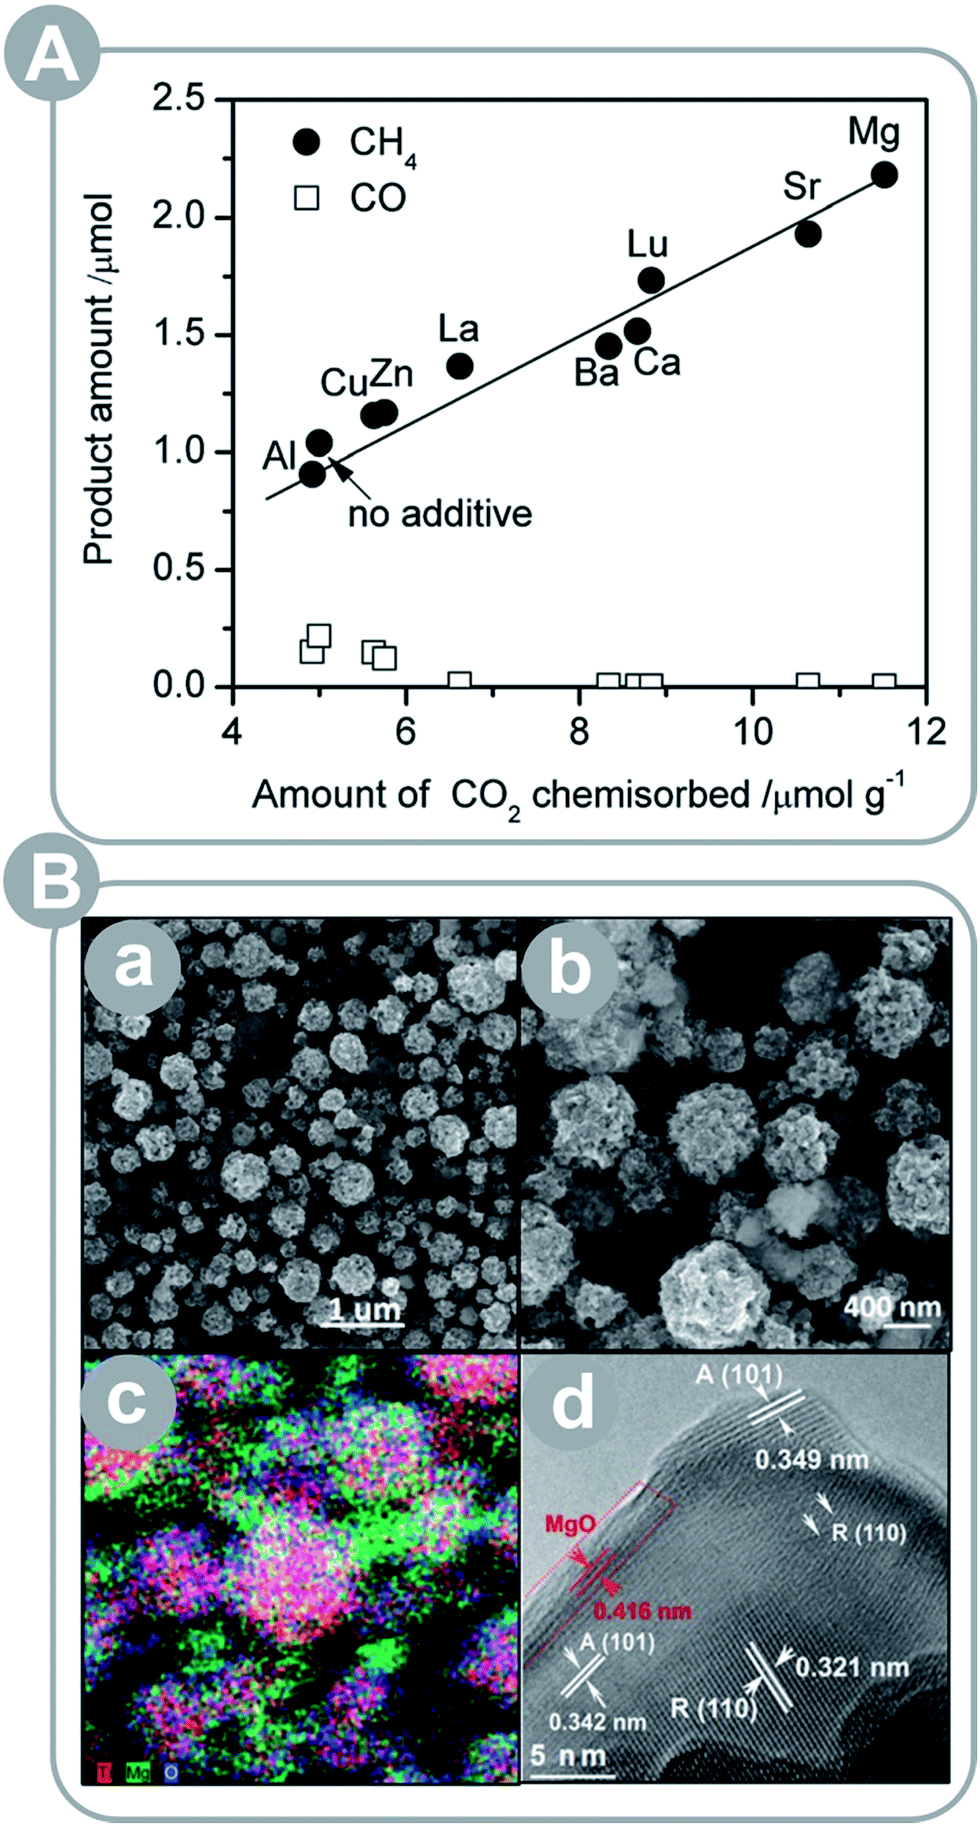 | ||
| Fig. 2 (A) Product yield (CH4 and CO) plotted as a function of CO2 uptake for a series of Pt–TiO2 photocatalysts modified with basic metal oxides (reprinted with permission from ref. 15. Copyright The Royal Society of Chemistry 2013); (B) porous MgO-patched TiO2 microspheres: (a and b) SEM images, (c) elemental mapping, and (d) HRTEM images (reprinted with permission from ref. 16. Copyright The Royal Society of Chemistry 2013). | ||
Xu et al.19 prepared the Cu2O–TiO2 photocatalyst by loading porous TiO2 with Cu2O. Copper(I) oxide has a band gap of 2.0–2.2 eV, effectively absorbing the visible light, and its VB and CB are well matched to create a heterojunction with TiO2. As a result, Cu2O–TiO2 composites benefit from both charge separation and better light harvesting. In addition, the authors structured the material to shorten the distance from the bulk to the surface by using porous TiO2 and Cu2O nanoparticles. The resulting structure had a large specific surface area (206 m2 g−1) and pore volume (0.29 cm3 g−1). Although the surface area and pore volume increased only slightly after Cu2O loading, the CO2 uptake increased by more than 2-fold as compared to pure TiO2. All these factors improved the charge separation, light absorption, CO2 uptake, surface area and porosity, which resulted in over 7-fold higher CH4 yield as compared to the Degussa P25 catalyst (and pure TiO2).
Zhai et al.18 prepared a Pt and Cu co-loaded TiO2 photocatalyst through photoreduction of H2PtCl6 and CuSO4 in two subsequent steps. This unique approach resulted in the deposition of Pt nanoparticles on the P25 surface in the first step and reduction of Cu on these nanoparticles in the second step. The final material consisted of Cu2O–Pt core–shell structures loaded on the TiO2 surface. The material scored an impressive 28-fold higher CH4 yield than the original Degussa P25. The authors concluded that the Cu2O layer helped to destabilize CO2 molecules and suppressed the concurrent H2O reduction over Pt, while the Pt core served as a collector of electrons.
In et al.20 prepared a CuO–TiO2−xNx photocatalyst with hollow cube morphology through a facile multi-template strategy (see Fig. 3). The authors compared it with the CuO–TiO2 composite prepared through traditional impregnation, and with Degussa P25. Interestingly, the hollow cubes had the lowest specific surface area of all three materials: 24 m2 g−1 (CuO–TiO2−xNx), 31 m2 g−1 (CuO–TiO2), and 50 m2 g−1 (Degussa P25). Yet, the cubes showed a 2.5-fold higher product yield compared to Degussa P25 and 1.6-fold higher compared to plain CuO–TiO2. This improvement may be attributed to the nitrogen doping and/or hollow cube morphology.
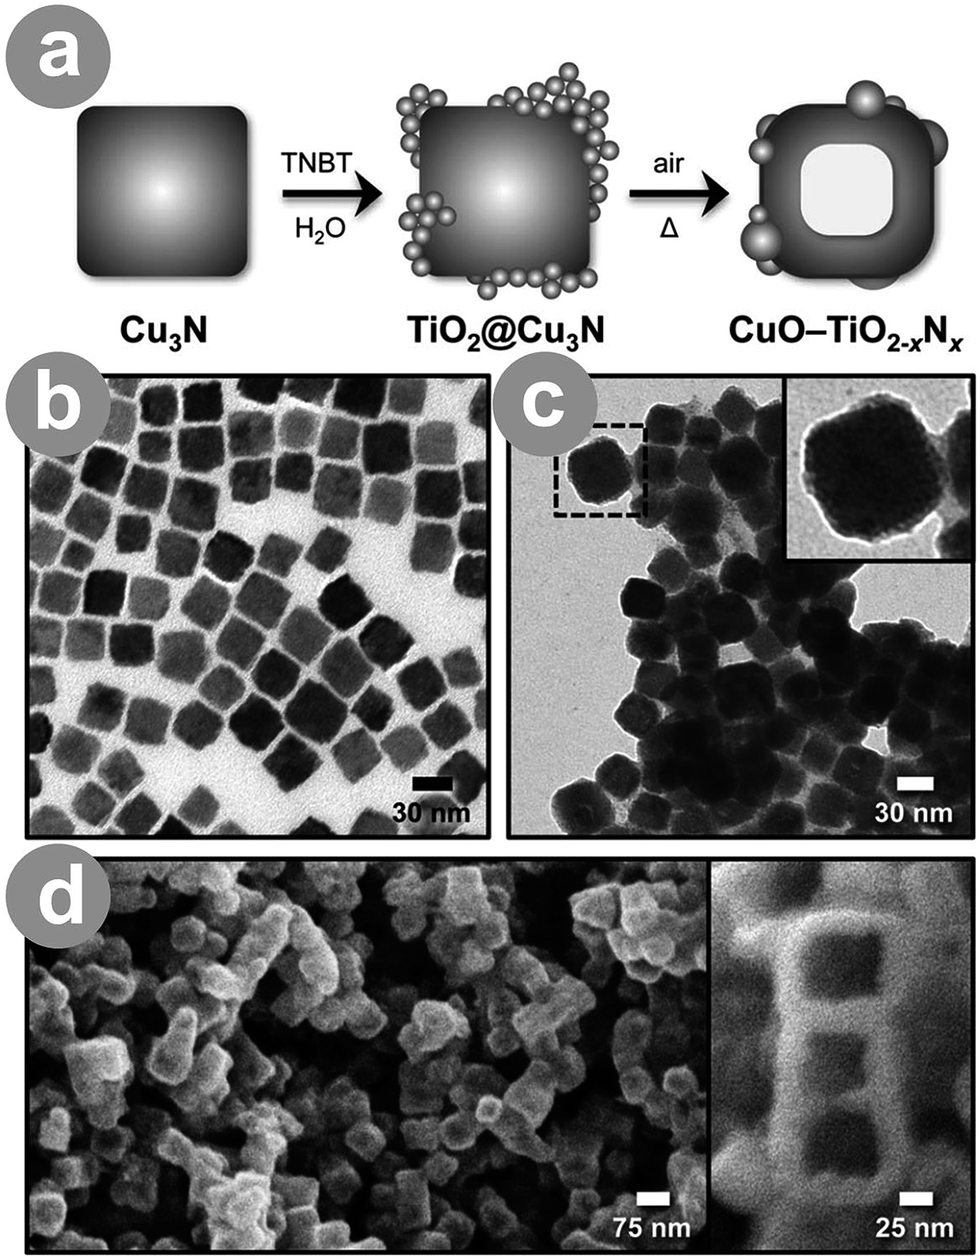 | ||
| Fig. 3 (a) Schematic illustration of the multistep template strategy that afforded CuO–TiO2−xNx hollow cubes (TNBT = titanium n-butoxide); (b) TEM image of Cu3N nanocubes; (c) TEM image of TiO2@Cu3N; and (d) FESEM images of CuO–TiO2−xNx hollow nanocubes (reprinted with permission from ref. 20. Copyright Wiley-VCH 2012). | ||
Wang et al.21 prepared CeO2–TiO2 nanostructured photocatalysts through nanocasting using ordered mesoporous silica, SBA-15, as a template. Incorporation of CeO2 extended the absorption from the UV to the visible range and narrowed the band gap to 2.16–2.24 eV. Interestingly, even pure nanocast TiO2 showed a narrowed band gap of 2.81 eV. Only Degussa P25 showed a close-to-usual value of 3.10 eV. In addition, due to the nanostructuring effort, the resulting materials had a large specific surface area of 140–180 m2 g−1 and pore volumes of 0.53–0.61 cm3 g−1. The materials achieved up to 9.5-fold higher CH4 yield and up to 2.4-fold higher CO yield as compared to Degussa P25.
3.2 Titania–metal composites
Metals can improve the photoactivity of TiO2 as well, which is mainly achieved through charge separation6,24–27 and/or plasmon-enhanced photocatalysis.27 Metals, as good conductors, readily accept electrons, serving as an electron sink. The electron withdrawal results in the charge separation, which benefits the conversion process. In addition, some metal nanoparticles exhibit surface plasmon resonance, which may be used to improve the photocatalyst's light harvesting efficiency. The resulting plasmon-enhanced photocatalysis is typically explained by either: (1) the charge transfer mechanism or (2) local electric field enhancement; however, there seems to be no definite agreement on this issue. Ref. 89 provides a good insight into the theoretical and practical aspects of this phenomenon. Often, metals are incorporated as a necessary co-catalyst, resulting in a product that would not be produced otherwise. Among all the reported metals, the noble metals – Pt,6,24,27 Au,27 Ag,26 and Cu6,25 – seem to be employed the most often.The size and structure of both TiO2 material and loaded metal have a crucial effect on the photocatalytic activity. The latter was accentuated by Wang et al.24 who prepared films composed of 1D TiO2 single crystals and ultrafine Pt nanoparticles (0.5–2 nm; see Fig. 4). The films achieved extraordinary 124-fold higher yield than Degussa P25, which was attributed to the charge separation on well dispersed Pt particles and fast electron transfer within 1D single crystals. Zhang et al.6 prepared a periodically modulated multi-walled TiO2 nanotube array through pulse anodization of the Ti substrate. The array loaded with Cu and Pt showed a 6.5-fold higher yield compared to the pristine nanotubes.
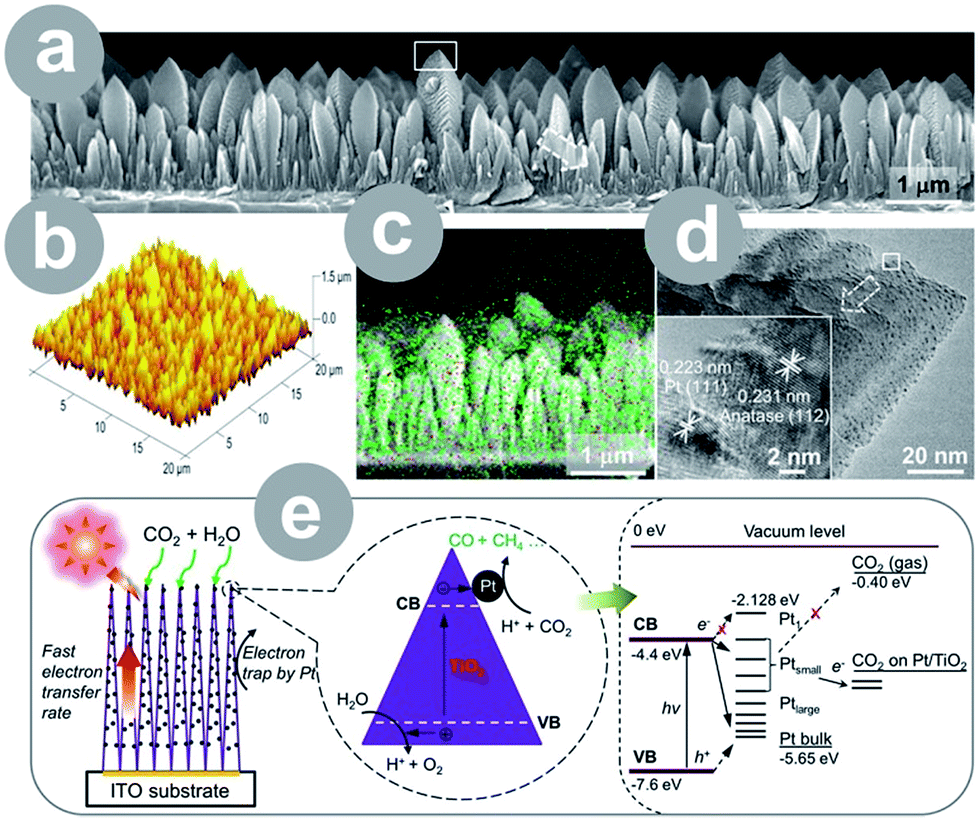 | ||
| Fig. 4 1D single-crystal TiO2 thin film loaded with ultrafine Pt nanoparticles: (a) FESEM image (white rectangle indicates the position of the TEM image); (b) AFM image; (c) elemental mapping (green = Ti and red = Pt); (d) TEM images (white rectangle indicates the position of the HRTEM); (e) schematic illustration of the conversion process and energy level diagram (CB = conduction band; VB = valence band; H+ = proton; h+ = hole; reprinted with permission from ref. 24. Copyright American Chemical Society 2012). | ||
Synergistic effects are very important as well. Electrospun TiO2 fibres decorated with Au and Pt27 showed a modest 19-fold increase in CH4 yield, which was due to the combined effect of charge separation on Pt and plasmon enhancement of Au. Liu et al.25 prepared a Cu-loaded TiO2 photocatalyst through a simple precipitation method. The precipitated material contained Cu2+ species and was thermally treated in He and H2 to reduce copper, resulting in a mix of Cu+ and Cu0 species. Both these copper species can enhance the TiO2 performance by improved light absorption, charge separation, and surface chemistry. The synergistic effect of Cu+ and Cu0 resulted in a whopping 189-fold higher CH4 yield as compared to Degussa P25.25
3.3 Titania–carbon composites
Advanced carbon allotropes (ACAs) are appealing alternatives for improving the photoactivity of TiO2. Especially graphene7,28,30 and carbon nanotubes29,30 have been used to improve CO2 conversion because of their well-developed surface area and attractive optical and electrical properties. The electronic properties depend on the specific allotrope: graphene is a conductor on a par with metals, while graphene oxide shows semiconducting properties, and carbon nanotubes are either conducting or semiconducting depending on their structure. As a result, ACAs can substitute both metals and metal oxides in TiO2 composites due to their flexible, tunable, and potent electronic properties. In addition, their large surface area benefits the conversion process in more than one way, as discussed in detail in Section 2. Finally, the light absorption of ACAs often extends to the visible range, allowing for improved light harvesting of TiO2–ACA composites. Thus, the ACAs improve charge generation, separation, and transport, and possess a large surface area where the substrates and charge carriers can be collected and reacted.Liang et al.30 showed a very interesting effect of ACA dimensionality on the photoactivity of TiO2–ACA (see Fig. 5). The authors prepared two types of titania nanosheet–ACA composites: one with carbon nanotubes (1D) and the second with graphene (2D). The authors observed higher photoluminescence quenching in the graphene composite, which implies a better charge separation, presumably due to the favourable orientation and electronic coupling of the sheets. The latter resulted in superior product yield under UV light illumination. Under visible light illumination, however, the nanotube composite scored the higher result. This was because of the sensitization of TiO2 by carbon nanotubes – which exhibited strong absorption in visible light and resulted in a greatly improved light harvesting.
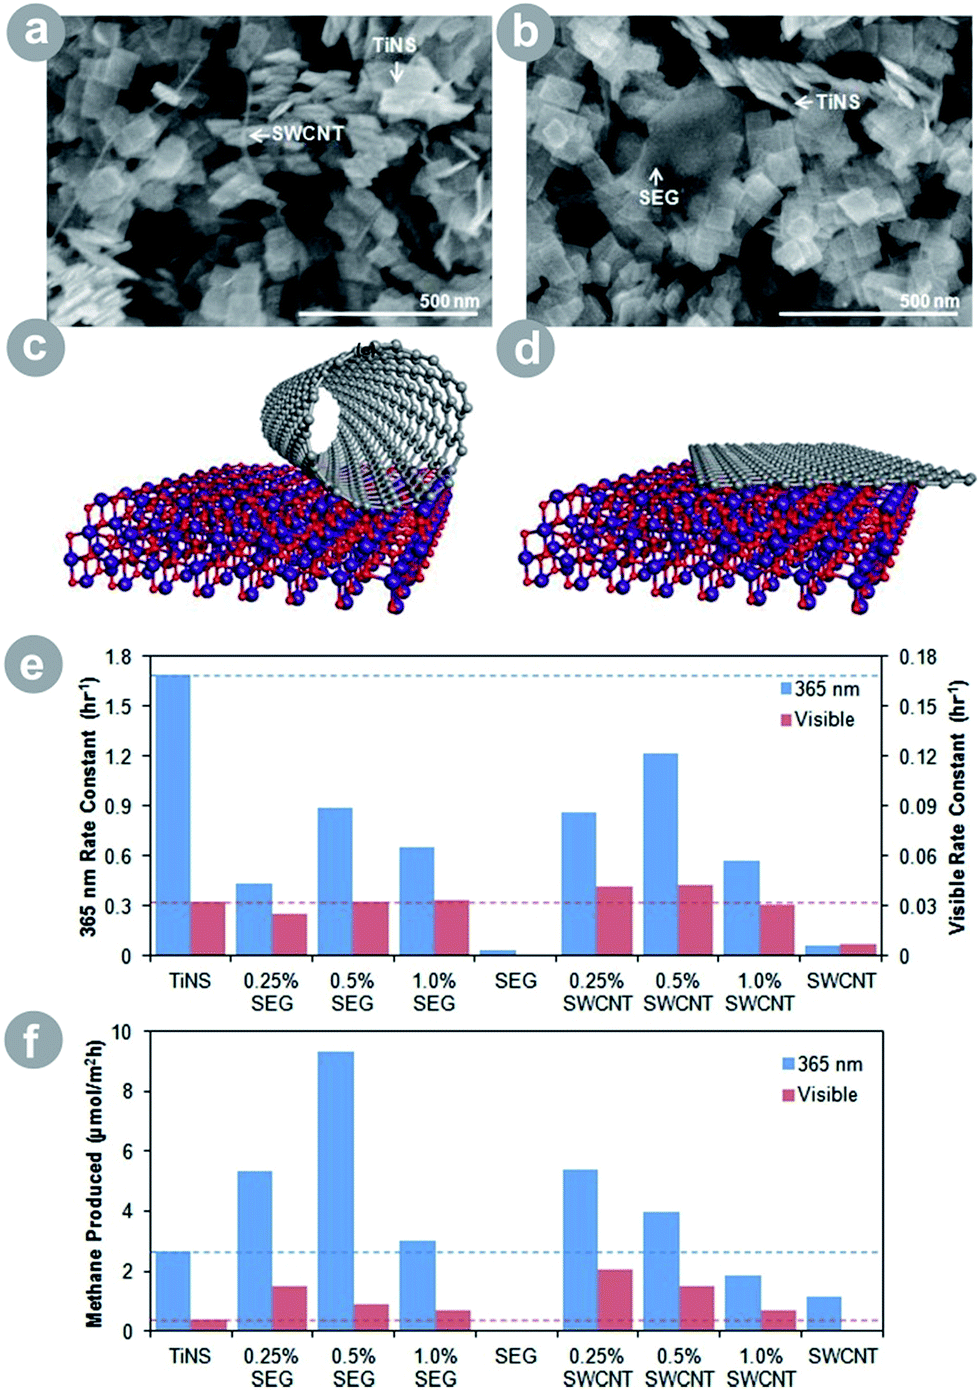 | ||
| Fig. 5 SEM image of (a) the SWCNT–TiNS composite and (b) the SEG–TiNS composite; schematic illustration of (c) the SWCNT–TiNS composite and (d) the SEG–TiNS composite; (e) photooxidation rate constant of acetaldehyde under ultraviolet and visible irradiation; (f) results of CO2 conversion under ultraviolet and visible irradiation (SWCNT = single-walled carbon nanotubes; SEG = solvent-exfoliated graphene; TiNS = titania nanosheets; reprinted with permission from ref. 30. Copyright American Chemical Society 2012). | ||
This strategy was used by Gui et al.29 who prepared TiO2/multi-walled carbon nanotube core–shell structures. The conductive nanotubes served as a sensitizer and an electron sink and the resulting photocatalyst showed an almost 6-fold higher CH4 yield as compared to the pristine TiO2.
Tu et al.7,28 prepared two interesting TiO2–graphene systems: (1) hollow spheres of alternating titania and graphene sheets and (2) sandwich-like TiO2–graphene hybrid nanosheets. Both materials showed improvement in the photocatalytic performance over Degussa P25; however, the sandwich structure achieved better performance and efficiently converted CO2 to CH4 and higher alkanes, whereas the hollow spheres produced mostly CO. The improvement of up to 15-fold is most probably due to charge separation between well-coupled TiO2 and graphene in the sandwich structure. Importantly, this sandwich-type structure is competitive in relation to many metal-loaded TiO2 photocatalysts.
3.4 Non-titania photocatalysts
Noticeably, titania is the most widely studied photocatalyst for CO2 conversion. Fortunately, the number of non-titania photocatalysts that are developed and studied continues to increase. Over half of the materials listed in Table 1 are photocatalysts not based on TiO2. These materials offer new or improved properties, often unmatched or hard to match by TiO2. The former include smaller band gap, better matched VB and/or CB, more favourable surface chemistry, and new or excelling structural, physical, and crystallographic properties. Despite these exciting properties, the performance may sometimes be limited as compared to TiO2, which is not surprising because it took a couple of decades to perfect the latter. However, it is noteworthy that these new materials offer room to grow with a set of promising features.A brief survey of Table 1 shows that the current efforts in the development of inorganic photocatalysts are focused on gallium, germanium, and tungsten-based materials (oxides and salts); however, niobium, vanadium, copper, and cerium compounds are reported as well. In addition, silver–silver halide plasmonic systems, photocatalytic metal–organic frameworks, organic–inorganic composite photocatalysts, and graphene-based composites are widely encountered.
Alternative to incorporation of metals, band gap narrowing is achieved by incorporation of non-metals. For instance, Yan et al.39 prepared ZnGaNO (Eg = 2.55 eV); Zhang et al.42 prepared zinc germanium oxynitride with varying stoichiometry (Eg = 2.6–2.8 eV); and Liu et al.44 prepared sheaf-like, hyper-branched nanostructures of Zn1.7GeN1.8O (Eg = 2.6 eV; see Fig. 6A). In all these examples, incorporation of nitrogen resulted in considerable narrowing of the band gap. Consequently, all compounds showed visible light activity.
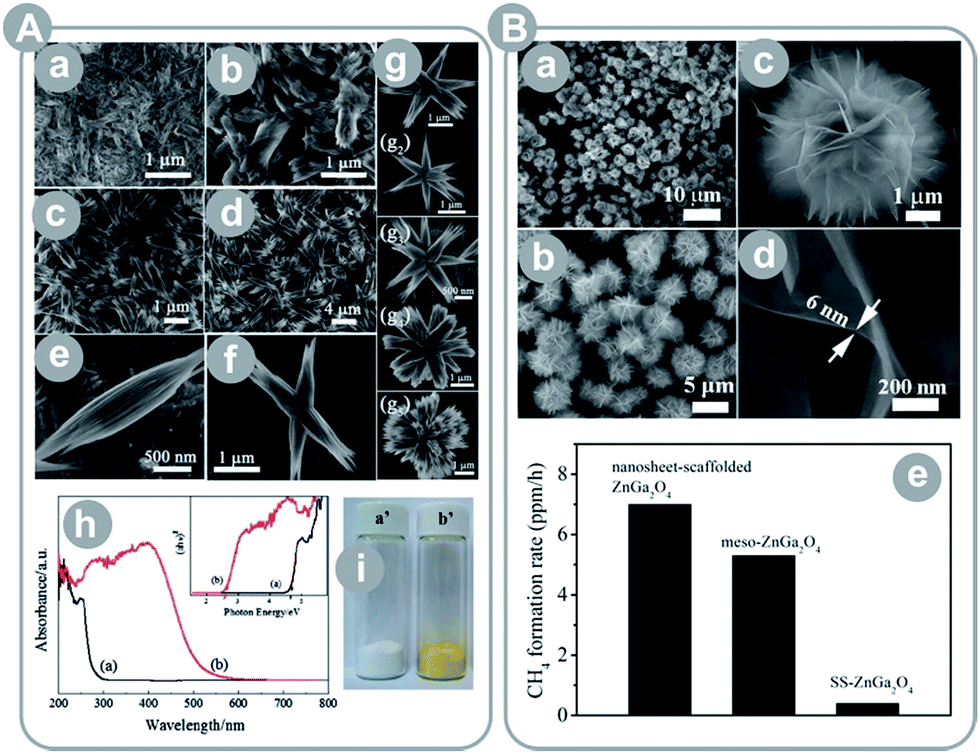 | ||
| Fig. 6 (A) Zn2GeO4 sheaf-like, hyperbranched nanostructures: (a–g) FESEM images, (h) UV-Vis absorption spectra of Zn2GeO4 (a) and Zn1.7GeN1.8O (b), (i) photo images of Zn2GeO4 (a′) and Zn1.7GeN1.8O (b′) (reprinted with permission from ref. 44. Copyright The Royal Society of Chemistry 2012); (B) single-crystalline, ultrathin ZnGa2O4 nanosheet microspheres: (a–d) FESEM images and (e) results of CO2 conversion for different ZnGa2O4 materials (reprinted with permission from ref. 37. Copyright American Chemical Society 2014). | ||
Park et al.40 showed the importance of porosity in the product yield. The prepared porous gallium oxide (Ga2O3) exhibited a 2-fold larger specific surface area, 3-fold higher CO2 uptake, and 4-fold higher CH4 yield, as compared to a commercially available gallium oxide. The result exemplifies the significant effect of porosity and surface area on the activity of this photocatalyst.
Similar to TiO2, many authors pointed out the effect of surface energetics on the product yield. Liu et al.37 reported synthesis of microspheres composed of single-crystalline, ultrathin ZnGa2O4 nanosheets with exposed {110} crystal facets (see Fig. 6B). The obtained photocatalyst scored a 23-fold higher CH4 yield as compared to the bulk ZnGa2O4. This enhancement may have come partially from an 11-fold larger surface area than the bulk material. Thus, the authors compared the prepared spheres to mesoporous ZnGa2O4 with a 2 times larger surface area, and still noted a 35% higher yield. Even more astonishing is the result of Yan et al.38 who synthesized ZnGa2O4 nanocubes with mainly exposed {100} crystal facets. The material achieved a 6.7-times higher CH4 yield than that of mesoporous ZnGa2O4 with a 10-times larger specific surface area.
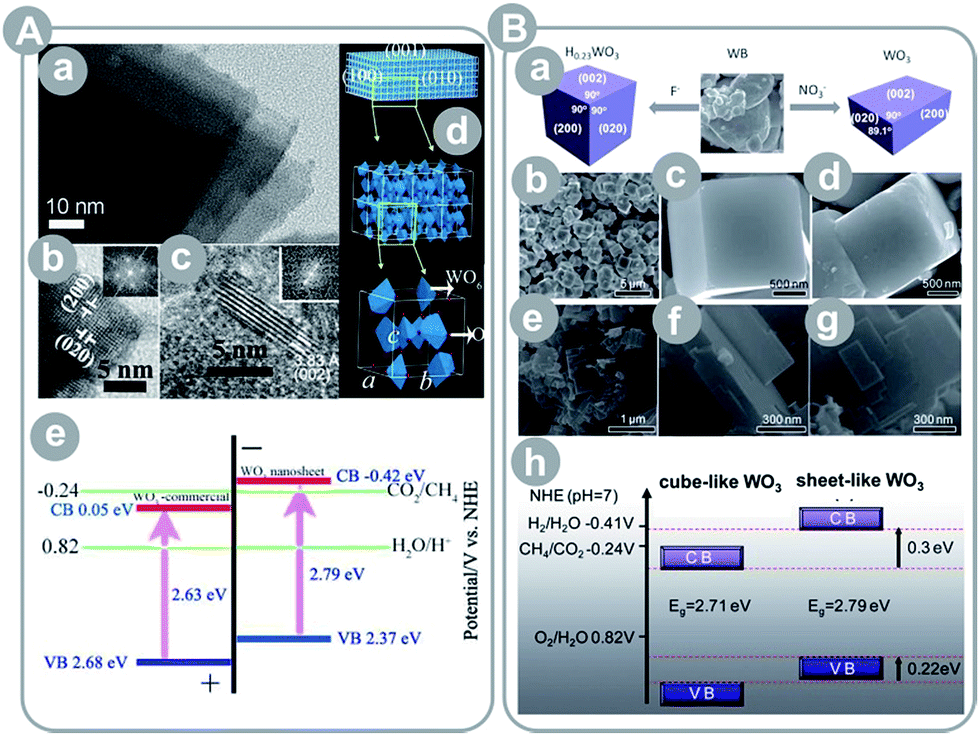 | ||
| Fig. 7 (A) Ultrathin, single-crystal WO3 nanosheets: (a–c) TEM images, (d) crystalline model, (e) energy level diagram (reprinted with permission from ref. 46. Copyright American Chemical Society 2012); (B) WO3 cubes and nanosheets: (a) schematic illustration of the synthesis procedure, (b and c) SEM images of H0.23WO3 nanocubes, (d) SEM image of cube-like WO3 obtained by calcination of H0.23WO3, (e–g) SEM images of sheet-like WO3, and (h) energy level diagram of the cube-like and sheet-like WO3 (reprinted with permission from ref. 47. Copyright The Royal Society of Chemistry 2012). | ||
 | ||
| Fig. 8 (A) g-C3N4 loaded with Pt: (a) TEM image, (b) HRTEM image, (c) UV-Vis diffuse reflectance spectra (the insets show photo images of the indicated samples), (d) results of CO2 conversion under solar simulated light for 4 hours (reprinted with permission from ref. 92. Copyright The Royal Society of Chemistry 2014); (B) red Ag/AgCl photocatalyst: (a–c) SEM images, (d) photo image, (e) band gap estimation using Kubelka–Munk theory and UV-Vis diffuse reflectance spectra, and (f) results of CO2 conversion experiments (reprinted with permission from ref. 9. Copyright The Royal Society of Chemistry 2014). | ||
 | ||
| Fig. 9 (A) Ti-containing and amine-functionalized MOF NH2-MIL-125(Ti): (a) FESEM image, (b) UV-Vis spectra and photo images of MIL-125(Ti) (a) and NH2-MIL-125(Ti) (b), (c) result of CO2 conversion by NH2-MIL-125(Ti) (a) and MIL-125(Ti) (b) under 420–800 nm irradiation (reprinted with permission from ref. 62. Copyright Wiley-VCH 2012); (B) reduced graphene oxide–CdS nanorod composite: (a) TEM image of graphene oxide, (b) TEM image of CdS nanorods, (c and d) TEM and HRTEM images of the RGO–CdS composite, (e) UV-Vis diffuse reflection spectra and the photo images of the indicated materials, and (f) CO2 conversion results under visible light irradiation (reprinted with permission from ref. 67. Copyright The Royal Society of Chemistry 2014). | ||
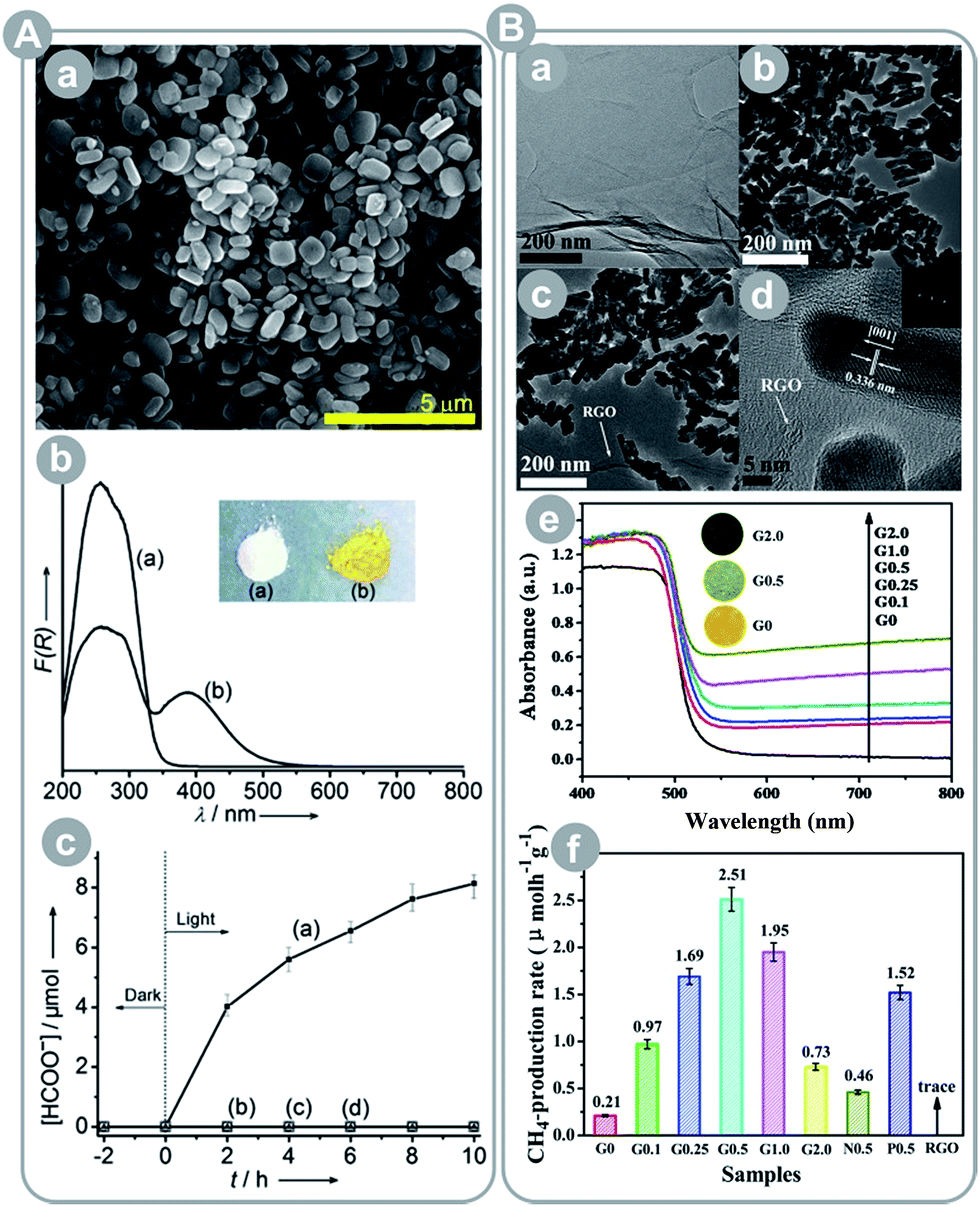
Liu et al.60 showed the importance of CO2 activation (destabilization of CO2 through sorption and interaction with the framework that renders it more reactive) in the conversion process. The authors prepared two porphyrin-based MOFs: one with plain porphyrin and the second with Cu-containing porphyrin. The Cu-containing MOF showed a 2-fold higher CO2 uptake and 7-fold higher product yield. This marked improvement was due to the CO2 activation upon adsorption and interaction with Cu porphyrin, which was proved by FTIR studies.
Graphene and its derivatives can be used to replace noble metals as an electron sink. For instance, Yu et al.67 and An et al.65 synthesized reduced graphene oxide (RGO) composites with CdS and Cu2O, respectively. The first group observed over 10-fold increase in the CH4 yield after RGO incorporation and over 1.6-fold increase as compared to the optimized Pt-loaded CdS, which show that RGO has potential to outperform Pt as a co-catalyst (see Fig. 9B). The authors pointed a few features that could explain this observation: (1) RGO is close in its properties to graphene and performs similarly well as an electron sink, (2) CO2 preferentially adsorbs on RGO (after RGO incorporation the surface area increased by ca. 17% whereas CO2 uptake doubled), (3) RGO-adsorbed CO2 undergoes activation due to strong π–π conjugation interactions, and (4) high concentration of CO2 and accumulated electrons on the RGO surface enhance the reduction performance. The second group reported similar observations, with the RGO/Cu2O photocatalyst achieving a 14-fold higher CO yield than that of Degussa P25 (no other products were detected).
Wu et al.11 showed a photocatalytic system composed of porphyrin and graphene, where porphyrin acted as a light harvester and graphene served as an electron collector and CO2 adsorbent. Interestingly, acetylene was the primary product, whereas CH4 constituted only 1/3 of the total carbohydrate production.
4 Summary and future outlook
The IPCC set a modest goal of reducing the greenhouse gas emissions in the next one and a half decade by 50%. This goal may be difficult to achieve considering that despite the ongoing reduction efforts the anthropogenic GHG emissions have been on the rise and the increase rate has been the highest since 1970, when the industrial revolution started. The technologies proposed to achieve this goal, such as carbon capture and storage, may help in a short term but a more sustainable approach will be necessary in the future.Photochemical CO2 conversion is one promising long-term solution. It may help to achieve the required emission cuts and simultaneously serve as a new source of hydrocarbon fuels. The process can be applied as an extension of the carbon and capture strategy, where instead of geological storage CO2 is recycled into other useful molecules. Because CO2 is captured and recycled before it may reach the atmosphere, the desired effect can be achieved despite the increasing emissions, resulting from the ongoing growth of the industry and manufacturing. Thus, this strategy may sustain the current and future stages of development.
In addition, the hydrocarbon products, methane and methanol, can substitute for the currently used fossil fuels using the existing infrastructure. These solar fuels may be regarded as a green, renewable, and sustainable energy source because they are produced with supply of the solar energy and easily replenishable CO2 and H2O.
CO2 conversion is mainly done over the solid semiconducting photocatalysts. An ideal photocatalyst should possess: (1) possibly a large surface area with favourable chemistry and energetics, (2) well-developed suitable porosity with good mass transfer properties, (3) a narrow band gap and good light harvesting properties, (4) CB and VB edges positioned properly to drive both CO2 reduction and H2O oxidation, (5) high purity and crystallinity, (6) proper morphology with a short bulk-to-surface distance, and (7) an efficient spatial charge separation.
In addition to these features, the experimental conditions will affect the observed product yield independent of the material's photoactivity. Thus, the product yield should always be reported along with the yield obtained for a reference photocatalyst (possibly Degussa P25) under the same experimental conditions. This approach enables a meaningful comparison of various photocatalysts tested in different experiments.
Titania is by far the most widely studied photocatalyst for CO2 conversion and it is often used in combination with other metal oxides, metals, and advanced carbon allotropes (carbon nanotubes, graphene). Non-titania photocatalysts include germanium, gallium, tungsten, and niobium-based materials, graphitic carbon nitride, silver–silver halide plasmonic systems, photocatalytically active metal–organic frameworks, and graphene-based systems.
Numerous improvements of the TiO2 photoactivity have been reported; however, its strongest drawbacks, the wide band-gap and the related poor light absorption, remain a problem. The non-titania photocatalysts, on the other hand, offer new or improved properties, often unmatched or hard to match by TiO2, which include a smaller band gap, better matched VB and/or CB, more favourable surface chemistry, and new or excelling structural, physical, and crystallographic properties. Although not as well studied, these materials offer a strong start-up and potential for future improvements, often using the same strategies developed for TiO2 throughout the years. Considering that the four decades of research – since the seminal report by Fujishima and Honda96 – did not crown TiO2 as a perfect photocatalyst, further development and studies of new photocatalysts should be imperative.
Several photocatalysts show better light harvesting properties than TiO2 and are good candidates to surpass it. The former include copper oxides, graphitic carbon nitride, zinc germanium oxynitrides and zinc gallium oxynitrides, tungsten-based compounds, and advanced carbon allotropes. Care should be exercised, however, to account for the material's stability, cyclability and other features necessary for a true catalyst. The unquestionable success of commercial TiO2, despite the aforementioned downsides, may partly be attributed to its stability, cyclability, non-toxicity, and other important properties, which every prospective photocatalyst should possess besides good light harvesting and photoactivity.
Finally, a deeper understanding of the photocatalytic process is necessary. The latter can help to optimize the surface and other material properties as well as uncover new important aspects and/or ideas. A combination of experimental and theoretical results from fundamental studies and computer simulations should be preferred as it has the strongest potential to advance the current state of knowledge. As a result, novel and superior photocatalytic CO2 conversion systems could be designed.
Acknowledgements
J. Yu would like to acknowledge the 973 program (2013CB632402), and NSFC (51272199, 51320105001 and 21433007) and Deanship of Scientific Research (DSR) of King Abdulaziz University (90-130-35-HiCi) for support.Notes and references
- IPCC, Climate Change 2013: The Physical Science Basis. Contribution of Working Group I to the Fifth Assessment Report of the Intergovernmental Panel on Climate Change, Cambridge University Press, Cambridge, United Kingdom and New York, NY, USA, 2013 Search PubMed.
- IPCC, Climate Change 2014: Impacts, Adaptation, and Vulnerability. Working Group II Contribution to the IPCC 5th Assessment Report, Final draft, 28 October 2013 Search PubMed.
- IPCC, Climate Change 2014: Mitigation of Climate Change. Working Group III Contribution to the IPCC 5th Assessment Report, Final draft, 17 December 2013 Search PubMed.
- W. Tu, Y. Zhou and Z. Zou, Adv. Mater., 2014, 26, 4607–4626 CrossRef CAS PubMed.
- K. Li, X. An, K. H. Park, M. Khraisheh and J. Tang, Catal. Today, 2014, 224, 3–12 CrossRef CAS PubMed.
- X. Zhang, F. Han, B. Shi, S. Farsinezhad, G. P. Dechaine and K. Shankar, Angew. Chem., Int. Ed., 2012, 51, 12732–12735 CrossRef CAS PubMed.
- W. Tu, Y. Zhou, Q. Liu, S. Yan, S. Bao, X. Wang, M. Xiao and Z. Zou, Adv. Funct. Mater., 2013, 23, 1743–1749 CrossRef CAS PubMed.
- C. An, J. Wang, C. Qin, W. Jiang, S. Wang, Y. Li and Q. Zhang, J. Mater. Chem., 2012, 22, 13153–13158 RSC.
- B. Cai, J. Wang, S. Gan, D. Han, Z. Wu and L. Niu, J. Mater. Chem. A, 2014, 2, 5280–5286 CAS.
- B. Cai, J. Wang, D. Han, S. Gan, Q. Zhang, Z. Wu and L. Niu, Nanoscale, 2013, 5, 10989–10995 RSC.
- T. Wu, L. Zou, D. Han, F. Li, Q. Zhang and L. Niu, Green Chem., 2014, 16, 2142–2146 RSC.
- A. Goeppert, M. Czaun, J. Jones, G. K. S. Prakash and G. A. Olah, Chem. Soc. Rev., 2014, 43, 7995–8048 RSC.
- E. V. Kondratenko, G. Mul, J. Baltrusaitis, G. O. Larrazabal and J. Perez-Ramirez, Energy Environ. Sci., 2013, 6, 3112–3135 CAS.
- G. Sneddon, A. Greenaway and H. H. P. Yiu, Adv. Energy Mater., 2014, 4, 1301873 Search PubMed.
- S. Xie, Y. Wang, Q. Zhang, W. Fan, W. Deng and Y. Wang, Chem. Commun., 2013, 49, 2451–2453 RSC.
- L. Liu, C. Zhao, H. Zhao, D. Pitts and Y. Li, Chem. Commun., 2013, 49, 3664–3666 RSC.
- M. Manzanares, C. Fabrega, J. Oriol Osso, L. F. Vega, T. Andreu and J. Ramon Morante, Appl. Catal., B, 2014, 150, 57–62 CrossRef PubMed.
- Q. Zhai, S. Xie, W. Fan, Q. Zhang, Y. Wang, W. Deng and Y. Wang, Angew. Chem., Int. Ed., 2013, 52, 5776–5779 CrossRef CAS PubMed.
- H. Xu, S. Ouyang, L. Liu, D. Wang, T. Kako and J. Ye, Nanotechnology, 2014, 25, 165402 CrossRef PubMed.
- S. In, D. D. Vaughn II and R. E. Schaak, Angew. Chem., Int. Ed., 2012, 51, 3915–3918 CrossRef CAS PubMed.
- Y. Wang, B. Li, C. Zhang, L. Cui, S. Kang, X. Li and L. Zhou, Appl. Catal., B, 2013, 130, 277–284 CrossRef PubMed.
- M. Tahir and N. S. Amin, Appl. Catal., B, 2013, 142, 512–522 CrossRef PubMed.
- O. Ola and M. M. Maroto-Valer, J. Catal., 2014, 309, 300–308 CrossRef CAS PubMed.
- W. Wang, W. An, B. Ramalingam, S. Mukherjee, D. M. Niedzwiedzki, S. Gangopadhyay and P. Biswas, J. Am. Chem. Soc., 2012, 134, 11276–11281 CrossRef CAS PubMed.
- L. Liu, F. Gao, H. Zhao and Y. Li, Appl. Catal., B, 2013, 134, 349–358 CrossRef PubMed.
- S. Krejcikova, L. Matejova, K. Koci, L. Obalova, Z. Matej, L. Capek and O. Solcova, Appl. Catal., B, 2012, 111, 119–125 CrossRef PubMed.
- Z. Zhang, Z. Wang, S. Cao and C. Xue, J. Phys. Chem. C, 2013, 117, 25939–25947 CAS.
- W. Tu, Y. Zhou, Q. Liu, Z. Tian, J. Gao, X. Chen, H. Zhang, J. Liu and Z. Zou, Adv. Funct. Mater., 2012, 22, 1215–1221 CrossRef CAS.
- M. M. Gui, S. Chai, B. Xu and A. R. Mohamed, Sol. Energy Mater. Sol. Cells, 2014, 122, 183–189 CrossRef CAS PubMed.
- Y. T. Liang, B. K. Vijayan, O. Lyandres, K. A. Gray and M. C. Hersam, J. Phys. Chem. Lett., 2012, 3, 1760–1765 CrossRef CAS.
- J. Fu, S. Cao, J. Yu, J. Low and Y. Lei, Dalton Trans., 2014, 43, 9158–9165 RSC.
- J. Yu, J. Low, W. Xiao, P. Zhou and M. Jaroniec, J. Am. Chem. Soc., 2014, 136, 8839–8842 CrossRef CAS PubMed.
- H. Zhao, L. Liu, J. M. Andino and Y. Li, J. Mater. Chem. A, 2013, 1, 8209–8216 CAS.
- W. Jiao, L. Wang, G. Liu, G. Q. Lu and H. Cheng, ACS Catal., 2012, 2, 1854–1859 CrossRef CAS.
- H. Xu, S. Ouyang, P. Li, T. Kako and J. Ye, ACS Appl. Mater. Interfaces, 2013, 5, 1348–1354 CAS.
- S. Yan, J. Wang, H. Gao, N. Wang, H. Yu, Z. Li, Y. Zhou and Z. Zou, Adv. Funct. Mater., 2013, 23, 1839–1845 CrossRef CAS.
- Q. Liu, D. Wu, Y. Zhou, H. Su, R. Wang, C. Zhang, S. Yan, M. Xiao and Z. Zou, ACS Appl. Mater. Interfaces, 2014, 6, 2356–2361 CAS.
- S. Yan, J. Wang, H. Gao, N. Wang, H. Yu, Z. Li, Y. Zhou and Z. Zou, Adv. Funct. Mater., 2013, 23, 758–763 CrossRef CAS.
- S. Yan, H. Yu, N. Wang, Z. Li and Z. Zou, Chem. Commun., 2012, 48, 1048–1050 RSC.
- H. Park, J. H. Choi, K. M. Choi, D. K. Lee and J. K. Kang, J. Mater. Chem., 2012, 22, 5304–5307 RSC.
- K. Teramura, Z. Wang, S. Hosokawa, Y. Sakata and T. Tanaka, Chem.–Eur. J., 2014, 20, 9906–9909 CrossRef CAS PubMed.
- N. Zhang, S. Ouyang, T. Kako and J. Ye, Chem. Commun., 2012, 48, 1269–1271 RSC.
- Q. Liu, Y. Zhou, W. Tu, S. Yan and Z. Zou, Inorg. Chem., 2014, 53, 359–364 CrossRef CAS PubMed.
- Q. Liu, Y. Zhou, Z. Tian, X. Chen, J. Gao and Z. Zou, J. Mater. Chem., 2012, 22, 2033–2038 RSC.
- H. Cheng, B. Huang, Y. Liu, Z. Wang, X. Qin, X. Zhang and Y. Dai, Chem. Commun., 2012, 48, 9729–9731 RSC.
- X. Chen, Y. Zhou, Q. Liu, Z. Li, J. Liu and Z. Zou, ACS Appl. Mater. Interfaces, 2012, 4, 3372–3377 CAS.
- Y. P. Xie, G. Liu, L. Yin and H. Cheng, J. Mater. Chem., 2012, 22, 6746–6751 RSC.
- X. Li, W. Li, Z. Zhuang, Y. Zhong, Q. Li and L. Wang, J. Phys. Chem. C, 2012, 116, 16047–16053 CAS.
- P. Li, S. Ouyang, G. Xi, T. Kako and J. Ye, J. Phys. Chem. C, 2012, 116, 7621–7628 CAS.
- P. Li, S. Ouyang, Y. Zhang, T. Kako and J. Ye, J. Mater. Chem. A, 2013, 1, 1185–1191 CAS.
- S. Feng, X. Chen, Y. Zhou, W. Tu, P. Li, H. Li and Z. Zou, Nanoscale, 2014, 6, 1896–1900 RSC.
- E. Pastor, F. M. Pesci, A. Reynal, A. D. Handoko, M. Guo, X. An, A. J. Cowan, D. R. Klug, J. R. Durrant and J. Tang, Phys. Chem. Chem. Phys., 2014, 16, 5922–5926 RSC.
- Y. Wang, F. Wang, Y. Chen, D. Zhang, B. Li, S. Kang, X. Li and L. Cui, Appl. Catal., B, 2014, 147, 602–609 CrossRef CAS PubMed.
- S. Cao, X. Liu, Y. Yuan, Z. Zhang, Y. Liao, J. Fang, S. C. J. Loo, T. C. Sum and C. Xue, Appl. Catal., B, 2014, 147, 940–946 CrossRef CAS PubMed.
- Y. Yuan, S. Cao, Y. Liao, L. Yin and C. Xue, Appl. Catal., B, 2013, 140, 164–168 CrossRef PubMed.
- K. Iizuka, T. Wato, Y. Miseki, K. Saito and A. Kudo, J. Am. Chem. Soc., 2011, 133, 20863–20868 CrossRef CAS PubMed.
- K. Teramura, S. Iguchi, Y. Mizuno, T. Shishido and T. Tanaka, Angew. Chem., Int. Ed., 2012, 51, 8008–8011 CrossRef CAS PubMed.
- C. An, J. Wang, W. Jiang, M. Zhang, X. Ming, S. Wang and Q. Zhang, Nanoscale, 2012, 4, 5646–5650 RSC.
- M. Abou Asi, L. Zhu, C. He, V. K. Sharma, D. Shu, S. Li, J. Yang and Y. Xiong, Catal. Today, 2013, 216, 268–275 CrossRef CAS PubMed.
- Y. Liu, Y. Yang, Q. Sun, Z. Wang, B. Huang, Y. Dai, X. Qin and X. Zhang, ACS Appl. Mater. Interfaces, 2013, 5, 7654–7658 CAS.
- D. Sun, Y. Fu, W. Liu, L. Ye, D. Wang, L. Yang, X. Fu and Z. Li, Chem.–Eur. J., 2013, 19, 14279–14285 CrossRef CAS PubMed.
- Y. Fu, D. Sun, Y. Chen, R. Huang, Z. Ding, X. Fu and Z. Li, Angew. Chem., Int. Ed., 2012, 51, 3364–3367 CrossRef CAS PubMed.
- Q. Liu, Z. Low, L. Li, A. Razmjou, K. Wang, J. Yao and H. Wang, J. Mater. Chem. A, 2013, 1, 11563–11569 CAS.
- K. Maeda, K. Sekizawa and O. Ishitani, Chem. Commun., 2013, 49, 10127–10129 RSC.
- X. An, K. Li and J. Tang, ChemSusChem, 2014, 7, 1086–1093 CrossRef CAS PubMed.
- H. Hsu, I. Shown, H. Wei, Y. Chang, H. Du, Y. Lin, C. Tseng, C. Wang, L. Chen, Y. Lin and K. Chen, Nanoscale, 2013, 5, 262–268 RSC.
- J. Yu, J. Jin, B. Cheng and M. Jaroniec, J. Mater. Chem. A, 2014, 2, 3407–3416 CAS.
- L. Sang, Y. Zhao and C. Burda, Chem. Rev., 2014, 114, 9283–9318 CrossRef CAS PubMed.
- X. Wang, Z. Li, J. Shi and Y. Yu, Chem. Rev., 2014, 114, 9346–9384 CrossRef CAS PubMed.
- K. Lee, A. Mazare and P. Schmuki, Chem. Rev., 2014, 114, 9385–9454 CrossRef CAS PubMed.
- L. Wang and T. Sasaki, Chem. Rev., 2014, 114, 9455–9486 CrossRef CAS PubMed.
- D. Fattakhova-Rohlfing, A. Zaleska and T. Bein, Chem. Rev., 2014, 114, 9487–9558 CrossRef CAS PubMed.
- S. Liu, J. Yu and M. Jaroniec, Chem. Mater., 2011, 23, 4085–4093 CrossRef CAS.
- F. P. Koffyberg and F. A. Benko, J. Appl. Phys., 1982, 53, 1173–1177 CrossRef CAS PubMed.
- K. Nakaoka, J. Ueyama and K. Ogura, J. Electrochem. Soc., 2004, 151, C661–C665 CrossRef CAS PubMed.
- Z. Yang, G. Huang, W. Huang, J. Wei, X. Yan, Y. Liu, C. Jiao, Z. Wan and A. Pan, J. Mater. Chem. A, 2014, 2, 1750–1756 CAS.
- X. Wang, Q. Xu, M. Li, S. Shen, X. Wang, Y. Wang, Z. Feng, J. Shi, H. Han and C. Li, Angew. Chem., Int. Ed., 2012, 51, 13089–13092 CrossRef CAS PubMed.
- Q. Liu, Y. Zhou, J. Kou, X. Chen, Z. Tian, J. Gao, S. Yan and Z. Zou, J. Am. Chem. Soc., 2010, 132, 14385–14387 CrossRef CAS PubMed.
- X. Chen, S. Shen, L. Guo and S. S. Mao, Chem. Rev., 2010, 110, 6503–6570 CrossRef CAS PubMed.
- A. Kubacka, M. Fernandez-Garcia and G. Colon, Chem. Rev., 2012, 112, 1555–1614 CrossRef CAS PubMed.
- N. Yazdanpour and S. Sharifnia, Sol. Energy Mater. Sol. Cells, 2013, 118, 1–8 CrossRef CAS PubMed.
- B. Ohtani, Y. Ogawa and S. Nishimoto, J. Phys. Chem. B, 1997, 101, 3746–3752 CrossRef CAS.
- M. Marszewski and M. Jaroniec, Langmuir, 2013, 29, 12549–12559 CrossRef CAS PubMed.
- M. S. Hamdy, R. Amrollahi, I. Sinev, B. Mei and G. Mul, J. Am. Chem. Soc., 2014, 136, 594–597 CrossRef CAS PubMed.
- A. Di Paola, M. Bellardita, R. Ceccato, L. Palmisano and F. Parrino, J. Phys. Chem. C, 2009, 113, 15166–15174 CAS.
- J. Wang, G. Ji, Y. Liu, M. A. Gondal and X. Chang, Catal. Commun., 2014, 46, 17–21 CrossRef CAS PubMed.
- F. Sastre, A. Corma and H. Garcia, Angew. Chem., Int. Ed., 2013, 52, 12983–12987 CrossRef CAS PubMed.
- F. Sastre, A. V. Puga, L. Liu, A. Corma and H. Garcia, J. Am. Chem. Soc., 2014, 136, 6798–6801 CrossRef CAS PubMed.
- W. Hou and S. B. Cronin, Adv. Funct. Mater., 2013, 23, 1612–1619 CrossRef CAS.
- S. Cao and J. Yu, J. Phys. Chem. Lett., 2014, 5, 2101–2107 CrossRef CAS.
- Y. Wang, X. Wang and M. Antonietti, Angew. Chem., Int. Ed., 2012, 51, 68–89 CrossRef CAS PubMed.
- J. Yu, K. Wang, W. Xiao and B. Cheng, Phys. Chem. Chem. Phys., 2014, 16, 11492–11501 RSC.
- P. Scop, Phys. Rev., 1965, 139, A934–A940 CrossRef.
- C. Wang, Z. Xie, K. E. deKrafft and W. Lin, J. Am. Chem. Soc., 2011, 133, 13445–13454 CrossRef CAS PubMed.
- H. Sun and S. Wang, Energy Fuels, 2014, 28, 22–36 CrossRef CAS.
- A. Fujishima and K. Honda, Nature, 1972, 238, 37–38 CrossRef CAS.
| This journal is © The Royal Society of Chemistry 2015 |