DOI:
10.1039/C4MH00138A
(Communication)
Mater. Horiz., 2015,
2, 60-67
Photoinduced energy transfer in dye encapsulated polymer nanoparticle–CdTe quantum dot light harvesting assemblies†
Received
11th August 2014
, Accepted 11th September 2014
First published on 11th September 2014
Abstract
Here, we have designed organic–inorganic light harvesting assemblies in which highly efficient resonance energy transfer occurs from CdTe quantum dots (donors) to Nile Red dye (acceptor) encapsulated polymer nanoparticles. Our motivation is to develop an assembly where the quantum dots (QDs) will absorb visible light as an antenna material, followed by the funneling of the exciton to an acceptor molecule (the Nile Red dye), which is confined in polymer nanoparticles in order to enhance their energy transfer efficiency. An ionic liquid is used to prepare the positively charged Nile Red (NR) dye encapsulated poly(methyl methacrylate) (PMMA) polymer nanoparticles. Then, negatively charged thioglycolic acid capped CdTe QDs are attached to the surface of the polymer nanoparticles by electrostatic interaction. The drastic quenching of the photoluminescence (60%) and the shortening of the decay time of the CdTe QDs imply an efficient energy transfer (73%) from the CdTe QDs to the NR dye doped PMMA nanoparticles. Time resolved anisotropy decay measurements reveal the rotational motion of the dye molecules inside the PMMA nanoparticles. Interesting findings reveal that the efficient energy transfer in the organic–inorganic assemblies may open up new possibilities for the design of an artificial light harvesting system for future applications.
Conceptual insights
Assemblies of organic–inorganic nanoparticles remain a frontier area of research for the development of optoelectronics, photovoltaics and light harvesting systems. Here, we have designed assemblies where QDs will absorb visible light as an antenna material, followed by the funneling of the exciton to an acceptor molecule, which is confined in polymer nanoparticles. To design the assembly, the polymer nanoparticles are surface functionalized by an ionic liquid and then these nanoparticles are attached to negatively charged QDs. We investigate the efficient energy transfer from the QDs to the dye molecule inside the polymer nanoparticles by using steady state and time resolved spectroscopy. Fundamental investigations of this resonance energy transfer from the surface to the core of the assemblies will open up new possibilities for designing inorganic–organic assemblies for artificial light harvesting systems.
|
Introduction
Self-assembled molecules, especially DNA conjugated systems1–3 and supramolecular organizations of conjugated molecules/fluorophores, dendrimers, organo gels, etc.4–12 are found to be the most promising efficient light absorbing antenna materials. Emphasis has been given to the fabrication of light harvesting devices by the incorporation of fluorophore molecules inside a confined matrix for better stability, functionality and aggregation free molecular arrangements.13,14 Attempts have been made to design a system where both the donor and the acceptor fluorophore molecules are incorporated inside mesoporous silica.15–17 Quenching due to self aggregation is the major limitation in this type of light harvesting device. Furthermore, polymer nanoparticles are found to be an efficient host matrix for enhancing the excitation energy transfer process from self organized donor molecules to acceptor molecules.18,19 Dye doped organic–polymer fluorescent nanoparticles may be suitable as an acceptor system because the hydrophobic dyes are easily incorporated and dispersed within the hydrophobic polymer nanoparticles.20,21 Recent research has focused on dye doped polymer nanoparticles as an alternative luminescent source because of several outstanding features, i.e. easy synthetic procedure, easy functionalization of the surface, higher photostability, efficient brightness and color tunability.21–23 Extensive investigations on the photophysics of encapsulated dye molecules in polymer nanoparticles and their dependence on confined motions, matrix rigidity, and heterogeneous population have been reported very recently.21,24 Near-infrared fluorescent dye doped semiconducting polymer dots are found to have efficient light harvesting applications.25
In the search for a light absorbing material, it is now well established that inorganic nanocrystals or quantum dots (QDs) are very useful for enhancing the light harvesting process, as they can absorb light over a wide spectral window.26,27 Semiconducting quantum dots are fascinating because of their size dependent photophysical properties and photostability compared to conventional dyes.28,29 Particularly, variable sized quantum dots with tunable band gap energies have received significant attention for efficient solar light energy harvesting systems30 because visible light is effectively absorbed by QDs, followed by the funneling of the excitation energy to a reaction center. Extensive work has been done on QD based energy transfer for various applications.31–36 However, the energy should be transferred in a unidirectional way for light harvesting applications. In this regard, the energy transfer from QDs to metal–organic frameworks or aggregated molecules is reported for enhancing light harvesting.37,38 Considering this concept, our idea is to design an inorganic–organic conjugate system where QDs will absorb the visible light as an antenna material, and then transfer the exciton to an acceptor molecule which is confined in polymer nanoparticles.
To design polymer–inorganic assemblies, the surface functionalization of the polymer nanoparticles is essential. The polymer nanoparticle surface becomes negatively charged when prepared by a reprecipitation method due to the formation of defects.39 To overcome this, a few studies have already been done on the functionalization of the polymer nanoparticles. Recently, Chiu and his coworkers functionalized the hydrophobic nanoparticles to become negative using carboxylic groups.25,40 Here, we use the long tailed 1-hexadecyl-3-methylimidazolium bromide ionic liquid (IL) for the one step preparation and functionalization of Nile Red (NR) dye doped poly(methyl methacrylate) (PMMA) polymer (structures are shown in Scheme 1) nanoparticles by the simple reprecipitation method. The negatively charged CdTe QDs are prepared using thioglycolic acid (TGA). Finally, the positively charged functionalized PMMA nanoparticles are then attached to the TGA capped CdTe quantum dots. We investigate the efficient energy transfer from the CdTe QDs to the Nile Red dye inside the PMMA polymer nanoparticles by using steady state and time resolved spectroscopy. A fluorescence anisotropy decay study is also used to understand the energy migration. Fundamental investigations of this FRET based exciton energy accumulation from the surface to the core of this composite nanostructure will open up new possibilities for designing inorganic–organic assemblies for artificial light harvesting systems.
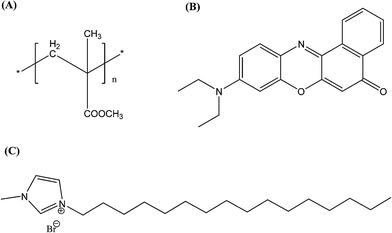 |
| | Scheme 1 Chemical structures of (A) PMMA, (B) the Nile Red dye and (C) the ionic liquid. | |
Experimental procedures
Preparation of the ionic liquid
The ionic liquid 1-hexadecyl-3-methylimidazolium bromide ([HDMIm]Br) was prepared by a previously reported method41,42 using microwave irradiation in a mixture of 1-methyl imidazole (Aldrich) and 1-bromohexadecane (SRL). The prepared IL was then purified by recrystallization and dried in a vacuum. The IL was characterized by NMR (1H and COSY) spectroscopy and ESI mass spectroscopy, the spectra of which are shown in the ESI (Fig. S1–S3†), and the data agree well with previously reported values. Before using the IL, it was dried under a high vacuum at 60 °C to evaporate adsorbed water.
Synthesis of the IL functionalized Nile Red (NR) dye doped PMMA nanoparticles
The positively charged PMMA polymer nanoparticles in water were prepared using a very simple reprecipitation method.43 In brief, 200 μl of 4 mg mL−1 PMMA in THF (Merck), the required amount of the NR dye (Aldrich) solution of fixed absorbance in THF, and the desired amount of 1 mg mL−1 solution of the synthesized IL in THF was mixed to a final volume of 1 mL. Then, this mixed THF solution was rapidly injected into 20 mL of deionized water and vigorously stirred for 5 minutes. This solution was then sonicated for 3 minutes and the THF was evaporated in a partial vacuum at 60 °C for two hours. Thus, the IL functionalized NR dye doped PMMA nanoparticles were prepared and were stable for more than a month. We have prepared different sets of NR dye doped PMMA nanoparticles with different IL concentrations to standardize the amount of IL. We have also prepared PMMA nanoparticles with final NR dye concentrations of 0.11 μM, 0.22 μM, 0.44 μM, 0.66 μM and 0.88 μM in the nanoparticle solution with a fixed IL concentration of 12.5 μM.
Synthesis of the water soluble TGA capped CdTe QDs
The CdTe QD solution was synthesized using the reaction between CdCl2 and NaHTe solutions following previously reported methods with some modifications.44,45 At first, NaHTe was prepared by adding 0.53 mM of NaBH4 (Merck) and 0.18 mM of Te powder (Aldrich) in a round bottom flask containing 2 mL of MilliQ water in an N2 atmosphere. On the other hand, 0.10 mM of CdCl2·2.5H2O (Aldrich) was dissolved in 25 mL of MilliQ water. Then, 0.24 mM of thioglycolic acid (Merck) was added to the solution and a white precipitate appeared. The pH of the mixture was adjusted to 8–9 by adding the required amount of NaOH, which gives a clear solution. The mixture was bubbled with N2 for 45 minutes to remove O2. Then, 0.06 mM of NaHTe was immediately injected into this mixture under vigorous stirring for 30 minutes, followed by refluxing at 110 °C in an air atmosphere. The reaction was quenched after 30 minutes of growth time and the resulting colloid was collected. These nanocrystals were stable for more than three months when stored at 10 °C.
Preparation of the NR dye encapsulated PMMA polymer nanoparticle–CdTe QD assemblies
The required amount of CdTe QD solution was added to the synthesized IL modified polymer nanoparticle solution under mild sonication. The final concentrations of TGA capped CdTe QDs in the conjugate solutions were fixed to 1 μM. The negatively charged TGA capped CdTe QDs were attached to the positively charged IL functionalized polymer nanoparticle surface by electrostatic interactions. The pH of the final solution became 6.5. All the solutions were kept for 5 hours at room temperature for stabilization before characterization.
Characterization
An NMR spectroscopy study of the ionic liquid was carried out using a Bruker DPX 500 MHz spectrometer. The ESI mass spectrum of the ionic liquid was recorded from a methanol solution in a Quadrupole time-of-flight (Qtof) Micro YA263 mass spectrometer. Morphological studies of the polymer nanoparticles were done by a field emission scanning electron microscope (FESEM, JEOL, JSM - 6700F). Detailed structural features of the QD and conjugate solutions were investigated by a high-resolution transmission electron microscope (HRTEM; JEOL 2010). The zeta potential was measured in a Malveron Zetasizer instrument. Room temperature optical absorption spectra were taken by a UV-vis spectrophotometer (SHIMADZU). Room temperature photoluminescence studies were carried out using a Fluoro Max – P (Horiba Jobin Yvon) luminescence spectrometer. For the time-correlated single-photon-counting (TCSPC) measurements, the samples were excited at 375 and 489 nm using picosecond NANO-LED IBH 375L and picosecond NANO-LED IBH 489 equipment. The TCSPC measurements of the NR dye were performed by excitation with 375 nm wavelength generated from a 750 nm Ti-sapphire laser pulse of 80 MHz and the decay time was measured by a Halcyone lifetime measurement system. Eqn (1) was used to analyze the experimental time-resolved fluorescence decays, P(t):| |  | (1) |
where n is the number of emissive species, b is the baseline correction (DC offset), and αi and τi are, respectively, the pre-exponential factor and the excited-state fluorescence lifetime associated with the ith component. The average lifetime, 〈τ〉, was calculated from eqn (2):| |  | (2) |
where ai = αi/∑αi and is the contribution of the decay component.
For the anisotropy decays, we used a motorized polarizer in the emission side. The analyzer was rotated by 90° at regular intervals. The parallel (I‖) and perpendicular (I⊥) polarizations were collected alternately until a certain peak difference between the parallel and perpendicular decays was reached. The r(t) value was calculated using the following formula:
| |  | (3) |
The analysis of the time resolved data was done using IBH DAS, version 6 decay analysis software. The same software was used to analyze the anisotropy data. All the experiments were done at room temperature.
Results and discussion
During the synthesis of the polymer nanoparticles by the reprecipitation method, the THF solution of PMMA was injected into water and the THF quickly diffused in the water. As a result the nanoparticles were formed by the coiling of the PMMA chains. These nanoparticles were negatively charged due to the formation of defects. To functionalize the surface of the nanoparticles with a positive charge, we used 1-hexadecyl-3-methylimidazolium bromide ionic liquid (IL). When the IL was added during reprecipitation, the long hydrophobic tail of the IL grafted to the PMMA nanoparticles, leaving the positively charged imidazole group on the outer surface of the nanoparticles. Thus, positively charged functionalized polymer nanoparticles were successfully prepared using an IL in a single step. FESEM was used to investigate the morphology and particle size. Fig. 1a shows the SEM image of the NR dye doped PMMA nanoparticles with an IL concentration of 12.5 μM. It can be seen from the SEM image that the particles are spherical in nature with an average diameter of 50(±10) nm. SEM images of the polymer nanoparticles with IL concentrations of 6.25 μM and 25 μM are shown in the ESI (Fig. S4†). It is observed from the size distribution plot (Fig. S5†) that the particle size of the polymer nanoparticles increases with increasing IL concentration. The zeta potentials of these three nanoparticles were measured and were found to be +13.2 mV, +20.2 mV and +38.7 mV for 6.25 μM, 12.5 μM and 25 μM concentrations of the IL, respectively, indicating that the IL concentration controls the surface charge of the particles. It is also observed that there is no change in the absorption spectra of the solvatochromic NR dye inside the polymer nanoparticles due to functionalization (Fig. S6†), which confirms that the IL has no influence on the dye environment in the dye encapsulated polymer nanoparticles. The encapsulation of the NR dye inside the polymer nanoparticles has been confirmed from the emission spectra of the NR dye. Fig. 1b shows the PL spectra of the NR dye encapsulated PMMA nanoparticles and the NR dye in water. The PL intensity at 640 nm is very low in water after excitation at 530 nm, but it enhances drastically and shifts to 600 nm when the dye is encapsulated within PMMA, as a result of the change in polarity due to encapsulation within the polymer. When the NR dyes get encapsulated within the hydrophobic domain of the polymer nanoparticles, a drastic change in the dye environment occurs from a polar to a nonpolar environment. Thus this blue shifting of the NR dye emission indicates that the dye molecules are encapsulated in the hydrophobic PMMA nanoparticles.24 No significant change in the PL intensity of the NR dye emission occurs when changing the concentration from 6.25 to 25 μM of the IL (see ESI, Fig. S7†). This reveals that the IL has no significant influence on the dye encapsulated within the PMMA, indicating that the IL molecules are on the surface of the nanoparticles.
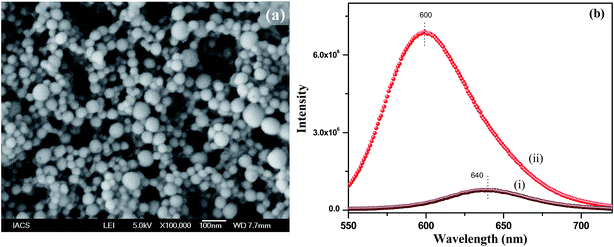 |
| | Fig. 1 (a) SEM image of the NR dye doped PMMA nanoparticles with an IL concentration of 12.5 μM, (b) emission spectra of the NR dye in water in the presence of the IL (i) and within the IL functionalized PMMA polymer nanoparticles (ii). | |
The TGA capped CdTe QD exhibits an absorption band at 470 nm and a PL band at 520 nm after excitation at 375 nm (Fig. S8a†). The quantum yield of the CdTe solution is 3.5%. The average diameter of the CdTe nanoparticles is found from the TEM image to be ∼2.4 nm (Fig. S8b and S8c†). As the nanoparticles are capped with thioglycolic acid (TGA), the zeta potential of the CdTe nanoparticles is −38.2 mV. Thus, the negatively charged CdTe nanoparticles are added to the positively charged dye doped PMMA nanoparticle solution for the preparation of the assemblies. The synthesis pathway of the conjugate system is summarized in Scheme 2. It can be seen from the TEM image of the CdTe QD–IL functionalized PMMA nanoparticle assemblies (Fig. S9†) that the CdTe nanoparticles are attached to the surface of the polymer nanoparticles.
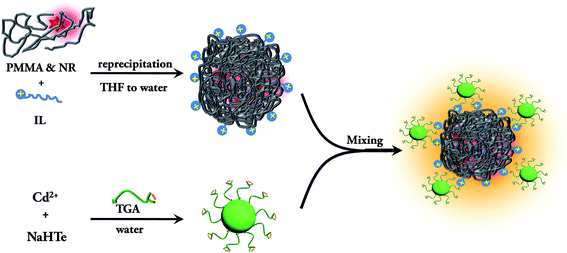 |
| | Scheme 2 Schematic representation of the synthesis of the QD–IL functionalized NR dye doped PMMA nanoparticle assemblies. | |
Fig. 2A shows the absorption spectra of the CdTe QD solution, the NR dye doped (0.44 μM) PMMA polymer solution, the conjugate solution and the mixture of the QD and polymer nanoparticle solutions without IL functionalization. The absorption spectrum of the assemblies exhibits both NR dye and CdTe absorption peaks (plot c). No shifting of the peak position is observed after attachment of the QD with the polymer nanoparticle. The inset of Fig. 2A shows a photograph of the solutions without illumination. Under 365 nm illumination, the CdTe solution shows a bright green emission, and the NR dye doped PMMA solution exhibits a red color. But the QD–NR dye doped PMMA conjugates exhibit a bright yellow emission (inset of Fig. 2B). After the attachment of the CdTe QD with the IL functionalized NR dye doped polymer nanoparticle, quenching of the CdTe emission is observed. Fig. 2B shows the emission spectrum of the QD, the NR dye doped polymer nanoparticle, the NR dye doped PMMA–QD conjugates and a mixture of the QD and NR dye doped polymer nanoparticle without IL functionalization at 375 nm excitation. From Fig. 2B, it is seen that the emission band of the CdTe QD at 520 nm decreases after attachment to the NR dye doped PMMA nanoparticle, whereas the intensity of the NR dye emission (plot b) enhances drastically after the attachment (plot c). No such effect is observed when we mix the CdTe nanoparticle solution with the NR dye doped PMMA nanoparticle without functionalization with the IL. Instead, the intensity of the CdTe fluorescence slightly enhances (plot d) which may be due to the repulsion with the negatively charged PMMA nanoparticles, thus enhancing the fluorescence. Thus, we may say that the IL plays a crucial role for preparing the conjugate system.
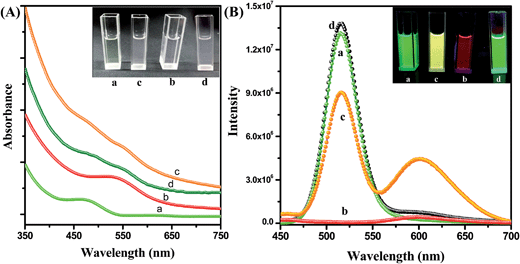 |
| | Fig. 2 (A) UV spectra of the CdTe nanoparticle solution in water (a), the IL functionalized NR dye doped PMMA nanoparticle solution in water (b), the polymer–QD conjugate solution (c), and the mixture of the CdTe and NR dye doped PMMA nanoparticles without IL functionalization (d). The inset shows a photograph of the solutions without illumination. (B) Photoluminescence spectra of the CdTe nanoparticle solution in water (a), the IL functionalized NR dye doped PMMA nanoparticle solution in water (b), the PMMA nanoparticles–QDs assemblies (c), and the mixture of the CdTe and NR dye doped PMMA nanoparticles without IL functionalization (d) at 375 nm excitation. The inset photograph shows the corresponding solutions under 365 nm UV torch light. | |
The enhancement of the NR dye emission and decrease of the CdTe emission in the composite system suggests that there might be an energy transfer process occurring from the outer CdTe nanoparticles to the NR dye confined inside the PMMA. It is interesting to note that there is an overlap of the absorption spectra of the NR dye inside the PMMA with the emission spectra of the CdTe nanoparticle solution. Fig. 3 shows the overlap between the emission of the donor CdTe nanocrystal and the absorption of the acceptor NR dye molecule inside the PMMA. The spectral overlap J(λ)46 between the emission spectrum of the donor and the absorption of the acceptor is given by the equation:
| |  | (4) |
where
F(
λ) represents the emission intensity of the donor at a wavelength
λ, and
ε(
λ) is the molar absorption coefficient of the acceptor. The overlap integral is found to be 3.06 × 10
15 M
−1 cm
−1 nm
4. Thus, there is a very good overlap between the emission spectrum of the donor CdTe and the absorption of the acceptor NR dye molecule inside the PMMA matrix. Therefore, an energy transfer process occurs from the outer CdTe molecule to the NR dye molecules inside the polymer nanoparticles. For further understanding and confirmation of the energy transfer process from the CdTe to the NR dye encapsulated polymer nanoparticles, we have performed systematic studies by varying the concentration of the acceptor NR dye inside the PMMA nanoparticle (
Fig. 4A). It can be observed that the emission of the CdTe quenches gradually and the emission of the NR dye increases with increasing acceptor NR dye concentration within the PMMA nanoparticle at 375 nm excitation. The PL intensity of the NR dye inside the PMMA is very low at 375 nm excitation (plot b,
Fig. 2B). Thus, the enhanced PL intensity of the acceptor (NR dye) is due to the energy transfer only, which is discussed further by measuring the decay time of the acceptor. The PL quenching efficiencies vary from 18% to 60% when changing the concentration from 0.11 μM to 0.88 μM. This quenching of the CdTe emission occurs due to the energy transfer process that can proceed
via radiative or nonradiative pathways. To understand the energy transfer process more clearly, we have measured the decay times of pure CdTe and of the conjugate system with increasing NR dye concentrations (
Fig. 4B). The decay profiles are well fitted with tri-exponentials. It can be seen that the decay times of the CdTe QDs decrease gradually with an increase of the NR dye concentration within the attached PMMA nanoparticles. The average decay time of the CdTe QDs is found to be 11.08 ns. The average decay time decreases to 8.62 ns, 6.51 ns, 5.39 ns, 4.16 ns and 2.99 ns after the attachment to 0.11, 0.22, 0.44, 0.66 and 0.88 μM NR dye doped PMMA nanoparticles, respectively. The decay time parameters are summarized in
Table 1. The decay time of the CdTe QDs decreases with increasing acceptor concentration, which suggests that the energy transfer occurs
via a nonradiative pathway from the CdTe to the NR dye molecule inside the PMMA. The energy transfer efficiency can be calculated using the following equation:
where
τDA and
τD are the average decay times of the conjugate solution and the pure CdTe QDs, respectively. The energy transfer efficiency from the CdTe to 0.88 μM NR dye doped PMMA nanoparticles is found to be 73%. Again, we have measured the fluorescence lifetime of the acceptor NR dye molecule inside the PMMA, monitored at 600 nm, before and after attachment with the CdTe QDs (
Fig. 5) at an excitation wavelength of 375 nm. It is found that the decay time of the NR dye molecule increases from 2.38 ns to 3.14 ns. This enhancement of the lifetime of the acceptor molecule also confirms the energy transfer process.
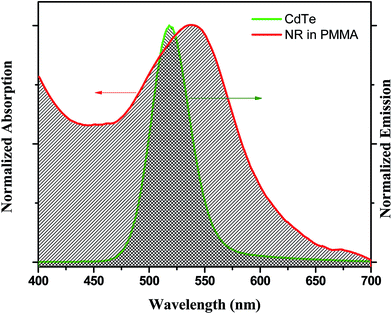 |
| | Fig. 3 The overlap plot between the emission spectrum of the CdTe nanoparticle solution and the absorption spectrum of the IL functionalized NR dye doped PMMA nanoparticle solution. | |
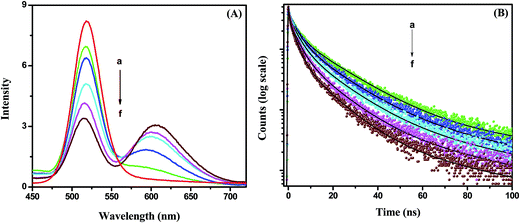 |
| | Fig. 4 (A) Photoluminescence spectra of the CdTe nanoparticle without (a) and with NR dye concentrations of (b) 0.11 μM, (c) 0.22 μM, (d) 0.44 μM, (e) 0.66 μM and (f) 0.88 μM within the PMMA nanoparticle of the hybrid solution. (B) Time-resolved decay time plots of the CdTe nanoparticle without (a) and with NR dye concentrations of (b) 0.11 μM, (c) 0.22 μM, (d) 0.44 μM, (e) 0.66 μM and (f) 0.88 μM within the PMMA nanoparticle assemblies. | |
Table 1 Decay time parameters of the CdTe QDs with an increase of the NR dye concentration within the PMMA nanoparticles
| Concentration of NR dye |
τ
1 (ns) (α1) |
τ
2 (ns) (α2) |
τ
3 (ns) (α3) |
〈τ〉 (ns) |
| Pure CdTe |
2.23 (0.36) |
10.89 (0.48) |
31.55 (0.16) |
11.08 |
| 0.11 μM |
1.21 (0.42) |
8.33 (0.43) |
30.20 (0.15) |
8.62 |
| 0.22 μM |
0.84 (0.45) |
6.82 (0.43) |
26.68 (0.12) |
6.51 |
| 0.44 μM |
0.82 (0.48) |
6.03 (0.42) |
24.66 (0.10) |
5.39 |
| 0.66 μM |
0.77 (0.55) |
5.52 (0.38) |
23.52 (0.07) |
4.16 |
| 0.88 μM |
0.56 (0.57) |
4.22 (0.36) |
19.21 (0.06) |
2.99 |
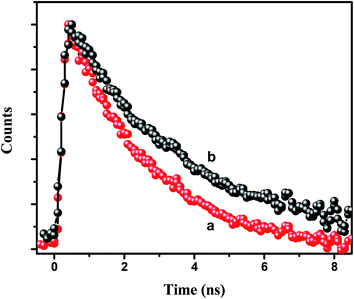 |
| | Fig. 5 Decay time plot of the NR dye inside the IL functionalized NR dye doped PMMA nanoparticles (a) before and (b) after the attachment with the CdTe QDs at an excitation of 375 nm and with the emission monitored at 600 nm. | |
The time resolved anisotropy decay measurement is being used to understand the rotational motion of the dye molecules inside the PMMA nanoparticles. The motion of the dye molecules becomes restricted when the NR dye molecule is encapsulated inside the polymer nanoparticles, which controls the photophysical behavior of the encapsulated dye molecules. We have previously reported on the restricted motions of the encapsulated dye molecules inside the polymer matrix.24 As the polymer nanoparticles are large in size compared to the dye molecule, the rotational times of the nanoparticles are comparatively large (μs time scale). Thus, the Brownian motion of the nanoparticles does not affect the rotational motion of the encapsulated dye molecules inside the polymer nanoparticles. We have measured the fluorescence anisotropy decay of the NR dye emission in the CdTe attached polymer nanoparticle solution (NR dye concentration of 0.44 μM) at 489 nm, i.e. direct excitation of the NR dye, and 375 nm, i.e. at the excitation of the CdTe (Fig. 6). The fluorescence anisotropy decay is fitted with a bi-exponential function:
| |  | (6) |
where
τslow and
τfast are the two reorientation times associated with the slow and fast motions of the NR dye in the PMMA nanoparticles.
a is the pre-exponential factor which indicates the relative contributions of the slow and fast motions to the anisotropy decay. The average reorientation time 〈
τr〉 can be expressed as
| | | 〈τr〉 = aτslow + (1 − a)τfast | (7) |
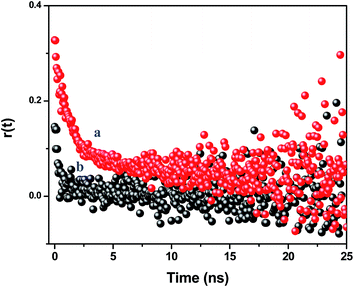 |
| | Fig. 6 Time resolved anisotropy decay curves of the assemblies monitored at 600 nm at an excitation of (a) 489 nm and (b) 375 nm. | |
At the direct excitation of the NR dye (489 nm), the fluorescence anisotropy decay is polarized due to restricted motion of the NR dye molecules inside the PMMA matrix and the r(0) value is found to be 0.325. The average reorientation time is 3.15 ns with a faster component of 0.91 ns (65%) and a slow component of 7.32 ns (35%). When we monitor the fluorescence anisotropy decay of the NR dye at the CdTe QD excitation (375 nm), the reduction of the anisotropy confirms the depolarization of the NR dye emission. In this case, the r(0) value is found to be 0.13 and the average reorientation time is 0.64 ns with a faster component of 0.48 ns (93%) and a slow component of 3.25 ns (7%). This depolarization occurs due to the energy transfer from the surface CdTe QDs to the randomly distributed NR dye molecules inside the PMMA nanoparticles.47 It reveals that the efficient energy transfer takes place from the QDs to the NR dye molecules inside the polymer nanoparticles. This energy migration from the surface to the centre of a nanoparticle can open up new possibilities for light harvesting applications.
Conclusion
We have successfully demonstrated the preparation of dye encapsulated polymer nanoparticle–CdTe QD assemblies by attaching positively surface charged polymer nanoparticles to negatively charged QDs using an ionic liquid. The QDs are used as the antenna materials and they rapidly transfer energy to dye molecules encapsulated in the polymer nanoparticles. Steady state and time resolved spectroscopic studies confirm the energy transfer from the QDs to the Nile Red dye. A time resolved anisotropy measurement shows the depolarization of the NR dye emission inside the PMMA nanoparticles via an energy transfer pathway. Thus, this IL functionalized dye doped polymer NP and QD hybrid nanostructure can open up new possibilities for designing light harvesting nanostructures for future applications.
Acknowledgements
SERB (DST) and Indo-Spain (DST) are gratefully acknowledged for financial support. SK thanks CSIR and SB thanks IACS for awarding fellowship.
References
- J. G. Woller, J. K. Hannestad and B. Albinsson, J. Am. Chem. Soc., 2013, 135, 2759–2768 CrossRef CAS PubMed.
- P. K. Dutta, R. Varghese, J. Nangreave, S. Lin, H. Yan and Y. Liu, J. Am. Chem. Soc., 2011, 133, 11985–11993 CrossRef CAS PubMed.
- G. Jiang, A. S. Susha, A. A. Lutich, F. D. Stefani, J. Feldmann and A. L. Rogach, ACS Nano, 2009, 3, 4127–4131 CrossRef CAS PubMed.
- T. Ishi-i, K.-I. Murakami, Y. Imai and S. Mataka, Org. Lett., 2005, 7, 3175–3178 CrossRef CAS PubMed.
- K. Sugiyasu, N. Fujita and S. Shinkai, Angew. Chem., 2004, 116, 1249–1253 CrossRef.
- A. Ajayaghosh, V. K. Praveen and C. Vijayakumar, Chem. Soc. Rev., 2008, 37, 109–122 RSC.
- A. Adronov and J. M. J. Frechet, Chem. Commun., 2000, 1701–1710 RSC.
- N. Nishiyama, H. R. Stapert, G.-D. Zhang, D. Takasu, D.-L. Jiang, T. Nagano, T. Aida and K. Kataoka, Bioconjugate Chem., 2003, 14, 58–66 CrossRef CAS PubMed.
- K. V. Rao, K. K. R. Datta, M. Eswaramoorthy and S. J. George, Chem.–Eur. J., 2012, 18, 2184–2194 CrossRef CAS PubMed.
- A. Adronov, S. L. Gilat, J. M. J. Fréchet, K. Ohta, F. V. R. Neuwahl and G. R. Fleming, J. Am. Chem. Soc., 2000, 122, 1175–1185 CrossRef CAS.
- A. Ajayaghosh, S. J. George and V. K. Praveen, Angew. Chem., Int. Ed., 2003, 42, 332–335 CrossRef CAS PubMed.
- M. Cotlet, T. Vosch, S. Habuchi, T. Weil, K. Müllen, J. Hofkens and F. De Schryver, J. Am. Chem. Soc., 2005, 127, 9760–9768 CrossRef CAS PubMed.
- T. Sen, S. Jana, S. Koner and A. Patra, J. Phys. Chem. C, 2009, 114, 707–714 Search PubMed.
- C. N. Fleming, P. Jang, T. J. Meyer and J. M. Papanikolas, J. Phys. Chem. B, 2004, 108, 2205–2209 CrossRef CAS.
- N. Kameta, K. Ishikawa, M. Masuda, M. Asakawa and T. Shimizu, Chem. Mater., 2012, 24, 209–214 CrossRef CAS.
- G. Calzaferri, Langmuir, 2012, 28, 6216–6231 CrossRef CAS PubMed.
- G. Calzaferri, S. Huber, H. Maas and C. Minkowski, Angew. Chem., Int. Ed., 2003, 42, 3732–3758 CrossRef CAS PubMed.
- Z. Tian, J. Yu, C. Wu, C. Szymanski and J. McNeill, Nanoscale, 2010, 2, 1999–2011 RSC.
- C. Martin, S. Bhattacharyya, A. Patra and A. Douhal, Photochem. Photobiol. Sci., 2014, 13, 1241–1252 CAS.
- E. J. Harbron, C. M. Davis, J. K. Campbell, R. M. Allred, M. T. Kovary and N. J. Economou, J. Phys. Chem. C, 2009, 113, 13707–13714 CAS.
- C. Wu, Y. Zheng, C. Szymanski and J. McNeill, J. Phys. Chem. C, 2008, 112, 1772–1781 CAS.
- S. Bhattacharyya, S. Prashanthi, P. R. Bangal and A. Patra, J. Phys. Chem. C, 2013, 117, 26750–26759 CAS.
- Z. Tian, J. Yu, X. Wang, L. C. Groff, J. L. Grimland and J. D. McNeill, J. Phys. Chem. B, 2012, 117, 4517–4520 CrossRef PubMed.
- S. Bhattacharyya, B. Paramanik and A. Patra, J. Phys. Chem. C, 2011, 115, 20832–20839 CAS.
- Y. Jin, F. Ye, M. Zeigler, C. Wu and D. T. Chiu, ACS Nano, 2011, 5, 1468–1475 CrossRef CAS PubMed.
- A. O. Govorov, Adv. Mater., 2008, 20, 4330–4335 CrossRef CAS.
- I. Robel, V. Subramanian, M. Kuno and P. V. Kamat, J. Am. Chem. Soc., 2006, 128, 2385–2393 CrossRef CAS PubMed.
- X. Michalet, F. F. Pinaud, L. A. Bentolila, J. M. Tsay, S. Doose, J. J. Li, G. Sundaresan, A. M. Wu, S. S. Gambhir and S. Weiss, Science, 2005, 307, 538–544 CrossRef CAS PubMed.
- U. Resch-Genger, M. Grabolle, S. Cavaliere-Jaricot, R. Nitschke and T. Nann, Nat. Methods, 2008, 5, 763–775 CrossRef CAS PubMed.
- A. Makhal, H. Yan, P. Lemmens and S. K. Pal, J. Phys. Chem. C, 2009, 114, 627–632 Search PubMed.
- I. L. Medintz and H. Mattoussi, Phys. Chem. Chem. Phys., 2009, 11, 17–45 RSC.
- R. Wargnier, A. V. Baranov, V. G. Maslov, V. Stsiapura, M. Artemyev, M. Pluot, A. Sukhanova and I. Nabiev, Nano Lett., 2004, 4, 451–457 CrossRef CAS.
- S. Sadhu, K. K. Haldar and A. Patra, J. Phys. Chem. C, 2010, 114, 3891–3897 CAS.
- J. Ji, L. He, Y. Shen, P. Hu, X. Li, L.-P. Jiang, J.-R. Zhang, L. Li and J.-J. Zhu, Anal. Chem., 2014, 86, 3284–3290 CrossRef CAS PubMed.
- A. C. S. Samia, S. Dayal and C. Burda, Photochem. Photobiol., 2006, 82, 617–625 CrossRef CAS PubMed.
- E. R. Goldman, I. L. Medintz, J. L. Whitley, A. Hayhurst, A. R. Clapp, H. T. Uyeda, J. R. Deschamps, M. E. Lassman and H. Mattoussi, J. Am. Chem. Soc., 2005, 127, 6744–6751 CrossRef CAS PubMed.
- S. Jin, H.-J. Son, O. K. Farha, G. P. Wiederrecht and J. T. Hupp, J. Am. Chem. Soc., 2013, 135, 955–958 CrossRef CAS PubMed.
- B. J. Walker, V. Bulović and M. G. Bawendi, Nano Lett., 2010, 10, 3995–3999 CrossRef CAS PubMed.
- S. N. Clafton, D. A. Beattie, A. Mierczynska-Vasilev, R. G. Acres, A. C. Morgan and T. W. Kee, Langmuir, 2010, 26, 17785–17789 CrossRef CAS PubMed.
- C. Wu, T. Schneider, M. Zeigler, J. Yu, P. G. Schiro, D. R. Burnham, J. D. McNeill and D. T. Chiu, J. Am. Chem. Soc., 2010, 132, 15410–15417 CrossRef CAS PubMed.
- R. S. Varma and V. V. Namboodiri, Chem. Commun., 2001, 643–644 RSC.
- S. Kundu, A. Kar and A. Patra, J. Lumin., 2012, 132, 1400–1406 CrossRef CAS PubMed.
- D. Tuncel and H. V. Demir, Nanoscale, 2010, 2, 484–494 RSC.
- A. L. Rogach, T. Franzl, T. A. Klar, J. Feldmann, N. Gaponik, V. Lesnyak, A. Shavel, A. Eychmüller, Y. P. Rakovich and J. F. Donegan, J. Phys. Chem. C, 2007, 111, 14628–14637 CAS.
- S. Kundu, S. Sadhu, R. Bera, B. Paramanik and A. Patra, J. Phys. Chem. C, 2013, 117, 23987–23995 CAS.
-
J. R. Lakowicz, Principles of fluorescence spectroscopy, 3rd edn, 2006, vol. XXVI, p. 954 Search PubMed.
- M. N. Berberan-Santos and B. Valeur, J. Chem. Phys., 1991, 95, 8048–8055 CrossRef CAS PubMed.
Footnote |
| † Electronic supplementary information (ESI) available: NMR (proton and COSY) and mass spectra of the IL; SEM images of the NR dye doped PMMA nanoparticles with IL concentrations of 6.25 μM and 25 μM; size distribution plot of the PMMA nanoparticles with different IL concentrations; absorption spectra of the NR dye encapsulated in the PMMA nanoparticles with and without functionalization by the IL; emission spectra of the NR dye doped PMMA nanoparticles at an excitation of 525 nm without IL functionalization and with increasing concentrations of the IL; normalized absorption and emission spectra of TGA capped CdTe nanocrystals; TEM image of the as prepared TGA capped CdTe nanocrystals in water; TEM image of the assemblies. See DOI: 10.1039/c4mh00138a |
|
| This journal is © The Royal Society of Chemistry 2015 |
Click here to see how this site uses Cookies. View our privacy policy here. 


